Markets
News
Analysis
User
24/7
Economic Calendar
Education
Data
- Names
- Latest
- Prev


Signal Accounts for Members
All Signal Accounts
All Contests


Euro Zone Employment YoY (SA) (Q3)A:--
F: --
P: --
Euro Zone GDP Final YoY (Q3)A:--
F: --
P: --
Euro Zone GDP Final QoQ (Q3)A:--
F: --
P: --
Euro Zone Employment Final QoQ (SA) (Q3)A:--
F: --
P: --
Euro Zone Employment Final (SA) (Q3)A:--
F: --
Brazil PPI MoM (Oct)A:--
F: --
P: --
Mexico Consumer Confidence Index (Nov)A:--
F: --
P: --
Canada Unemployment Rate (SA) (Nov)A:--
F: --
P: --
Canada Labor Force Participation Rate (SA) (Nov)A:--
F: --
P: --
Canada Employment (SA) (Nov)A:--
F: --
P: --
Canada Part-Time Employment (SA) (Nov)A:--
F: --
P: --
Canada Full-time Employment (SA) (Nov)A:--
F: --
P: --
U.S. Personal Income MoM (Sept)A:--
F: --
P: --
U.S. PCE Price Index YoY (SA) (Sept)A:--
F: --
P: --
U.S. PCE Price Index MoM (Sept)A:--
F: --
P: --
U.S. Personal Outlays MoM (SA) (Sept)A:--
F: --
P: --
U.S. Core PCE Price Index MoM (Sept)A:--
F: --
P: --
U.S. Core PCE Price Index YoY (Sept)A:--
F: --
P: --
U.S. UMich 5-Year-Ahead Inflation Expectations Prelim YoY (Dec)A:--
F: --
P: --
U.S. Real Personal Consumption Expenditures MoM (Sept)A:--
F: --
P: --
U.S. 5-10 Year-Ahead Inflation Expectations (Dec)A:--
F: --
P: --
U.S. UMich Current Economic Conditions Index Prelim (Dec)A:--
F: --
P: --
U.S. UMich Consumer Sentiment Index Prelim (Dec)A:--
F: --
P: --
U.S. UMich 1-Year-Ahead Inflation Expectations Prelim (Dec)A:--
F: --
P: --
U.S. UMich Consumer Expectations Index Prelim (Dec)A:--
F: --
P: --
U.S. Weekly Total Rig CountA:--
F: --
P: --
U.S. Weekly Total Oil Rig CountA:--
F: --
P: --
U.S. Unit Labor Cost Prelim (SA) (Q3)--
F: --
P: --
U.S. Consumer Credit (SA) (Oct)A:--
F: --
P: --
China, Mainland Foreign Exchange Reserves (Nov)A:--
F: --
P: --
China, Mainland Exports YoY (USD) (Nov)--
F: --
P: --
China, Mainland Imports YoY (CNH) (Nov)--
F: --
P: --
China, Mainland Imports YoY (USD) (Nov)--
F: --
P: --
China, Mainland Imports (CNH) (Nov)--
F: --
P: --
China, Mainland Trade Balance (CNH) (Nov)--
F: --
P: --
China, Mainland Exports (Nov)--
F: --
P: --
Japan Wages MoM (Oct)--
F: --
P: --
Japan Trade Balance (Oct)--
F: --
P: --
Japan Nominal GDP Revised QoQ (Q3)--
F: --
P: --
Japan Trade Balance (Customs Data) (SA) (Oct)--
F: --
P: --
Japan GDP Annualized QoQ Revised (Q3)--
F: --
China, Mainland Exports YoY (CNH) (Nov)--
F: --
P: --
China, Mainland Trade Balance (USD) (Nov)--
F: --
P: --
Germany Industrial Output MoM (SA) (Oct)--
F: --
P: --
Euro Zone Sentix Investor Confidence Index (Dec)--
F: --
P: --
Canada Leading Index MoM (Nov)--
F: --
P: --
Canada National Economic Confidence Index--
F: --
P: --
U.S. Dallas Fed PCE Price Index YoY (Sept)--
F: --
P: --
U.S. 3-Year Note Auction Yield--
F: --
P: --
U.K. BRC Overall Retail Sales YoY (Nov)--
F: --
P: --
U.K. BRC Like-For-Like Retail Sales YoY (Nov)--
F: --
P: --
Australia Overnight (Borrowing) Key Rate--
F: --
P: --
RBA Rate Statement
RBA Press Conference
Germany Exports MoM (SA) (Oct)--
F: --
P: --
U.S. NFIB Small Business Optimism Index (SA) (Nov)--
F: --
P: --
Mexico Core CPI YoY (Nov)--
F: --
P: --
Mexico 12-Month Inflation (CPI) (Nov)--
F: --
P: --
Mexico PPI YoY (Nov)--
F: --
P: --
Mexico CPI YoY (Nov)--
F: --
P: --
U.S. Weekly Redbook Index YoY--
F: --
P: --


No matching data
Latest Views
Latest Views
Trending Topics
Top Columnists
Latest Update
White Label
Data API
Web Plug-ins
Affiliate Program
View All

No data
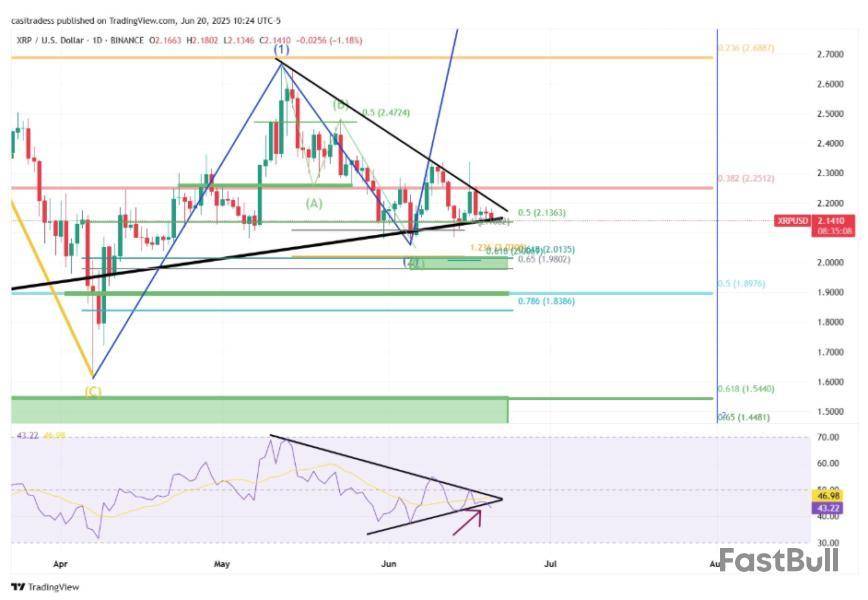
Crypto education and media platform Coin Bureau has shared some puzzling developments on the XRP market that may hint at a prolonged bearish future. Notably, the altcoin has been a major headliner amidst a general crypto market correction in the past one month. During this period, XRP prices have dipped by over 10% with current market prices around $2.13. While crypto enthusiasts remain hopeful of market resurgence, Coin Bureau’s recent revelations shows that on-chain data suggests otherwise.
XRP $3 Target Impossible Amid Declining Network Activity – Analyst
According to an X post by Coin Bureau on June 20, XRP is facing an uphill task in regaining its bullish form due to network engagement crises. Notably, data from Glassnode shows that new wallets on the XRP Ledger have crashed from above 30,000 new addresses daily in January to presently below 5,000 new addresses daily. Interestingly, the chart by Glassnode presents a strong correlation between price action and network growth. The surge in wallet creation during late Q4 2024 was accompanied by a parabolic move in price that brought XRP to trade as high as $2.71. However, as the rate of new users entering the network began to decline, XRP’s price action also entered a consolidation and gradual downward trend.
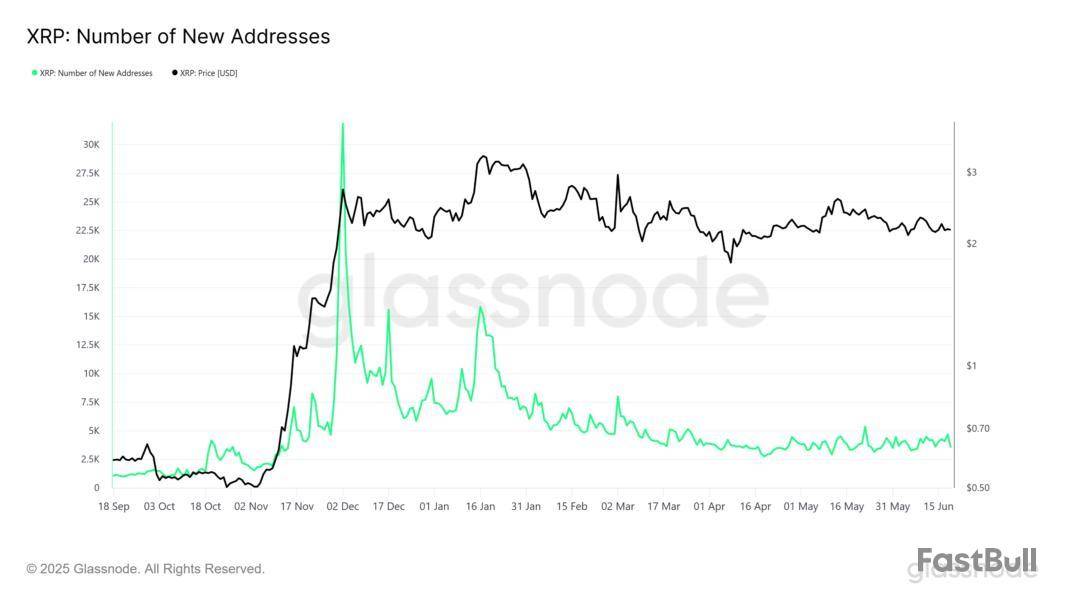
Amidst other developments, Coin Bureau also highlights XRP’s daily active addresses has experienced a staggering drop from 557,000 to 34,000 to further suggest a lack of retail investor interest in the XRP ecosystem. According to the market analyst, the glaring fall in network engagement indicates XRP may lack sufficient market demand to support a bullish climb towards the $3 price region which is a crucial resistance zone. However, other analysts have presented an alternative theory. In particular, a market expert with X pseudonym MoonLambo explains the previous highs in network activity seen in Q4 2024 and January coincided with a period of widespread market greed following the US general elections. The analyst claims the decline is normal alongside social trends rather and is overemphasized by Coin Bureau.
XRP Price Outlook
At the time of writing, XRP continues to trade at $2.13 reflecting a 1.33% decline in the past day. Meanwhile, the asset’s daily trading volume is up by 22.29% and valued at $2.25 billion. According to data from prediction site CoinCodex, XRP Investors still remain largely bearish but the Fear & Greed Index stands neutral at 54.
CoinCodex analysts are predicting XRP to remain in consolidation for the short term with predictions of $2.12 in one month. However, they forecast a steady long-term bullish revival with projections of $2.45 in three months and $3.03 in six months.
Stablecoin backing is under fresh fire after outspoken economist and gold supporter Peter Schiff took aim at tokens tied to US dollar reserves. He argues that relying on a fiat currency he views as shaky makes little sense when a more stable asset exists.
His comments have reignited a long‑running debate about what should sit behind digital coins that promise a steady peg.
Schiff Questions Fiat Backing
According to Schiff, it makes no sense to support a token pegged to a currency that can be inflated away. “I get Bitcoin, but not US dollar stablecoins,” he wrote in a social media post.
He pointed out that fiat money can be printed in large amounts, while gold has a fixed supply and centuries of use as money. Schiff said gold cannot be easily devalued by inflation or reckless monetary policies.
Peter Schiff@PeterSchiffJun 19, 2025I get Bitcoin, but not U.S. dollar stablecoins. If you’re going to introduce a third party custodian, why settle for a token backed by a flawed fiat currency like the dollar, when you can own one backed by gold? You get the same liquidity, but you also get a real store of value.
Gold‑Backed Tokens On The Rise
Based on reports, gold‑backed stablecoins are seeing more interest from investors worried about inflation and dollar weakness. Tokens like Tether Gold (XAUT) and Paxos Gold (PAXG) let users move digital claims on physical gold. These assets give the same quick transfers and high liquidity as dollar‑pegged coins but tie each token to real metal stored in vaults.Regulatory Scrutiny Intensifies
Regulators across the globe are racing to establish precise regulations for stablecoin reserves. Congress members in the US are considering tighter reserve and audit requirements. Europe and Asia are creating their own regulations to achieve transparency and safeguard users. Schiff’s call for gold introduces additional context to these discussions. It could lead regulators to explore whether commodities can serve as backing for tokens under particular regimes.Market Reaction Mixed
According to reports, Schiff’s tweet trended, garnering over 500,000 views within 24 hours. Crypto naysayers applauded his observation on fiat risk. Other investors cautioned that gold-backed tokens have higher fees and cumbersome custody expenses. They explained that transferring metal or establishing physical reserves introduces friction when compared with exchanging dollar-backed coins at a bank custodian.
Investors also pointed out that stablecoins are widely used in lending, trading and payments within DeFi platforms. Dollar‑pegged tokens like USDC and USDT dominate these flows because they tie directly into existing banking rails. Gold‑backed coins, by contrast, tend to be held as digital bullion rather than spent on everyday transactions.
Featured image Imagen, chart from TradingView
U.S. spot Ethereum ETFs saw their largest outflow since mid-May on Friday, before ether's price tumbled below $2,400 on Saturday. Spot Bitcoin ETFs, on the other hand, continued to set cumulative inflow records with a 9-day streak of net positive inflows.
The Ethereum ETF outflows were led by a $19.7 million outflow from BlackRock's ETHA fund, the largest such fund on the market by assets under management (AUM). The fund still holds $4.03 billion worth of assets, a hair more than the total AUM of Grayscale's two funds — ETHE and ETH — which hold $4.02 billion combined, according to SoSoValue data.
The outflows from BlackRock's fund were slightly offset by $6.6 million worth of inflows into Grayscale's ETH on Friday and $1.8 million in inflows to VanEck's ETHV fund, with an AUM of $114.8 million. The price of ETH is down about 5% over the past seven days, according to The Block's Ethereum Price page, dipping below $2,400 on Saturday afternoon.
Despite the outflows, the ETH funds have logged around $840 million in cumulative net inflows since the start of the month. "The data suggests institutions remain constructive on crypto's medium-term upside, but Ethereum's catch-up phase appears to be over," BRN Lead Research Analyst Valentin Fournier told The Block recently.
Bitcoin ETFs keep setting new cumulative inflow records
While Ethereum funds bled, spot Bitcoin ETFs set a new cumulative inflow total high on Friday, the fifth straight day a new record has been set, according to SoSoValue data. The funds have logged $46.7 billion in cumulative net inflows.
However, Friday's meager inflow of $6.4 million was the smallest inflow sum since June 6, which saw $47.8 million worth of outflows, signaling a possible reduction in demand for the BTC funds. BlackRock's IBIT, the market-leading fund, logged $46.9 million worth of inflows, while Fidelity's FBTC saw $40.6 million worth of outflows.
Spot Bitcoin ETFs now account for around a quarter of global Bitcoin trading volume, The Block recently reported, though transactions on the actual Bitcoin blockchain are hitting 18-month lows. Speculative bets around Bitcoin-native protocols Runes and Ordinals have largely failed to pan out as demand cools.
The price of Bitcoin is down around 1% in the past 24 hours, according to The Block's Bitcoin Price page.
Disclaimer: The Block is an independent media outlet that delivers news, research, and data. As of November 2023, Foresight Ventures is a majority investor of The Block. Foresight Ventures invests in other companies in the crypto space. Crypto exchange Bitget is an anchor LP for Foresight Ventures. The Block continues to operate independently to deliver objective, impactful, and timely information about the crypto industry. Here are our current financial disclosures.
© 2025 The Block. All Rights Reserved. This article is provided for informational purposes only. It is not offered or intended to be used as legal, tax, investment, financial, or other advice.
After weeks of lower highs and higher lows, XRP’s daily candlestick price chart is now giving a signal that could dictate the next major move. Although the token is still holding above key horizontal levels near $2.13, technical data suggests momentum is starting to slip. A technical analysis of XRP’s daily RSI indicator offers a clue into what comes next, and it’s not necessarily bullish in the short term.
XRP RSI Breakdown: Loss Of Strength In Momentum
According to an analysis posted by crypto chartist CasiTrades on the social media platform X, XRP’s Relative Strength Index (RSI) has just broken beneath a well-respected trendline that had been tracking higher lows since early April. The breakdown of this RSI structure, which is shown on the lower half of the chart below, is a strong shift in the short-term momentum dynamics for XRP.
It shows that despite the XRP price holding relatively flat above the 0.5 Fibonacci level at $2.13, internal market strength has clearly weakened.
The RSI had been forming a tightening wedge pattern for weeks, just like the price action’s compression at the apex of a symmetrical triangle on the daily timeframe. This type of RSI trendline break typically signals a coming volatility expansion, and as the analyst warns, the release may come with a sharp sweep to major support before XRP reverses.
It’s a common occurrence for major price reversals to be preceded by a push into lower supports. In the case of XRP, crypto analyst CasiTrades highlighted some price targets to watch for reversals in case there’s a breakdown in XRP price.
Support Levels At Risk: XRP Searching For Rebound Level
XRP’s price action is now entering an important test phase, one that could take its price lower before rebounding for the next major rally. Analysis from CasiTrades shows a few demand zones where buyers have stepped in. These demand zones are situated at $2.01, which aligns with the 1.236 Fibonacci extension, the $1.90 price level, and $1.55, which corresponds with the 0.618 retracement level from one of the recent rallies.
These levels are filled with enough liquidity, and until XRP breaks and holds above $3, these supports will always be in play. If XRP hits one of these support levels cleanly and exhibits a sharp V-shaped recovery, that would signal the market found its pivot.
However, if XRP approaches these levels and stalls or bounces prematurely, that may lead to a final shakeout move, forming a deeper low before the real reversal begins. Either way, the RSI breakdown has now tilted short-term risk toward the downside, at least until price confirms a strong reclaim above $2.50 and $3.
At the time of writing, XRP is trading at $2.11, down by 2% in the past 24 hours.
Featured image from Picjumbo, chart from TradingView
White Label
Data API
Web Plug-ins
Poster Maker
Affiliate Program
The risk of loss in trading financial instruments such as stocks, FX, commodities, futures, bonds, ETFs and crypto can be substantial. You may sustain a total loss of the funds that you deposit with your broker. Therefore, you should carefully consider whether such trading is suitable for you in light of your circumstances and financial resources.
No decision to invest should be made without thoroughly conducting due diligence by yourself or consulting with your financial advisors. Our web content might not suit you since we don't know your financial conditions and investment needs. Our financial information might have latency or contain inaccuracy, so you should be fully responsible for any of your trading and investment decisions. The company will not be responsible for your capital loss.
Without getting permission from the website, you are not allowed to copy the website's graphics, texts, or trademarks. Intellectual property rights in the content or data incorporated into this website belong to its providers and exchange merchants.
Not Logged In
Log in to access more features

FastBull Membership
Not yet
Purchase
Log In
Sign Up