





- USDCAD
- XAUUSD
- XAGUSD
- WTI
- USDX








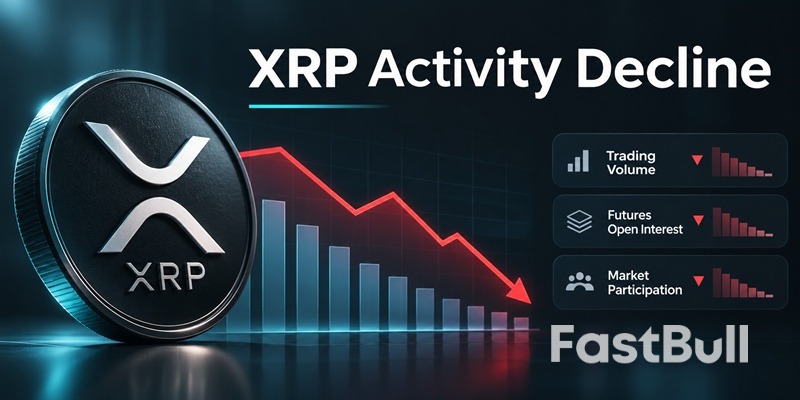
XRP activity has weakened across parts of the trading market, with futures open interest falling sharply over the past month. Yet activity on the XRP Ledger has shown signs of growth. Comparing exchange data with on-chain metrics helps explain whether traders are stepping back or network use is also slowing.
Which XRP Activity Metrics Are Actually Declining?
XRP activity is not measured by one number. Spot volume tracks direct buying and selling, futures volume shows derivatives trading, open interest measures positions that remain open, and active addresses reflect use of the XRP Ledger. These indicators can move in different directions.
Falling XRP Spot Trading Volume
Spot trading volume measures the value of XRP traded directly on exchanges. A decline generally indicates less trading activity during the measured period, but it does not reveal by itself whether buyers or sellers are in control.
At the time of review on November 20, 2026, CoinGlass data showed 24-hour XRP spot volume of about $540 million, down 0.34%. Futures volume stood near $2.33 billion, down 3.63%, while open interest was approximately $1.87 billion, down 4.33%. These short-term changes show modest declines, but they are not enough by themselves to establish a long-term trend.
Lower spot volume can also reduce liquidity. When fewer orders are available, a large buy or sell order may move the price more than it would in a deeper market. That can make price swings sharper, especially during uncertain conditions.
Declining Futures Trading Volume and Open Interest
Futures volume measures the value of derivatives contracts traded during a period. Open interest (OI), by contrast, measures the value or number of outstanding contracts that have not been closed or settled. Volume measures activity during a period; OI measures positions that remain open.
CoinGlass data cited in a November 18 market report showed XRP futures open interest falling from about $3.4 billion on October 8 to roughly $1.9 billion on November 18, a decline of around 44%. This points to a substantial reduction in outstanding derivatives exposure.
Because these are dollar-denominated figures, falling XRP prices can also reduce the reported value of open interest. The percentage decline in dollar value is not necessarily identical to the change in the number of contracts. Investors should compare OI in both dollar terms and XRP or contract units when possible.
Is XRP Ledger Network Activity Also Falling?
Not necessarily. Exchange trading and XRP Ledger activity measure different things. The November 18 report also cited Token Terminal data showing that daily active addresses on the ledger had reached about 48,400, compared with roughly 15,000 to 20,000 during August and September.
Token Terminal defines daily active addresses as unique addresses that initiate transactions within a 24-hour period. An address is not the same as an individual user, since one person or organization may control multiple addresses, and some addresses may belong to services or automated activity.
This creates an important distinction: derivatives participation can fall while ledger activity rises. A decline in XRP trading volume or futures positioning should not automatically be described as a decline in XRP Ledger adoption.
Why Is XRP Market Participation Weakening?
The pullback in XRP market activity may reflect a combination of reduced speculative exposure, price uncertainty, and weaker risk appetite across the cryptocurrency market. The available indicators show what changed, but they do not establish one single cause.
Traders Are Reducing Speculative Exposure
Falling open interest suggests that outstanding futures positions are being closed faster than new ones are being opened. Traders may be reducing leverage, taking profits, cutting losses, or waiting for clearer price signals before committing more capital.
This does not mean that every trader is turning bearish. Both long and short positions can be closed, and OI alone does not identify which side is leaving the market. Funding rates, long-short positioning, and liquidation data are needed to understand the balance of sentiment.
Price Declines and Liquidations Are Pressuring Market Activity
Sharp price declines can force leveraged traders to close positions. When a long position no longer meets margin requirements, an exchange may liquidate it, adding to selling pressure and making other traders more cautious.
Liquidations can temporarily increase trading volume, but they do not represent healthy or sustained demand. If forced closures are followed by lower open interest and weaker spot volume, the market may be entering a period of reduced speculative participation.
Broader Crypto Market Sentiment Is Limiting Demand
XRP also responds to changes in broader cryptocurrency risk appetite. When Bitcoin and other major assets sell off, traders often reduce exposure to altcoins or hold more cash and stablecoins. That can weaken XRP spot turnover and derivatives activity even when there is no XRP-specific development.
This market-wide effect matters when interpreting XRP data. A fall in activity may reflect a wider reduction in risk-taking rather than a problem unique to the XRP Ledger. Comparing XRP with broader market volume and volatility helps distinguish those possibilities.
What Falling Trading Volume and Open Interest Reveal About XRP
When XRP's price falls alongside lower spot volume, the market may be experiencing weaker participation rather than an aggressive increase in selling. If price falls while volume rises, selling pressure may be more forceful. Volume is most useful when read alongside price direction and liquidity.
Open interest adds another layer. If price and OI fall together, traders may be closing positions and reducing leverage. If price falls while OI rises, new positions may be entering, but the direction cannot be determined from OI alone. Funding rates and long-short data help clarify whether positioning is becoming more bearish or simply more active.
Investors should also distinguish between OI measured in dollars and OI measured in XRP or contracts. A lower dollar value can partly reflect a lower XRP price, even if the number of open contracts changes less. For that reason, a sustained decline in both contract counts and dollar value is stronger evidence of position reduction than a dollar figure alone.
The main takeaway is that lower trading volume and open interest point to weaker market participation and less outstanding derivatives exposure. They do not independently predict whether XRP will rise or fall next.
What Could Signal a Recovery in XRP Activity?
A convincing recovery would involve sustained improvement across spot markets, derivatives, and the XRP Ledger, rather than a one-day jump in a single metric.
A Recovery in Spot Trading Volume
A sustained increase in spot volume across several major exchanges would suggest that more buyers and sellers are returning. The signal is stronger if volume rises alongside a stable or improving XRP price. A brief spike without follow-through may reflect short-term speculation rather than a durable change in demand.
Stabilizing Open Interest and Reduced Liquidations
Stabilizing OI can indicate that traders are no longer rapidly closing positions. A gradual increase, accompanied by moderate funding rates and fewer large liquidation events, may point to healthier participation. A sudden surge in OI with extreme positive or negative funding, however, can signal crowded leverage rather than a sustainable recovery.
Stronger XRP Ledger Network Usage
Investors can also monitor active addresses, transaction counts, payment activity, and decentralized exchange volume. Consistent growth across several of these measures would provide evidence that network use is strengthening beyond short-term exchange speculation.
A rise in ledger activity does not automatically translate into higher XRP demand or a higher token price. The most useful signal is a broad improvement in network usage and market participation at the same time.
XRP activity decline reflects weaker participation in parts of the trading market, particularly derivatives activity. However, it does not automatically mean XRP Ledger usage is falling or that prices must continue lower. Comparing volume, open interest, and on-chain metrics gives a more balanced view of market conditions.


