Markets
News
Analysis
User
24/7
Economic Calendar
Education
Data
- Names
- Latest
- Prev


Signal Accounts for Members
All Signal Accounts
All Contests


U.K. Trade Balance Non-EU (SA) (Oct)A:--
F: --
P: --
U.K. Trade Balance (Oct)A:--
F: --
P: --
U.K. Services Index MoMA:--
F: --
P: --
U.K. Construction Output MoM (SA) (Oct)A:--
F: --
P: --
U.K. Industrial Output YoY (Oct)A:--
F: --
P: --
U.K. Trade Balance (SA) (Oct)A:--
F: --
P: --
U.K. Trade Balance EU (SA) (Oct)A:--
F: --
P: --
U.K. Manufacturing Output YoY (Oct)A:--
F: --
P: --
U.K. GDP MoM (Oct)A:--
F: --
P: --
U.K. GDP YoY (SA) (Oct)A:--
F: --
P: --
U.K. Industrial Output MoM (Oct)A:--
F: --
P: --
U.K. Construction Output YoY (Oct)A:--
F: --
P: --
France HICP Final MoM (Nov)A:--
F: --
P: --
China, Mainland Outstanding Loans Growth YoY (Nov)A:--
F: --
P: --
China, Mainland M2 Money Supply YoY (Nov)A:--
F: --
P: --
China, Mainland M0 Money Supply YoY (Nov)A:--
F: --
P: --
China, Mainland M1 Money Supply YoY (Nov)A:--
F: --
P: --
India CPI YoY (Nov)A:--
F: --
P: --
India Deposit Gowth YoYA:--
F: --
P: --
Brazil Services Growth YoY (Oct)A:--
F: --
P: --
Mexico Industrial Output YoY (Oct)A:--
F: --
P: --
Russia Trade Balance (Oct)A:--
F: --
P: --
Philadelphia Fed President Henry Paulson delivers a speech
Canada Building Permits MoM (SA) (Oct)A:--
F: --
P: --
Canada Wholesale Sales YoY (Oct)A:--
F: --
P: --
Canada Wholesale Inventory MoM (Oct)A:--
F: --
P: --
Canada Wholesale Inventory YoY (Oct)A:--
F: --
P: --
Canada Wholesale Sales MoM (SA) (Oct)A:--
F: --
P: --
Germany Current Account (Not SA) (Oct)A:--
F: --
P: --
U.S. Weekly Total Rig CountA:--
F: --
P: --
U.S. Weekly Total Oil Rig CountA:--
F: --
P: --
Japan Tankan Large Non-Manufacturing Diffusion Index (Q4)--
F: --
P: --
Japan Tankan Small Manufacturing Outlook Index (Q4)--
F: --
P: --
Japan Tankan Large Non-Manufacturing Outlook Index (Q4)--
F: --
P: --
Japan Tankan Large Manufacturing Outlook Index (Q4)--
F: --
P: --
Japan Tankan Small Manufacturing Diffusion Index (Q4)--
F: --
P: --
Japan Tankan Large Manufacturing Diffusion Index (Q4)--
F: --
P: --
Japan Tankan Large-Enterprise Capital Expenditure YoY (Q4)--
F: --
P: --
U.K. Rightmove House Price Index YoY (Dec)--
F: --
P: --
China, Mainland Industrial Output YoY (YTD) (Nov)--
F: --
P: --
China, Mainland Urban Area Unemployment Rate (Nov)--
F: --
P: --
Saudi Arabia CPI YoY (Nov)--
F: --
P: --
Euro Zone Industrial Output YoY (Oct)--
F: --
P: --
Euro Zone Industrial Output MoM (Oct)--
F: --
P: --
Canada Existing Home Sales MoM (Nov)--
F: --
P: --
Euro Zone Total Reserve Assets (Nov)--
F: --
P: --
U.K. Inflation Rate Expectations--
F: --
P: --
Canada National Economic Confidence Index--
F: --
P: --
Canada New Housing Starts (Nov)--
F: --
P: --
U.S. NY Fed Manufacturing Employment Index (Dec)--
F: --
P: --
U.S. NY Fed Manufacturing Index (Dec)--
F: --
P: --
Canada Core CPI YoY (Nov)--
F: --
P: --
Canada Manufacturing Unfilled Orders MoM (Oct)--
F: --
P: --
Canada Manufacturing New Orders MoM (Oct)--
F: --
P: --
Canada Core CPI MoM (Nov)--
F: --
P: --
Canada Manufacturing Inventory MoM (Oct)--
F: --
P: --
Canada CPI YoY (Nov)--
F: --
P: --
Canada CPI MoM (Nov)--
F: --
P: --
Canada CPI YoY (SA) (Nov)--
F: --
P: --
Canada Core CPI MoM (SA) (Nov)--
F: --
P: --


No matching data
Latest Views
Latest Views
Trending Topics
Top Columnists
Latest Update
White Label
Data API
Web Plug-ins
Affiliate Program
View All

No data
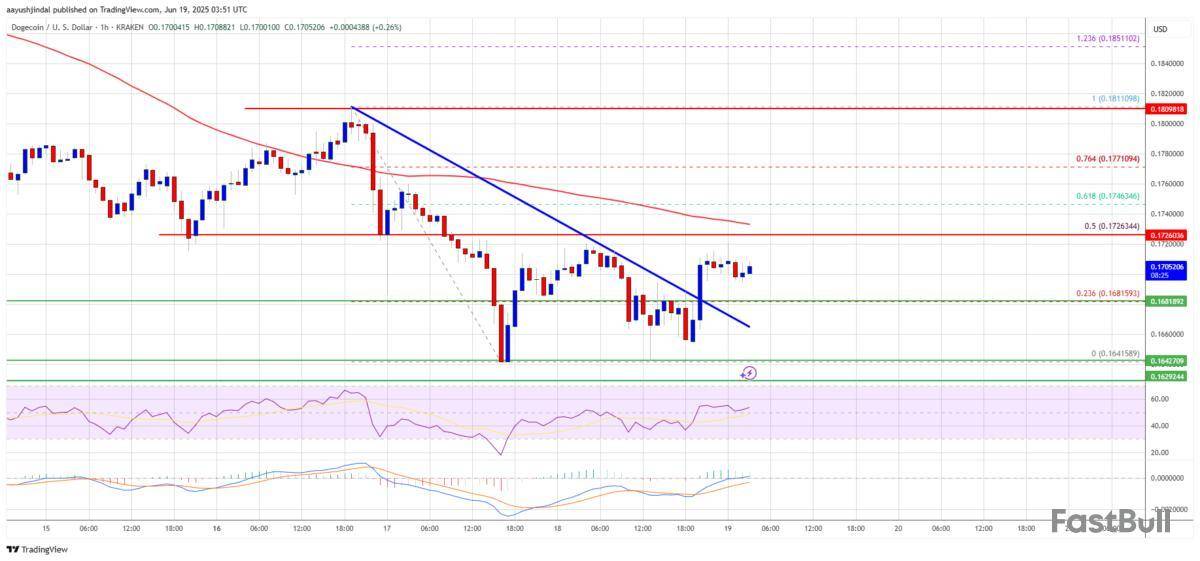
The XLM price is currently trading at $0.249, reflecting a 7% decline in intraday trading. This downturn witnessed is compounded in XLM crypto by a bearish crossover that has been in place since early June.
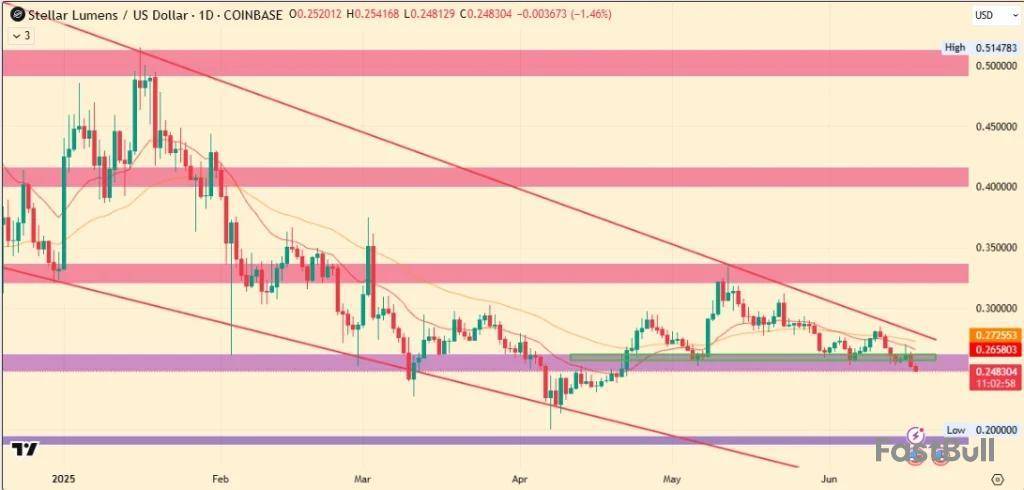
Since mid-May, XLM price has dropped over 25%, despite its price hovering near the upper boundary of a falling wedge pattern.
Recently, it lost its crucial support level at $0.26, and bearish momentum has intensified, as ongoing geopolitical tension has left many investors on the sidelines.
Therefore, the ultra-fast network, known for settling transactions in just 3-5 seconds and its native token's price, both now faces uncertainty. Now the question remains, will XLM price breakout?. To find answers, keep reading to know more.
Why On-chain Metrics Are Turning Green?
Recent social content indicate a shift in sentiment from XLM. As negative messages have been largely overshadowed by positive ones this week, reflecting a bullish bias in the overall emotional tone of people.
This trend is reflected in data fetched on Santiment, which shows that the total weighted sentiment for XLM has risen from -0.775 to +0.192 this week. Especially, on June 17th, positive sentiment reached 11.31, significantly outpacing the negative sentiment of 0.81. This is signaling a notable increase in positive conversations.
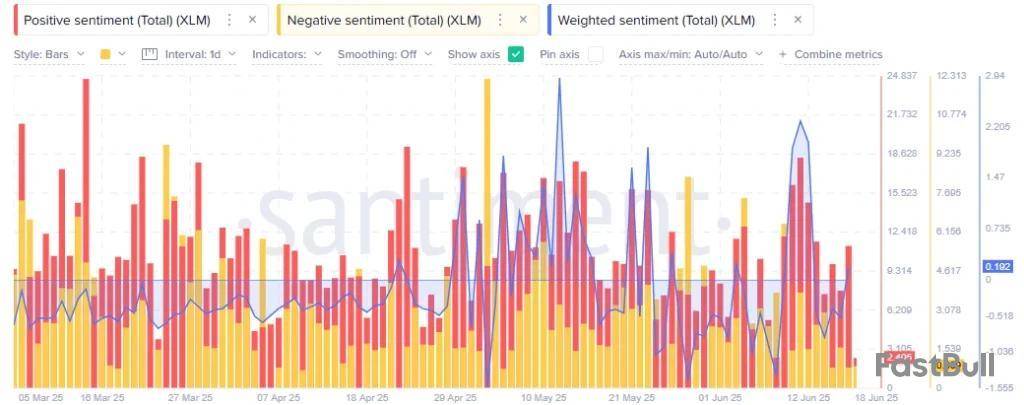
In addition to this, the derivatives market for Stellar has seen a notable increase in Open Interest weighted funding rates, indicating a recovery over the past week.
Funding rates, which were around -0.378% on May 13th, have now climbed to +0.0029%.The trend has shifted due to positive developments, such as efforts to integrate PayPal’s PYUSD stablecoin into Steller's network to support small and medium businesses with affordable cross-border payments facilities, and a hint of an upcoming collaboration with EasyA. However, these factors have not translated into significant gains for the XLM price.
As a reason why, the growth in metrics doesn't align much with the bearish price action on XLM; however, the traders' bias is clearly shifting towards upside direction slowly, and it is in clear need of a catalyst to boost price.
Overall, the development suggests that investors in the derivatives market are bullish on price recovery.
In What Case Could XLM Price Turn Bullish?
The XLM liquidation heatmap indicates that the price is currently positioned near the bottom side of liquidity. A further breach southwards could trigger a long squeeze, that can potentially drive XLM price to significant lows.
However, there are signs that geopolitical tensions may be on a path to ease soon, particularly with Trump's ultimatum to Iran.
If Iran complies and surrenders, markets that have been under pressure for so long could experience a reversal with a peaceful breath, especially concerning the Israel-Iran conflict.
Similarly, the outcome of today’s FOMC meeting could be crucial in determining the direction for both top coins and altcoins.
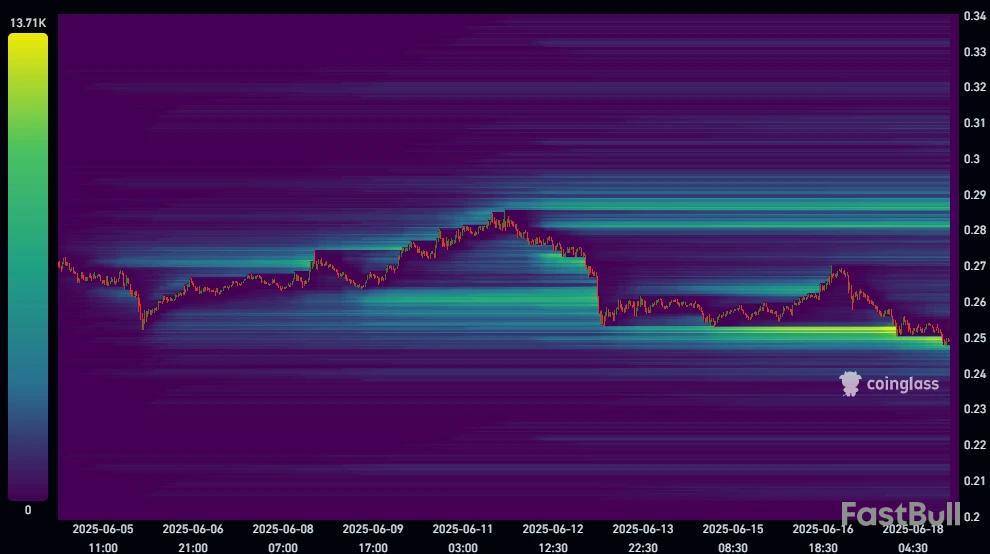
If the situation leans towards the optimistic side, XLM may find support and begin to rise from the liquidity cluster around $0.25. This potential shift could provide the momentum needed for a price recovery.
Dogecoin started a fresh decline from the $0.1820 zone against the US Dollar. DOGE is now consolidating losses and might recover if it clears $0.1750.
Dogecoin Price Faces Resistance
Dogecoin price started a fresh decline after it failed to clear the $0.1820 zone, underperforming Bitcoin and Ethereum. DOGE declined below the $0.1800 and $0.1780 levels.
The bears even pushed the price below the $0.170 level. A low was formed at $0.1641 and the price is now attempting to recover. There was a minor move above the 23.6% Fib retracement level of the downward move from the $0.1811 swing high to the $0.1641 low.
Besides, there was a break above a bearish trend line forming with resistance at $0.1680 on the hourly chart of the DOGE/USD pair. Dogecoin price is now trading below the $0.1780 level and the 100-hourly simple moving average.
Immediate resistance on the upside is near the $0.1725 level. It is close to the 50% Fib retracement level of the downward move from the $0.1811 swing high to the $0.1641 low. The first major resistance for the bulls could be near the $0.1750 level.
The next major resistance is near the $0.1820 level. A close above the $0.1820 resistance might send the price toward the $0.1880 resistance. Any more gains might send the price toward the $0.200 level. The next major stop for the bulls might be $0.2120.
Another Decline In DOGE?
If DOGE’s price fails to climb above the $0.1750 level, it could start another decline. Initial support on the downside is near the $0.1680 level. The next major support is near the $0.1640 level.
The main support sits at $0.1620. If there is a downside break below the $0.1620 support, the price could decline further. In the stated case, the price might decline toward the $0.150 level or even $0.1440 in the near term.
Technical Indicators
Hourly MACD – The MACD for DOGE/USD is now losing momentum in the bearish zone.
Hourly RSI (Relative Strength Index) – The RSI for DOGE/USD is now above the 50 level.
Major Support Levels – $0.1640 and $0.1620.
Major Resistance Levels – $0.1750 and $0.1800.
Synthetix Network is shutting down its support on the Base chain. Users should close trades and move tokens soon. This kind of event may cause fast actions in the market, like selling SNX or moving funds out. If people see this as a weakness, price could drop. But if SNX is strong on other chains, the impact might be light. Sometimes changes like this bring lots of worry, so price may be more volatile in the days near the event. More info found here: source.
SNXweave ️@snx_weaveJun 18, 2025Synthetix Weekly Recap! @synthetix_io
Arbitrum deprecated
️ Base shuts down July 7: close trades & withdraw
️ Optimism still live (for now): prep to bridge sUSD
MAINNET: early vaults & perps coming soon
Podcast: https://t.co/rfM3P5Jpc8
When an exchange like BitMart makes a new announcement, it can bring strong attention to its token, BMX. Depending on what BitMart shares, such as new products or partnerships, buyers may become excited and push the price up. But if the news is small or not important, the price may not change much. People will watch closely to see if the update is big or just routine. Announcement events are often short-term price movers, but long-term effect depends on real value added. Learn more here: source.
BitMart@BitMartExchangeJun 19, 2025Get ready…
Not one, but two game-changers are on the way.
⁰Where #AI powers #Web3 — and transforms how you trade.
Your new crypto edge is almost here.
Don’t miss it: June 24 & June 30#BitMart #XInsight #Beacon #BitMartGPT pic.twitter.com/4FqXFZqG6r
White Label
Data API
Web Plug-ins
Poster Maker
Affiliate Program
The risk of loss in trading financial instruments such as stocks, FX, commodities, futures, bonds, ETFs and crypto can be substantial. You may sustain a total loss of the funds that you deposit with your broker. Therefore, you should carefully consider whether such trading is suitable for you in light of your circumstances and financial resources.
No decision to invest should be made without thoroughly conducting due diligence by yourself or consulting with your financial advisors. Our web content might not suit you since we don't know your financial conditions and investment needs. Our financial information might have latency or contain inaccuracy, so you should be fully responsible for any of your trading and investment decisions. The company will not be responsible for your capital loss.
Without getting permission from the website, you are not allowed to copy the website's graphics, texts, or trademarks. Intellectual property rights in the content or data incorporated into this website belong to its providers and exchange merchants.
Not Logged In
Log in to access more features

FastBull Membership
Not yet
Purchase
Log In
Sign Up