• Trade
  • Markets
  • Copy
  • Contests
  • News
  • 24/7
  • Calendar
  • Q&A
  • Chats
Trending
Screeners
SYMBOL
LAST
BID
ASK
HIGH
LOW
NET CHG.
%CHG.
SPREAD
SPX
S&P 500 Index
6846.50
6846.50
6846.50
6878.28
6827.18
-23.90
-0.35%
--
DJI
Dow Jones Industrial Average
47739.31
47739.31
47739.31
47971.51
47611.93
-215.67
-0.45%
--
IXIC
NASDAQ Composite Index
23545.89
23545.89
23545.89
23698.93
23455.05
-32.22
-0.14%
--
USDX
US Dollar Index
99.000
99.080
99.000
99.000
99.000
+0.050
+ 0.05%
--
EURUSD
Euro / US Dollar
1.16339
1.16394
1.16339
1.16365
1.16322
-0.00025
-0.02%
--
GBPUSD
Pound Sterling / US Dollar
1.33176
1.33275
1.33176
1.33213
1.33140
-0.00029
-0.02%
--
XAUUSD
Gold / US Dollar
4189.70
4190.14
4189.70
4218.85
4175.92
-8.21
-0.20%
--
WTI
Light Sweet Crude Oil
58.555
58.807
58.555
60.084
58.495
-1.254
-2.10%
--

Community Accounts

Signal Accounts
--
Profit Accounts
--
Loss Accounts
--
View More

Become a signal provider

Sell trading signals to earn additional income

View More

Guide to Copy Trading

Get started with ease and confidence

View More

Signal Accounts for Members

All Signal Accounts

Best Return
  • Best Return
  • Best P/L
  • Best MDD
Past 1W
  • Past 1W
  • Past 1M
  • Past 1Y

All Contests

  • All
  • Trump Updates
  • Recommend
  • Stocks
  • Cryptocurrencies
  • Central Banks
  • Featured News
Top News Only
Share

Senior USA Administration Official: We Continue To Monitor Drc-Rwanda Situation Closely, Continue To Work With All Sides To Ensure Commitments Are Honored

Share

Israeli Military Says It Has Struck Infrastructure Belonging To Hezbollah In Several Areas In Southern Lebanon

Share

SPDR Gold Holdings Down 0.11%, Or 1.14 Tonnes

Share

On Monday (December 8), In Late New York Trading, S&P 500 Futures Fell 0.21%, Dow Jones Futures Fell 0.43%, NASDAQ 100 Futures Fell 0.08%, And Russell 2000 Futures Fell 0.04%

Share

Morgan Stanley: Data Center ABS Spreads Are Expected To Widen In 2026

Share

(US Stocks) The Philadelphia Gold And Silver Index Closed Down 2.34% At 311.01 Points. (Global Session) The NYSE Arca Gold Miners Index Closed Down 2.17%, Hitting A Daily Low Of 2235.45 Points; US Stocks Remained Slightly Down Before The Opening Bell—holding Steady Around 2280 Points—before Briefly Rising Slightly

Share

IMF: IMF Executive Board Approves Extension Of The Extended Credit Facility Arrangement With Nepal

Share

Trump: Same Approach Will Apply To Amd, Intel, And Other Great American Companies

Share

Trump: Department Of Commerce Is Finalizing Details

Share

Trump: $25% Will Be Paid To United States Of America

Share

Trump: President Xi Responded Positively

Share

[Consumer Discretionary ETFs Fell Over 1.4%, Leading The Decline Among US Sector ETFs; Semiconductor ETFs Rose Over 1.1%] On Monday (December 8), The Consumer Discretionary ETF Fell 1.45%, The Energy ETF Fell 1.09%, The Internet ETF Fell 0.18%, The Regional Banks ETF Rose 0.34%, The Technology ETF Rose 0.70%, The Global Technology ETF Rose 0.93%, And The Semiconductor ETF Rose 1.13%

Share

Trump: I Have Informed President Xi, Of China, That United States Will Allow Nvidia To Ship Its H200 Products To Approved Customers In China

Share

Argentina's Merval Index Closed Up 0.02% At 3.047 Million Points. It Rose To A New Daily High Of 3.165 Million Points In Early Trading In Buenos Aires Before Gradually Giving Back Its Gains

Share

US Stock Market Closing Report | On Monday (December 8), The Magnificent 7 Index Fell 0.20% To 208.33 Points. The "mega-cap" Tech Stock Index Fell 0.33% To 405.00 Points

Share

Pentagon - USA State Dept Approves Potential Sale Of Hellfire Missiles To Belgium For An Estimated $79 Million

Share

Toronto Stock Index .GSPTSE Unofficially Closes Down 141.44 Points, Or 0.45 Percent, At 31169.97

Share

The Nasdaq Golden Dragon China Index Closed Up Less Than 0.1%. Nxtt Rose 21%, Microalgo Rose 7%, Daqo New Energy Rose 4.3%, And 21Vianet, Baidu, And Miniso All Rose More Than 3%

Share

The S&P 500 Initially Closed Down More Than 0.4%, With The Telecom Sector Down 1.9%, And Materials, Consumer Discretionary, Utilities, Healthcare, And Energy Sectors Down By As Much As 1.6%, While The Technology Sector Rose 0.7%. The NASDAQ 100 Initially Closed Down 0.3%, With Marvell Technology Down 7%, Fortinet Down 4%, And Netflix And Tesla Down 3.4%

Share

IMF: Review Pakistan Authorities To Draw The Equivalent Of About US$1 Billion

TIME
ACT
FCST
PREV
France Trade Balance (SA) (Oct)

A:--

F: --

P: --
Euro Zone Employment YoY (SA) (Q3)

A:--

F: --

P: --
Canada Part-Time Employment (SA) (Nov)

A:--

F: --

P: --

Canada Unemployment Rate (SA) (Nov)

A:--

F: --

P: --

Canada Full-time Employment (SA) (Nov)

A:--

F: --

P: --

Canada Labor Force Participation Rate (SA) (Nov)

A:--

F: --

P: --

Canada Employment (SA) (Nov)

A:--

F: --

P: --

U.S. PCE Price Index MoM (Sept)

A:--

F: --

P: --

U.S. Personal Income MoM (Sept)

A:--

F: --

P: --

U.S. Core PCE Price Index MoM (Sept)

A:--

F: --

P: --

U.S. PCE Price Index YoY (SA) (Sept)

A:--

F: --

P: --

U.S. Core PCE Price Index YoY (Sept)

A:--

F: --

P: --

U.S. Personal Outlays MoM (SA) (Sept)

A:--

F: --

P: --
U.S. 5-10 Year-Ahead Inflation Expectations (Dec)

A:--

F: --

P: --

U.S. Real Personal Consumption Expenditures MoM (Sept)

A:--

F: --

P: --
U.S. Weekly Total Rig Count

A:--

F: --

P: --

U.S. Weekly Total Oil Rig Count

A:--

F: --

P: --

U.S. Consumer Credit (SA) (Oct)

A:--

F: --

P: --
China, Mainland Foreign Exchange Reserves (Nov)

A:--

F: --

P: --

Japan Trade Balance (Oct)

A:--

F: --

P: --

Japan Nominal GDP Revised QoQ (Q3)

A:--

F: --

P: --

China, Mainland Imports YoY (CNH) (Nov)

A:--

F: --

P: --

China, Mainland Exports (Nov)

A:--

F: --

P: --

China, Mainland Imports (CNH) (Nov)

A:--

F: --

P: --

China, Mainland Trade Balance (CNH) (Nov)

A:--

F: --

P: --

China, Mainland Exports YoY (USD) (Nov)

A:--

F: --

P: --

China, Mainland Imports YoY (USD) (Nov)

A:--

F: --

P: --

Germany Industrial Output MoM (SA) (Oct)

A:--

F: --

P: --
Euro Zone Sentix Investor Confidence Index (Dec)

A:--

F: --

P: --

Canada National Economic Confidence Index

A:--

F: --

P: --

U.K. BRC Like-For-Like Retail Sales YoY (Nov)

--

F: --

P: --

U.K. BRC Overall Retail Sales YoY (Nov)

--

F: --

P: --

Australia Overnight (Borrowing) Key Rate

--

F: --

P: --

RBA Rate Statement
RBA Press Conference
Germany Exports MoM (SA) (Oct)

--

F: --

P: --

U.S. NFIB Small Business Optimism Index (SA) (Nov)

--

F: --

P: --

Mexico 12-Month Inflation (CPI) (Nov)

--

F: --

P: --

Mexico Core CPI YoY (Nov)

--

F: --

P: --

Mexico PPI YoY (Nov)

--

F: --

P: --

U.S. Weekly Redbook Index YoY

--

F: --

P: --

U.S. JOLTS Job Openings (SA) (Oct)

--

F: --

P: --

China, Mainland M1 Money Supply YoY (Nov)

--

F: --

P: --

China, Mainland M0 Money Supply YoY (Nov)

--

F: --

P: --

China, Mainland M2 Money Supply YoY (Nov)

--

F: --

P: --

U.S. EIA Short-Term Crude Production Forecast For The Year (Dec)

--

F: --

P: --

U.S. EIA Natural Gas Production Forecast For The Next Year (Dec)

--

F: --

P: --

U.S. EIA Short-Term Crude Production Forecast For The Next Year (Dec)

--

F: --

P: --

EIA Monthly Short-Term Energy Outlook
U.S. API Weekly Gasoline Stocks

--

F: --

P: --

U.S. API Weekly Cushing Crude Oil Stocks

--

F: --

P: --

U.S. API Weekly Crude Oil Stocks

--

F: --

P: --

U.S. API Weekly Refined Oil Stocks

--

F: --

P: --

South Korea Unemployment Rate (SA) (Nov)

--

F: --

P: --

Japan Reuters Tankan Non-Manufacturers Index (Dec)

--

F: --

P: --

Japan Reuters Tankan Manufacturers Index (Dec)

--

F: --

P: --

Japan Domestic Enterprise Commodity Price Index MoM (Nov)

--

F: --

P: --

Japan Domestic Enterprise Commodity Price Index YoY (Nov)

--

F: --

P: --

China, Mainland PPI YoY (Nov)

--

F: --

P: --

China, Mainland CPI MoM (Nov)

--

F: --

P: --

Italy Industrial Output YoY (SA) (Oct)

--

F: --

P: --

Q&A with Experts
    • All
    • Chatrooms
    • Groups
    • Friends
    Connecting
    .
    .
    .
    Type here...
    Add Symbol or Code

      No matching data

      All
      Trump Updates
      Recommend
      Stocks
      Cryptocurrencies
      Central Banks
      Featured News
      • All
      • Russia-Ukraine Conflict
      • Middle East Flashpoint
      • All
      • Russia-Ukraine Conflict
      • Middle East Flashpoint
      Search
      Products

      Charts Free Forever

      Chats Q&A with Experts
      Screeners Economic Calendar Data Tools
      Membership Features
      Data Warehouse Market Trends Institutional Data Policy Rates Macro

      Market Trends

      Market Sentiment Order Book Forex Correlations

      Top Indicators

      Charts Free Forever
      Markets

      News

      News Analysis 24/7 Columns Education
      From Institutions From Analysts
      Topics Columnists

      Latest Views

      Latest Views

      Trending Topics

      Top Columnists

      Latest Update

      Signals

      Copy Rankings Latest Signals Become a signal provider AI Rating
      Contests
      Brokers

      Overview Brokers Assessment Rankings Regulators News Claims
      Broker listing Forex Brokers Comparison Tool Live Spread Comparison Scam
      Q&A Complaint Scam Alert Videos Tips to Detect Scam
      More

      Business
      Events
      Careers About Us Advertising Help Center

      White Label

      Data API

      Web Plug-ins

      Affiliate Program

      Awards Institution Evaluation IB Seminar Salon Event Exhibition
      Vietnam Thailand Singapore Dubai
      Fans Party Investment Sharing Session
      FastBull Summit BrokersView Expo
      Recent Searches
        Top Searches
          Markets
          News
          Analysis
          User
          24/7
          Economic Calendar
          Education
          Data
          • Names
          • Latest
          • Prev

          View All

          No data

          Scan to Download

          Faster Charts, Chat Faster!

          Download App
          English
          • English
          • Español
          • العربية
          • Bahasa Indonesia
          • Bahasa Melayu
          • Tiếng Việt
          • ภาษาไทย
          • Français
          • Italiano
          • Türkçe
          • Русский язык
          • 简中
          • 繁中
          Open Account
          Search
          Products
          Charts Free Forever
          Markets
          News
          Signals

          Copy Rankings Latest Signals Become a signal provider AI Rating
          Contests
          Brokers

          Overview Brokers Assessment Rankings Regulators News Claims
          Broker listing Forex Brokers Comparison Tool Live Spread Comparison Scam
          Q&A Complaint Scam Alert Videos Tips to Detect Scam
          More

          Business
          Events
          Careers About Us Advertising Help Center

          White Label

          Data API

          Web Plug-ins

          Affiliate Program

          Awards Institution Evaluation IB Seminar Salon Event Exhibition
          Vietnam Thailand Singapore Dubai
          Fans Party Investment Sharing Session
          FastBull Summit BrokersView Expo

          XLM, HBAR Extend Massive Gains as BTC Stands Still Despite Trump’s New Tariffs: Weekend Watch

          CryptoPotato
          1inch / Tether
          -0.45%
          Vaulta / Tether
          +0.06%
          AAVE / Tether
          -0.21%
          Acala / Tether
          -2.69%
          Fusionist / Tether
          +0.33%

          Bitcoin’s muted price actions during the weekend continued in the past 24 hours as the asset calmed following the explosive rally observed from Wednesday to Friday.

          In the meantime, many altcoins have extended their gains, with XLM, HBAR, and BONK emerging as today’s top performers.BTC Stalls at $118K

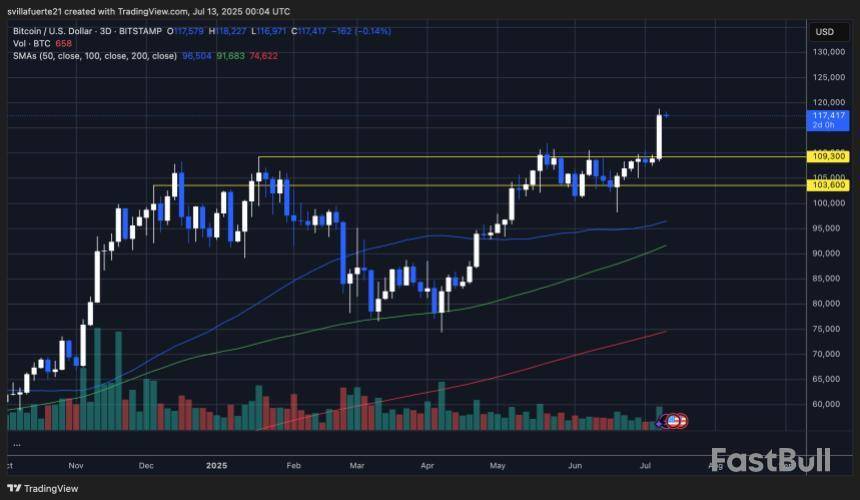
          Recall that bitcoin’s price volatility had largely disappeared since the start of the month, as the asset was confined within a relatively tight range between $105,000 and $110,000. Following a few unsuccessful attempts for a breakout, though, came Wednesday evening when the bulls took full control of the market.

          During the first wave north, they pushed the cryptocurrency beyond $110,000 and all the way up to $112,000, which set a new all-time high. While bitcoin retraced slightly on the next day, its rally couldn’t be contained yet, and it shot up to$116,000on Thursday.

          Friday saw another impressive leg up that drove the primary digital asset otalmost $119,000, which became its latest all-time high. This meant that BTC had added over ten grand in less than 48 hours to set a new record. You can check some of the possible reasons behind this mindblowing surgehere.

          Saturday saw little to no action, even though Trump slapped the EU and Mexico with 30% tariffs and warned there would be more if they responded.

          BTC slipped slightly to $117,500 but has managed to recover the losses and is back to $118,000 as of press time now. Its market cap remains close to $2.350 trillion, making bitcoin the sixth-largest global asset.These Alts Keep Rocking

          Most altcoins have stalled similar to BTC over the past day or so, but XLM and HBAR stand in a league of their own. The former has added another 17.5% in the past day, extending its weekly gains to over 85%.

          HBAR has surged by nearly 15% daily and almost 50% weekly, which has pushed its price well beyond $0.22. BONK completes the double-digit price pump club, with a 12% surge of its own.

          Other big gainers from the larger-cap alts include ALGO, IMX, and MNT, but their increases are noticeably smaller.

          The cumulative market cap of all crypto assets has gained around $20 billion overnight and is up to $3.760 trillion on CG.

          Risk Warnings and Disclaimers
          You understand and acknowledge that there is a high degree of risk involved in trading. Following any strategies or investment methods may lead to potential losses. The content on the site is provided by our contributors and analysts for information purposes only. You are solely responsible for determining whether any trading assets, securities, strategy, or any other product is suitable for investing based on your own investment objectives and financial situation.
          Add to Favorites
          Share

          Czech central bank adds Coinbase to portfolio, boosts Palantir holdings

          Cointelegraph
          1inch / Tether
          -0.45%
          Vaulta / Tether
          +0.06%
          AAVE / Tether
          -0.21%
          Acala / Tether
          -2.69%
          Fusionist / Tether
          +0.33%
          Risk Warnings and Disclaimers
          You understand and acknowledge that there is a high degree of risk involved in trading. Following any strategies or investment methods may lead to potential losses. The content on the site is provided by our contributors and analysts for information purposes only. You are solely responsible for determining whether any trading assets, securities, strategy, or any other product is suitable for investing based on your own investment objectives and financial situation.
          Add to Favorites
          Share

          6 Reasons Behind Bitcoin’s Surge to Uncharted Territory: Can They Push BTC Even Higher?

          CryptoPotato
          1inch / Tether
          -0.45%
          Vaulta / Tether
          +0.06%
          AAVE / Tether
          -0.21%
          Acala / Tether
          -2.69%
          Fusionist / Tether
          +0.33%

          Bitcoin’s price revival at the end of the business week caught many short traders off guard as the asset skyrocketed to a new all-time high of almost $119,000 following an extended period of muted movements.

          Although there was not one single big announcement that could have been related to the explosive rally, there are several reasons that were building up for weeks, which could be attributed to the new peak.Overall Accumulation

          The following reasons will be combined into one category of “overall accumulation,” even though they may vary by investor type, different moments of purchases, etc. We will start with the ETFs as they’re the freshest. Asreportedyesterday, the spot Bitcoin ETFs in the US attracted more than $2.7 billion within the past five trading days alone.

          In addition, they have seen only one day in net outflows since June 9. Both of these factors can drive the underlying asset’s price north, especially when investors spend more than $2 billion to accumulate ETF shares in two consecutive days (July 10 and 11).

          Next, we will list the accumulation by large companies. Strategy, which admittedlyfailed to announcea purchase last week, has spent billions in the past few months to acquire more BTC. Its example has been followed to a smaller extent by other companies that now hold bitcoin as a reserve asset, such asMetaplanet, GameStop, and Semler Scientific.

          Although these purchases might not impact the asset’s price immediately, their continuous efforts certainly play a role as they reduce the immediate selling pressure.

          The accumulation trend expands well beyond institutions and large companies. Glassnode reported recently that smaller investors, categorized as shrimps, crabs, and fish (wallets holding less than 100 BTC), have been acquiring more than 19,000 BTC per month. In comparison, miner issuance stands at just 13,400 BTC per month.

          Looking at accumulation by wallet size: Shrimps, Crabs, and Fish – wallets with <100 $BTC – are accumulating ~19.3k BTC/month, while miner issuance stands at 13.4k BTC/month. Persistent net absorption across a wide base of holders is creating measurable supply-side tightening. pic.twitter.com/ajut5hlpqv

          — glassnode (@glassnode) July 12, 2025

          The aforementioned purchases from various types of investors, most of whom are transferring their BTC holdings out of exchanges, lead us to the next reason (yes, they are related). According to CryptoQuant, the amount of BTC stored on trading platforms has declined to the lowest level in a decade, another signal that investors are looking for the long term.Macroeconomic Reasons

          The reasons above paint a clear picture that investors are accumulating. Now, let’s get down to why they might be doing so.

          Although Trump bombarded numerous nations and entire Unions with new sets of tariffs in the past few weeks, including on Saturday, the effect is nowhere near as devastating to BTC as it was back in April. At the time, bitcoin’s price collapsed to a five-month low, while now, the tariffs are somehow considered beneficial for the cryptocurrency.

          As analysts from QCP put it:

          “Will Trump delay implementation once again? That remains to be seen. But repeated cycles of tariff threats and postponements have contributed to positive uncertainty. Business sentiment and manufacturing indices have remained firmly in expansion territory.”

          BREAKING: President Trump sends out more “tariff letters” with the following tariff rates now announced:

          1. Brazil: 50% 2. Myanmar: 40% 3. Laos: 40% 4. Cambodia: 36% 5. Thailand: 36% 6. Bangladesh: 35% 7. Canada: 35% 8. Serbia: 35% 9. Indonesia: 32% 10. European Union: 30% 11.…

          — The Kobeissi Letter (@KobeissiLetter) July 12, 2025

          In the meantime, we will conclude our reasoning with the declining US dollar index. Experts have long predicted a massive parabolic move for BTC once the greenback loses traction. This is because investors tend to jump into store-of-value assets, such as gold and bitcoin, in times when the dollar is weak.

          Nicolai Sondergaard, Research Analyst at Nansen, told CryptoPotato that although he didn’t believe this rally was mostly driven by macro events, he thinks certain US policies have attributed to it.

          “Recent U.S. policy developments such as fiscal expansion and expectations of further monetary easing have created a backdrop that is undeniably favorable for Bitcoin.”Will BTC Keep Surging?

          The big question now is whether these reasons will continue to push the cryptocurrency higher. In a memo to CryptoPotato, analysts from Bitfinex seemed optimistic.

          “Unless ETF inflows collapse or macro takes a sharp turn, the structure remains intact. Bitcoin has flipped $111k–$114k into support, and as long as that holds, the trend is higher. For traders, the message is simple: respect the flows, watch for funding dislocations, and stay tactical around round-number resistance levels for Bitcoin.”

          Nevertheless, they warned that “no rally goes up in a straight line.” The analysts added that BTC could be due for a correction first, as they have already started to “see some signs of temporary exhaustion.”

          Nansen’s Sondergaard also weighed in on whether bitcoin has the strength to keep marching forward:

          “Bitcoin recently broke through key liquidation levels and managed to hold above them, which I believe signaled there was more room for upside.

          On the technical side, Bitcoin’s daily RSI has climbed above 70, which is typical in strong momentum phases. It’s not inherently bearish; RSI rising during price rallies is normal. However, if price continues to rise while RSI starts to diverge or decline, that could be an early signal of fading momentum and the potential for a correction.”

          Risk Warnings and Disclaimers
          You understand and acknowledge that there is a high degree of risk involved in trading. Following any strategies or investment methods may lead to potential losses. The content on the site is provided by our contributors and analysts for information purposes only. You are solely responsible for determining whether any trading assets, securities, strategy, or any other product is suitable for investing based on your own investment objectives and financial situation.
          Add to Favorites
          Share

          Bitcoin Price Could Soar To $146K In The Next Leg Up — Analyst Explains How

          NewsBTC
          1inch / Tether
          -0.45%
          Vaulta / Tether
          +0.06%
          AAVE / Tether
          -0.21%
          Acala / Tether
          -2.69%
          Fusionist / Tether
          +0.33%

          After going on an impressive run to close the week, the Bitcoin price has become relatively steady over this weekend. The premier cryptocurrency has shown some signs of indecision and continued to move sideways within the $117,000 and $118,000 range.

          According to a prominent online pundit, the Bitcoin price might be at a critical juncture that could decide its future over the next few weeks. Insights from a technical analysis model suggest that the price of BTC might run up to an unprecedented high of $143,000 once it overcomes the next resistance level.

          BTC Needs To Break This Resistance Level To Continue Rally

          In a July 12 post on social media platform X, Alphractal founder & CEO Joao Wedson revealed that the Bitcoin price faces significant resistance between $118,900 and $120,000. This price evaluation is based on the Bitcoin Power Law model, which provides a mathematical description of BTC’s historical price trends.

          The Bitcoin Power Law model estimates the network effect and adoption curve without speculation. Using this framework, the pricing model provides long-term support and resistance levels or “bands” on the Bitcoin price chart.

          Wedson revealed that the Power Law model indicates that the Bitcoin price faces significant resistance between the $118,900 and $120,000 region. According to the on-chain analyst, the market needs to breach the Alpha Price — which lies somewhere around $119,300.

          Bitcoin price

          For context, the Alpha Price refers to a major inflection point in the Power Law model and a level that the Bitcoin price needs to break and stay above to enter the next significant phase of the bull cycle. In essence, the BTC price must witness a sustained break above $119,300 to continue its rally.

          Wedson mentioned that the price of BTC will need to show resilience in order to breach the psychological $120,000 level. However, it might need to consolidate first and perhaps take some long traders out of the market before overcoming the $120,000 level, the on-chain analyst noted.

          According to Wedson, a sustained breach of the $120,000 level will signal the beginning of an even much bigger rally for the market leader. The on-chain analyst put the target for this rally at between $143,000 and $146,000, marking the Bitcoin price top in this cycle.

          Bitcoin Price At A Glance

          As of this writing, the price of BTC stands at around $117,530, reflecting no significant movement in the past 24 hours. Nevertheless, the flagship cryptocurrency is up by nearly 9% on the weekly timeframe.

          Risk Warnings and Disclaimers
          You understand and acknowledge that there is a high degree of risk involved in trading. Following any strategies or investment methods may lead to potential losses. The content on the site is provided by our contributors and analysts for information purposes only. You are solely responsible for determining whether any trading assets, securities, strategy, or any other product is suitable for investing based on your own investment objectives and financial situation.
          Add to Favorites
          Share

          ADA Is Breaking Out: Will Cardano Surge Past $1 Next?

          CryptoPotato
          1inch / Tether
          -0.45%
          Vaulta / Tether
          +0.06%
          AAVE / Tether
          -0.21%
          Acala / Tether
          -2.69%
          Fusionist / Tether
          +0.33%

          TL;DR

          Cardano $ADA is breaking through a key resistance level, opening the door for a rally to $0.90–$1.20! pic.twitter.com/4dj8jQfJFN

          — Ali (@ali_charts) July 13, 2025

          This important resistance that could hinder ADA’s progress is situated somewhere around $0.74, a level the asset is very familiar with, as it managed to contain its price ascent earlier this year.

          ADA managed to breach it briefly during theFriday price surgethat drove it to a two-and-a-half-month high of almost $0.78, but the bears quickly regrouped and didn’t allow a decisive closure above it.

          In fact, the last time Cardano’s token traded sustainably above $0.74 was in mid-May. Since then, the asset underwent a substantial correction that drove it down to $0.5 at one point.

          Nevertheless, ADA is still the top performer on a weekly scale from the 12 largest cryptocurrencies by market cap, having gained almost 30%. Thus, it has increased more thanXRP(26%) and HYPE (22%).

          This impressive price surge comes just a few weeks after IOGproposedthat the treasury would trade $100 million worth of ADA for BTC and stablecoins to enhance the blockchain’s DeFi ecosystem. The move met immediate resistance from some members, who claimed that it could lead to a more painful sell-off and price declines.

          Charles Hoskinson was quick to mock the naysayers after ADA surged past $0.7 and became a top performer.

          Remember when we were told that a 100 million dollar trade of ada would collapse the price? https://t.co/kYm5CKw97O pic.twitter.com/tPZiROv37i

          — Charles Hoskinson (@IOHK_Charles) July 11, 2025

          Risk Warnings and Disclaimers
          You understand and acknowledge that there is a high degree of risk involved in trading. Following any strategies or investment methods may lead to potential losses. The content on the site is provided by our contributors and analysts for information purposes only. You are solely responsible for determining whether any trading assets, securities, strategy, or any other product is suitable for investing based on your own investment objectives and financial situation.
          Add to Favorites
          Share

          Bitcoin headed for 36 more public companies by year-end: Blockware

          Cointelegraph
          1inch / Tether
          -0.45%
          Vaulta / Tether
          +0.06%
          AAVE / Tether
          -0.21%
          Acala / Tether
          -2.69%
          Fusionist / Tether
          +0.33%
          Risk Warnings and Disclaimers
          You understand and acknowledge that there is a high degree of risk involved in trading. Following any strategies or investment methods may lead to potential losses. The content on the site is provided by our contributors and analysts for information purposes only. You are solely responsible for determining whether any trading assets, securities, strategy, or any other product is suitable for investing based on your own investment objectives and financial situation.
          Add to Favorites
          Share

          Bitcoin Long-Term Holders Remain Steady As CDD Normalizes After False Alarm

          NewsBTC
          1inch / Tether
          -0.45%
          Vaulta / Tether
          +0.06%
          AAVE / Tether
          -0.21%
          Acala / Tether
          -2.69%
          Fusionist / Tether
          +0.33%

          Bitcoin is testing uncharted territory after breaking past its previous all-time high of $112,000 last Thursday, igniting a powerful new phase in the bull market. With the price currently hovering above $117,000, bulls are firmly in control as optimism spreads across the crypto market. The breakout comes after weeks of tight consolidation, signaling renewed confidence among investors and traders.

          On-chain data from CryptoQuant adds further support to the bullish narrative. The Coin Days Destroyed (CDD) metric—used to assess whether long-term holders are selling—has returned to a relatively low average despite the rise in price. This suggests that experienced holders are not offloading their positions, but instead continuing to hold through the rally.

          With long-term holders largely inactive and momentum accelerating, Bitcoin appears to be entering a decisive phase. As macroeconomic conditions remain favorable for risk assets, and with institutional demand rising, all eyes are now on how BTC behaves at these new highs—and whether the rest of the crypto market will follow its lead.

          Bitcoin Prepares For A Massive Surge

          Bitcoin continues to trade above key psychological and technical levels, signaling that the market is entering an expansion phase with the potential for a massive surge. After clearing its previous all-time high and consolidating around $117,000, Bitcoin’s structure looks increasingly bullish. Analysts and traders are closely watching on-chain indicators to confirm whether long-term holders are beginning to exit, but so far, the data suggests they are not.

          Top analyst Darkfost shared relevant insights regarding the Coin Days Destroyed (CDD) metric, a key tool used to assess long-term holder activity. CDD calculates how long a Bitcoin stays unmoved before a transfer, revealing long-term participants’ behavior. Recently, the metric saw a sharp spike, raising initial concerns about possible distribution. However, it was later confirmed that the move involved 80,000 BTC in an internal transfer — no actual selling occurred.

          Bitcoin CDD has returned to the relatively low average | Source: Darkfost on X

          Since that event, the CDD has returned to its previous low range, especially when compared to Bitcoin’s soaring price. This signals that long-term holders are still sitting tight, showing no urgency to sell into strength. Their conviction reflects growing expectations of higher prices ahead, supported by macro conditions, increasing adoption, and rising institutional interest.

          With strong hands holding firm and momentum building, Bitcoin appears poised for continuation. As long as key support levels are maintained and long-term holders remain inactive, the setup favors an explosive move that could redefine price discovery in this cycle.

          Price Discovery Kicks In: Momentum Accelerates

          Bitcoin’s three‑day chart shows a textbook breakout from eight weeks of compression. Thursday’s candle closed firmly above the former record cluster at $109,300, opening the door for a vertical push that carried price to $118,800 on the very next print. The candle body towers well above the 50‑period SMA, while the 100‑ and 200‑period averages slope higher beneath, confirming a bullish long‑term structure.

          BTC testing uncharted territory | Source: BTCUSDT chart on TradingView

          The old resistance band between $105,000 and $109,300 now flips into first demand; any orderly retest that wicks into that zone would likely attract sidelined buyers. Below it, $103,600—the mid‑range support that capped drawdowns all spring—remains the line in the sand for the current trend.

          Upside projections derive from the height of the year‑long range (~$15 k). Adding that measure to the breakout point targets $124–125 k as the next logical objective, with the psychological $120 k round number a potential interim stall area. Momentum oscillators on medium time‑frames are stretched but not at extreme levels, suggesting room for continuation before a cooling period becomes necessary.

          Featured image from Dall-E, chart from TradingView

          Risk Warnings and Disclaimers
          You understand and acknowledge that there is a high degree of risk involved in trading. Following any strategies or investment methods may lead to potential losses. The content on the site is provided by our contributors and analysts for information purposes only. You are solely responsible for determining whether any trading assets, securities, strategy, or any other product is suitable for investing based on your own investment objectives and financial situation.
          Add to Favorites
          Share
          FastBull
          Copyright © 2025 FastBull Ltd

          728 RM B 7/F GEE LOK IND BLDG NO 34 HUNG TO RD KWUN TONG KLN HONG KONG

          TelegramInstagramTwitterfacebooklinkedin
          App Store Google Play Google Play
          Products
          Charts

          Chats

          Q&A with Experts
          Screeners
          Economic Calendar
          Data
          Tools
          Membership
          Features
          Function
          Markets
          Copy Trading
          Latest Signals
          Contests
          News
          Analysis
          24/7
          Columns
          Education
          Company
          Careers
          About Us
          Contact Us
          Advertising
          Help Center
          Feedback
          User Agreement
          Privacy Policy
          Business

          White Label

          Data API

          Web Plug-ins

          Poster Maker

          Affiliate Program

          Risk Disclosure

          The risk of loss in trading financial instruments such as stocks, FX, commodities, futures, bonds, ETFs and crypto can be substantial. You may sustain a total loss of the funds that you deposit with your broker. Therefore, you should carefully consider whether such trading is suitable for you in light of your circumstances and financial resources.

          No decision to invest should be made without thoroughly conducting due diligence by yourself or consulting with your financial advisors. Our web content might not suit you since we don't know your financial conditions and investment needs. Our financial information might have latency or contain inaccuracy, so you should be fully responsible for any of your trading and investment decisions. The company will not be responsible for your capital loss.

          Without getting permission from the website, you are not allowed to copy the website's graphics, texts, or trademarks. Intellectual property rights in the content or data incorporated into this website belong to its providers and exchange merchants.

          Not Logged In

          Log in to access more features

          FastBull Membership

          Not yet

          Purchase

          Become a signal provider
          Help Center
          Customer Service
          Dark Mode
          Price Up/Down Colors

          Log In

          Sign Up

          Position
          Layout
          Fullscreen
          Default to Chart
          The chart page opens by default when you visit fastbull.com