

Markets
News
Analysis
User
24/7
Economic Calendar
Education
Data
- Names
- Latest
- Prev


Signal Accounts for Members
All Signal Accounts
All Contests
 U.K. Trade Balance (Oct)
A:--
F: --
P: --
U.K. Services Index MoMA:--
F: --
P: --
U.K. Construction Output MoM (SA) (Oct)A:--
F: --
P: --
U.K. Industrial Output YoY (Oct)A:--
F: --
P: --
U.K. Trade Balance (SA) (Oct)A:--
F: --
P: --
U.K. Trade Balance EU (SA) (Oct)A:--
F: --
P: --
U.K. Manufacturing Output YoY (Oct)A:--
F: --
P: --
U.K. GDP MoM (Oct)A:--
F: --
P: --
U.K. GDP YoY (SA) (Oct)A:--
F: --
P: --
U.K. Industrial Output MoM (Oct)A:--
F: --
P: --
U.K. Construction Output YoY (Oct)A:--
F: --
P: --
 France HICP Final MoM (Nov)
A:--
F: --
P: --
 China, Mainland Outstanding Loans Growth YoY (Nov)
A:--
F: --
P: --
China, Mainland M2 Money Supply YoY (Nov)A:--
F: --
P: --
China, Mainland M0 Money Supply YoY (Nov)A:--
F: --
P: --
China, Mainland M1 Money Supply YoY (Nov)A:--
F: --
P: --
 India CPI YoY (Nov)
A:--
F: --
P: --
India Deposit Gowth YoYA:--
F: --
P: --
 Brazil Services Growth YoY (Oct)
A:--
F: --
P: --
 Mexico Industrial Output YoY (Oct)
A:--
F: --
P: --
 Russia Trade Balance (Oct)
A:--
F: --
P: --
 Philadelphia Fed President Henry Paulson delivers a speech
 Canada Building Permits MoM (SA) (Oct)
A:--
F: --
P: --
Canada Wholesale Sales YoY (Oct)A:--
F: --
P: --
Canada Wholesale Inventory MoM (Oct)A:--
F: --
P: --
Canada Wholesale Inventory YoY (Oct)A:--
F: --
P: --
Canada Wholesale Sales MoM (SA) (Oct)A:--
F: --
P: --
 Germany Current Account (Not SA) (Oct)
A:--
F: --
P: --
U.S. Weekly Total Rig CountA:--
F: --
P: --
U.S. Weekly Total Oil Rig CountA:--
F: --
P: --
 Japan Tankan Large Non-Manufacturing Diffusion Index (Q4)
--
F: --
P: --
Japan Tankan Small Manufacturing Outlook Index (Q4)--
F: --
P: --
Japan Tankan Large Non-Manufacturing Outlook Index (Q4)--
F: --
P: --
Japan Tankan Large Manufacturing Outlook Index (Q4)--
F: --
P: --
Japan Tankan Small Manufacturing Diffusion Index (Q4)--
F: --
P: --
Japan Tankan Large Manufacturing Diffusion Index (Q4)--
F: --
P: --
Japan Tankan Large-Enterprise Capital Expenditure YoY (Q4)--
F: --
P: --
U.K. Rightmove House Price Index YoY (Dec)--
F: --
P: --
China, Mainland Industrial Output YoY (YTD) (Nov)--
F: --
P: --
China, Mainland Urban Area Unemployment Rate (Nov)--
F: --
P: --
 Saudi Arabia CPI YoY (Nov)
--
F: --
P: --
 Euro Zone Industrial Output YoY (Oct)
--
F: --
P: --
Euro Zone Industrial Output MoM (Oct)--
F: --
P: --
Canada Existing Home Sales MoM (Nov)--
F: --
P: --
Euro Zone Total Reserve Assets (Nov)--
F: --
P: --
U.K. Inflation Rate Expectations--
F: --
P: --
Canada National Economic Confidence Index--
F: --
P: --
Canada New Housing Starts (Nov)--
F: --
P: --
U.S. NY Fed Manufacturing Employment Index (Dec)--
F: --
P: --
U.S. NY Fed Manufacturing Index (Dec)--
F: --
P: --
Canada Core CPI YoY (Nov)--
F: --
P: --
Canada Manufacturing Unfilled Orders MoM (Oct)--
F: --
P: --
Canada Manufacturing New Orders MoM (Oct)--
F: --
P: --
Canada Core CPI MoM (Nov)--
F: --
P: --
Canada Manufacturing Inventory MoM (Oct)--
F: --
P: --
Canada CPI YoY (Nov)--
F: --
P: --
Canada CPI MoM (Nov)--
F: --
P: --
Canada CPI YoY (SA) (Nov)--
F: --
P: --
Canada Core CPI MoM (SA) (Nov)--
F: --
P: --
Canada CPI MoM (SA) (Nov)--
F: --
P: --

No matching data
Latest Views
Latest Views
Trending Topics
Top Columnists
Latest Update
White Label
Data API
Web Plug-ins
Affiliate Program
View All
No data


XRP surprised the market this week by setting a new record with its first U.S. spot ETF launch, but the token’s price has still declined. As of today, XRP is trading at $2.99, down from recent highs, leaving many investors puzzled.
Spot XRP ETF Breaks Day-One Record
On its first day of trading, the $XRPR ETF recorded $37.7 million in volume, edging out $IVES to claim the biggest first-day natural trading volume of any ETF launched in 2025. Dogecoin’s new ETF ($DOJE) also impressed with $17 million, placing it in the top five launches out of 710 so far this year.
Analyst Zach Rector said the first Spot XRP ETF did set a record for day-one trading volume in 2025, but XRP has since faced three straight days of outflows totaling $68.63 million. He explained this is the main reason the price has fallen, moving in line with the rest of the market.
Why Did XRP’s Price Fall?
Despite the record debut, XRP has seen three straight days of outflows totaling $68.63 million. This selling pressure, combined with broader weakness across crypto, has weighed heavily on its price.
Attorney Bill Morgan explained it simply: “There is no mystery why XRP price is down the last 24 hours. Just playing follow the leader.” He pointed to Bitcoin’s recent slide as the key driver, saying XRP’s movements remain strongly correlated with the wider market, a point Ripple itself emphasized during its SEC lawsuit.
Technical Picture: Important Levels to Watch
For now, XRP is trading just below a critical resistance zone at $3.20. Analysts note:
Bitcoin (BTC), the leading cryptocurrency, has experienced a notable decline, erasing the gains it achieved following the recent decision by the US Federal Reserve (Fed) to cut interest rates.
After soaring to nearly $118,000—just 5% shy of its all-time high—the market has faced renewed uncertainty. Despite this setback, experts emphasize that the long-term outlook for Bitcoin remains optimistic, especially as September 21 approaches, a date identified as pivotal for Bitcoin’s price trajectory.
Will September 21 Mark The Start Of A New Bull Run?
Market analyst Timothy Peterson highlights that historically, Bitcoin has finished the year higher 70% of the time after September 21, with a median increase exceeding 50%. He has dubbed this date “Bitcoin Bottom Day,” suggesting that the odds of a price increase are significantly favorable.
Peterson notes that two of the three downturns in Bitcoin’s history occurred during established bear markets in 2018 and 2022, conditions that do not reflect the current market situation. This leads him to believe that the chances of a price rise are closer to 90% this year.
Furthermore, Bitcoin’s track record suggests it has a nearly perfect chance of holding its gains six months post-September 21. Peterson estimates there is at least a 70% probability that Bitcoin will not drop below the $100,000 mark again.
Analysts Warn Of ‘Sell the News’ Bitcoin Phase
Ryan Lee, chief analyst at cryptocurrency exchange Bitget, also points to the recent 25-basis-point rate cut by the Fed as a factor that initially boosted Bitcoin’s price, briefly pushing it above $117,000. This cut, the first in nine months, reflects increased liquidity in the market.
However, Lee cautions that the median projection of only 50 basis points in total cuts for the year could temper some of the optimism, introducing potential volatility as traders adjust their strategies.
Historically, Bitcoin has experienced a dip of 5% to 8% following rate cuts before resuming its upward trend, suggesting a possible “sell the news” phase in the coming days.
Despite these fluctuations, Lee remains bullish about the macroeconomic environment, asserting that lower yields on money-market funds (MMFs) are likely to direct capital toward alternative investments, such as cryptocurrencies.
He emphasizes Bitcoin’s role as a hedge in this risk-on climate, especially with approximately $7.2 trillion currently held in cash-like instruments.
Looking ahead, Lee predicts that the cryptocurrency may consolidate in the near term before targeting prices between $123,000 and $150,000, should additional rate cuts materialize.
Analysts at Bitfinex also share a positive outlook, projecting that with three anticipated rate cuts by the end of the year and steady inflows into exchange-traded funds (ETFs), Bitcoin could reach between $125,000 and $135,000 by year-end.
However, they also caution that if inflation or economic growth data hinder the Fed’s ability to proceed with further cuts, Bitcoin might stabilize within a range of $110,000 to $115,000 as institutional participation and ETF assets under management provide a solid floor.
Featured image from DALL-E, chart from TradingView.com
Earlier this week, the US Federal Reserve (Fed) cut interest rates by 25 basis points, providing the much-required impetus to the economy after a cycle of raising interest rates to keep inflation under check. A cut in interest rates is likely to benefit risk-on assets, including Bitcoin (BTC).
Fed Cuts Interest Rate, Bitcoin Supply Ratio Falls
According to a CryptoQuant Quicktake post by contributor Arab Chain, the latest data from Binance shows that the interest rate cut has rekindled investors’ interest in BTC. Notably, the exchange supply ratio has declined to 0.0291, hinting that investors are choosing to withdraw their BTC from exchanges and hold it for the long-term instead of selling it.
To support their analysis, Arab Chain shared the following chart, which shows a tumbling exchange supply ratio while the BTC price continues to shoot up. The analyst noted that the interest rate cut has increased risk appetite and improved liquidity in the market.
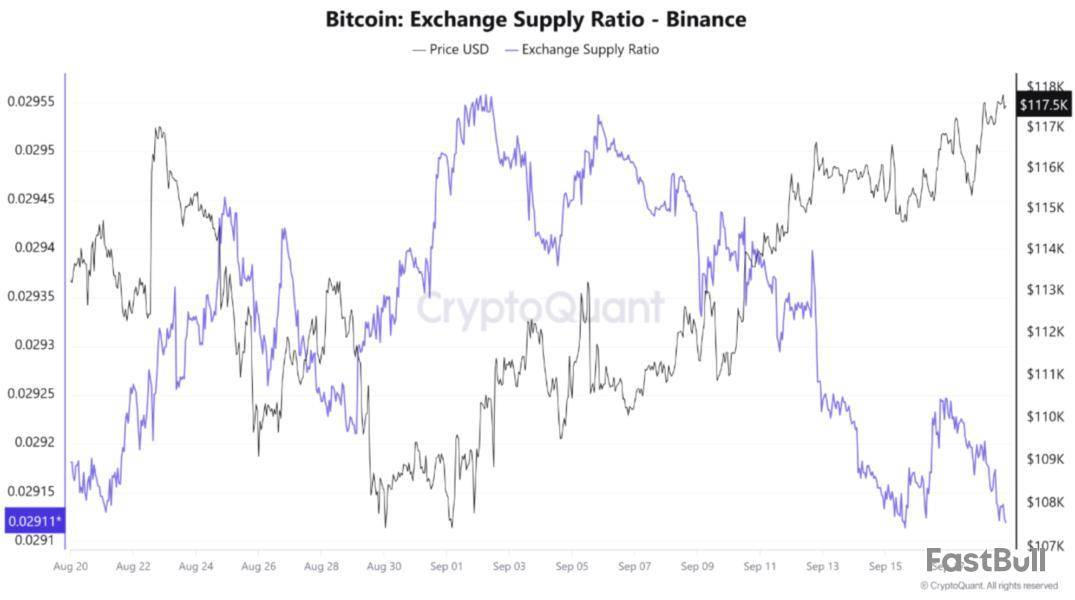
This behavior shows that the Fed’s monetary policy will remain dovish for the near term, which could mitigate selling pressure on BTC for the time being. Low exchange supply is creating relative buying pressure, as Bitcoin’s stability above $115,000 further supports this trend.
The analyst remarked that if BTC outflows from crypto exchanges continue at the current pace, then the digital asset may target the $120,000 resistance level. However, liquidity must continue to flow into digital assets, driven by the Fed’s decision. Arab Chain added:
The continued decline in the Exchange Supply Ratio for Bitcoin, coupled with a rising price, reinforces the bullish scenario, especially if traditional markets stabilize after the Fed’s decision. Conversely, if the Exchange Supply Ratio turns upward again (if Bitcoin reenters exchanges), it could signal that investors are preparing to take profits at levels near 118K–120K.
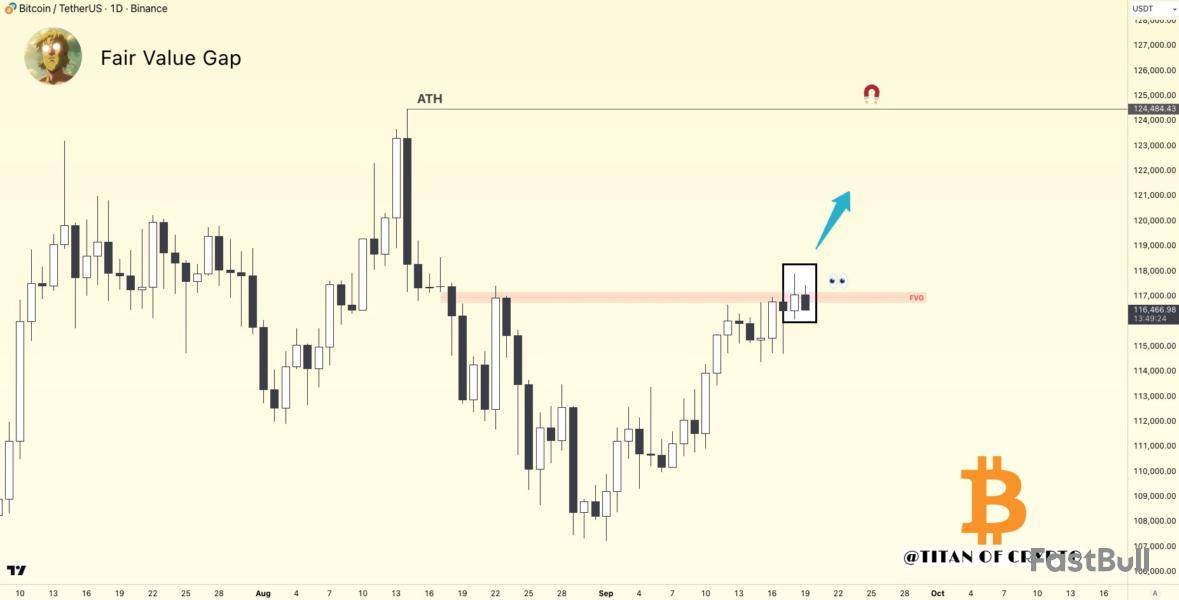
Meanwhile, crypto analyst Titan of Crypto had similar thoughts. In an X post, the analyst shared the following chart, saying that BTC is currently stuck under the bearish fair value gap. A daily close above this gap – highlighted in red – could pave the way for a new high for BTC.
Is BTC Facing A Supply Crunch?
A declining exchange supply ratio further suggests that BTC may be approaching a bullish ‘supply crunch’ that could lead to significant price appreciation for the digital asset in the near term.
Recently, the Bitcoin Scarcity Index recorded its first spike since June 2025, indicating potential upward price pressure on BTC. Meanwhile, BTC outflows from Binance continue at a rapid pace, further reducing the digital asset’s active circulating supply.
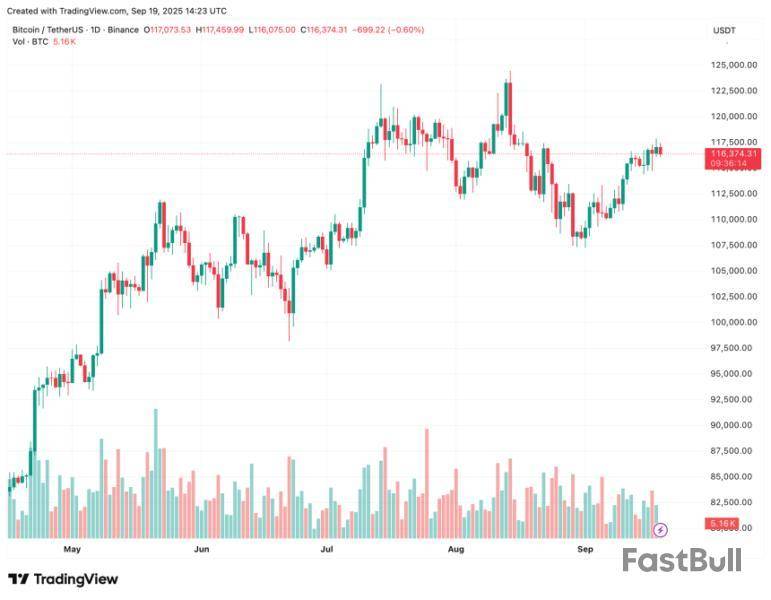
That said, some concerns still linger, specifically due to the lack of participation of whales in recent BTC price action. At press time, BTC trades at $116,374, down 1.3% in the past 24 hours.
Crypto market participants may be underestimating how aggressive the US Federal Reserve will be in the coming months in shifting its policy direction, according to an economist.
“Markets are underpricing the likelihood of rapid rate cuts in the coming months on the part of the Federal Reserve,” Economist Timothy Peterson told Cointelegraph on Friday.
“There has never been a gradual reduction in rates like that currently envisioned by the Fed,” Peterson said, explaining that he expects “the surprise effect” to kick in and potentially catch the market offside.
Peterson’s comments come just days after the Fed implemented its first rate cut of 2025 on Sept. 17 by 25 basis points, a highly expected event by the majority of the market, with 96% odds on the day, and a 4% probability of the rates being reduced by 50 bps, according to the CME FedWatch Tool.
Market is anticipating another rate cut in October
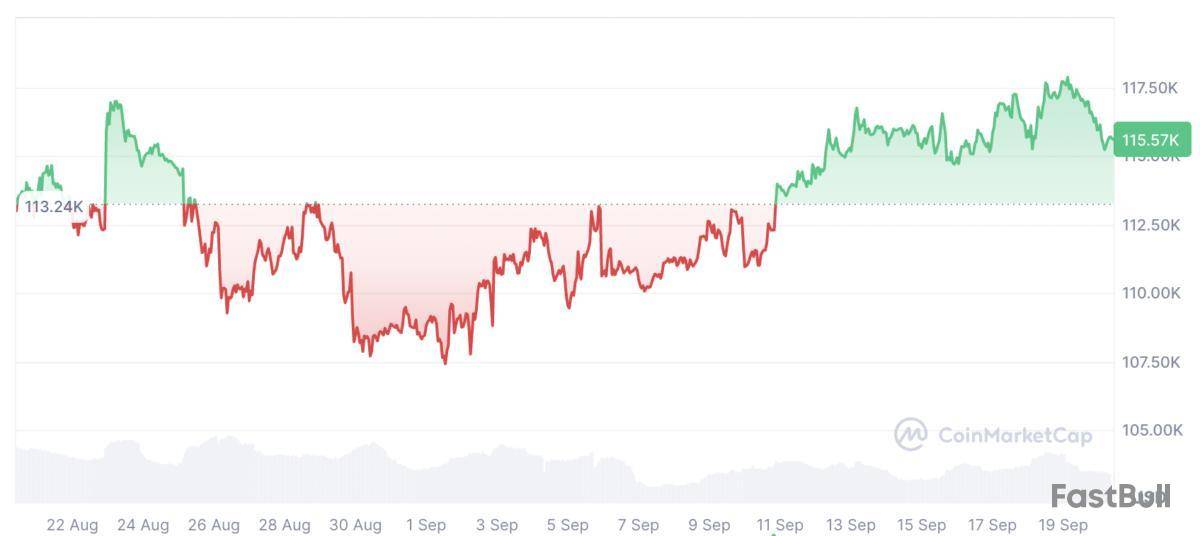
Bitcoin (BTC) briefly surged to $117,000 hours before the Fed’s rate cut announcement but has since retreated to levels seen in the days prior, trading at $115,570 at the time of publication, according to CoinMarketCap.
CME data shows that market participants are pricing in a 91.9% chance of another 25 basis point rate cut at the Oct. 29 meeting, with only an 8.1% probability that rates remain unchanged.
Fed officials said they two more quarter-point rate cuts this year. However, Fed Chair Jerome Powell said, “We’re not on a pre-set path.”
Financial institutions were split on Fed’s next move
Some financial institutions expected a more aggressive rate cut at the September meeting.
Standard Chartered forecasted a 50 basis point reduction, while Goldman Sachs CEO David Solomon was more confident that the Fed would stick to a 25 basis point cut.
Lowering interest rates tends to be bullish for risk-on assets, including cryptocurrencies, as traditional investments like bonds and term deposits become less lucrative to investors.
Aster’s native token, ASTER, surged 1,650% in its first 24 hours of trading and reached $0.528, according to platform reports.
Trading volume for the token in that window was listed at $345 million, and the launch reportedly drew 330,000 new wallets.
Rapid User Growth And Liquidity
According to on-chain data and platform disclosures, Aster’s total value locked jumped from $660 million to $1 billion shortly after launch.
The platform claims total users of 1.848 million, with seven-day new user additions hitting 617,379. Reports show daily figures of 53,332 new users and $1.50 billion in 24-hour trading volume.
The debut also included a Binance Alpha listing within hours and new perpetual markets introduced with up to 50x exposure across four assets. Platform income was reported at $466,838 for a day and $49.2 million in total earnings to date.
Aster@Aster_DEXSep 18, 2025A significant first step for $ASTER on BNB Chain.
• $345M traded in 24h • Price reached $0.528 (~1,650%) • 330K new wallets joined • TVL $660M → $1.005B • Platform volume near $1.5B
Thanks to our community for the trust and support. We’ll keep focusing on building an open… pic.twitter.com/cgPlwb2FVh
Feature Rollouts And Trading Tools
Based on reports, Aster moved quickly to enable spot withdrawals earlier than planned, using BNB Chain with a quoted 30-second processing time.
The team activated ASTER/USDT perpetuals with four-times margin and hourly funding rate settlements. The platform also introduced a Genesis Stage 2 scoring program that rewards more than just raw trading volume, aiming to favor what it calls “smart traders.”
Top users have been reported to show realized gains greater than $645,000 in early trading sessions. Technical Features And Security
Aster has positioned itself as a multi-chain protocol with native support across BNB Chain, Ethereum, Solana, and Arbitrum, removing the need for manual bridging for many flows, according to technical notes.
The protocol uses zero-knowledge proofs on its own Aster Chain for trade validation and taps Pyth Network oracles for price feeds.
Reports show the platform uses collateral tokens like asBNB and USDF that can be staked to earn yield while remaining active in trading.Strong Endorsement
Meanwhile, platform data listed $517 trillion in cumulative trading volume and close to $450 million in total TVL.
Much of Aster’s surge can be tied to the strong backing of former Binance CEO Changpeng Zhao. His public endorsements, where he compared the platform’s liquidity to “Binance level” and praised the team’s execution, have played a major role in drawing attention and capital to the project.
Featured image from Unsplash, chart from TradingView
Data shows bullish sentiment around Bitcoin Cash has exploded on social media, potentially explaining the coin’s pullback from its 17-month high.
Bitcoin Cash Has Seen A Spike In Positive/Negative Sentiment
In a new post on X, analytics firm Santiment has discussed the trend in the Positive/Negative Sentiment for Bitcoin Cash. This indicator measures, as its name suggests, the ratio between the positive and negative comments related to BCH that are currently present on the major social media platforms.
The metric separates posts/threads/messages into bullish or bearish by putting them through a machine-learning model. Once they have been divided, it counts up the number of each and calculates their ratio to find the net sentiment on social media.
Now, here is the chart shared by Santiment that shows the trend in the Positive/Negative Sentiment for Bitcoin Cash over the past month:
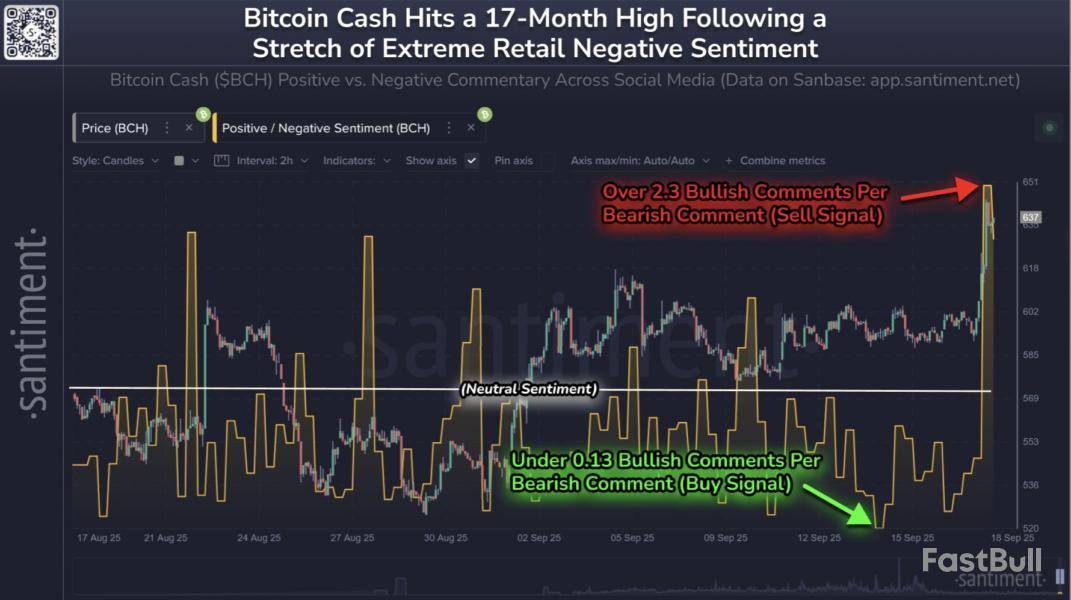
As displayed in the above graph, the Bitcoin Cash Positive/Negative Sentiment fell to a low of 0.13 earlier in the month. Such a value corresponds to there being just 0.13 bullish comments for every bearish post. Thus, it would appear that social media traders were heavily leaning toward a negative outcome for BCH. Interestingly, what followed the market disbelief was a surge in the coin’s price to the $650 level for the first time since April 2024, around 17 months ago.
This pattern is something that has actually been seen many times throughout the past. “Historically, prices move the opposite of the crowd’s expectations,” notes the analytics firm. This means that an excess of bearish sentiment tends to be a buy signal for the cryptocurrency, while overexcitement can lead to a top.
While BCH initially observed the former type of effect, market balance quickly shifted, and it’s now facing the latter part of the pattern. From the chart, it’s visible that the sharp rally in the coin brought with it a huge spike in the Positive/Negative Sentiment to the 2.3 level.
Bitcoin Cash has witnessed its price drop by around 6.7% since this dominance in bullish sentiment has emerged. It now remains to be seen how the market will react to the pullback and whether another shift in the Positive/Negative Sentiment would follow. Naturally, a pivot back to the bearish zone could help stabilize the price decline.
In some other news, centralized exchanges have just received a huge amount of USDC inflows, as pointed out by CryptoQuant community analyst Maartunn in a new post on X.
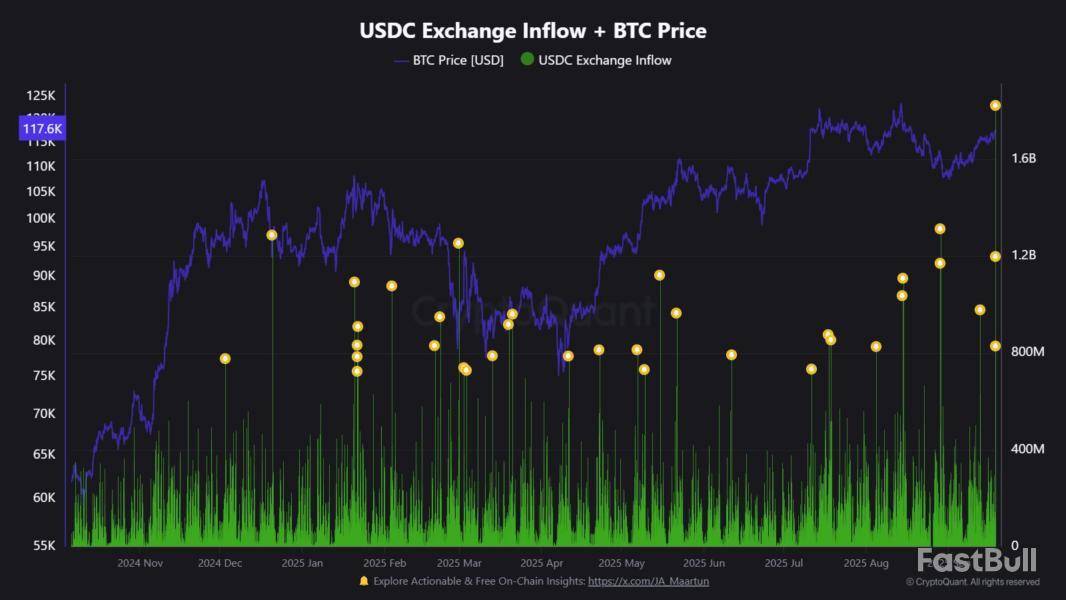
With this inflow spree, investors have deposited $1.33 billion in the stablecoin to exchanges, the highest level in more than four years. “Massive stablecoin deposits like this often precede major market moves,” explains the analyst.
BCH Price
At the time of writing, Bitcoin Cash is floating around $605, up more than 2.5% over the last seven days.
With Ethereum struggling, Shiba inu and XRP are following the rest of the market. The new descending channel on XRP, the secret triangle formation on ETH and the poor performance of SHIB shapes the negative outlook of the market over the weekend.
Ethereum's secret triangle
Around the $4,530 mark, where a sizable symmetrical triangle has been forming for the past few weeks, Ethereum is currently sitting on a crucial price signal. One of technical analysis’s most dependable volatility setups is this consolidation structure, and how it resolves may determine Ethereum’s next significant move.
After a daily decline of -2.9%, ETH is currently trading at about $4,454. The 50-day and 100-day exponential moving averages (EMAs) are serving as strong support layers, as the coin is rising above its key EMAs, which are at $4,322 and $3,800, respectively. Ethereum appears to be neither overbought nor oversold according to the RSI, at about 54, which puts the market in a balanced position for a significant break. Chart by TradingView">
In the triangle pattern, compressed volatility is highlighted. ETH has historically generated explosive momentum when it coils inside such constricted structures. The $4,530 zone, where the triangle’s upper resistance converges, is the area that traders are keeping a careful eye on. If there is a clear breakout above this level, short liquidations and fresh institutional inflows into ETH-based products could trigger a rapid move toward $5,000 and higher.
Conversely, the inability to maintain the triangle’s lower boundary, around $4,400, might validate a brief downward trend. This situation might push ETH back toward $3,800, the 100-day EMA, which has historically protected against significant corrections.
The timing, rather than the pattern itself, is what makes this setup secret. While Bitcoin has been making headlines, Ethereum has been consolidating. However, the triangle formed by ETH suggests that the altcoin market may be preparing for a volatility implosion, which, if it gains traction, could lead to a wider rally.
XRP's momentum disappears
XRP has failed to maintain momentum above short-term resistance and is currently trading at about $3.00, indicating weakness. There is a distinct descending channel on the chart, which frequently indicates bearish continuation. As XRP consolidates within this smaller range, traders should brace themselves for possible downside volatility.
Two short-term support levels are the 50-day EMA at $2.99 and the 100-day EMA at $2.98. Bulls may be losing control, though, if they are unable to break through the descending trendline resistance. If XRP breaks below these clustered EMAs, the 200-day EMA at $2.83 will be the next target for a decline. If XRP drops sharply below this level, it may signal a more significant correction and move closer to the $2.58 region, which was a good place to accumulate earlier this year.
On the upside, the bearish channel and signal strength would need to be invalidated by a move above $3.20. The RSI is currently between 51 and 53, indicating a lack of strong buying momentum, so the bias is still leaning toward sellers until that time.
Given the bearish channel structure, XRP’s most likely price range in the near future is between $2.83 and $3.20, with a probability bias toward testing lower levels. If sentiment on the market worsens, XRP may fall back into the mid-$2.50s, where long-term buyers might reenter.
To sum up, XRP is stuck in a channel that is getting narrower, which usually happens before a significant move.
Shiba Inu loses key level
The $0.000013 threshold, a crucial psychological and technical level that should be monitored, has been breached once more by Shiba Inu. This breakdown shows how SHIB’s market structure is becoming weaker, which raises the possibility of a more severe decline in the near future.
The most concerning indication, in this case, is that SHIB’s moving averages have not offered any significant support. The 100-day and 50-day EMAs, which frequently serve as stabilizing zones on markets that are consolidating, have not held up. Instead, there appears to be bearish dominance, as price action has been consistently breaking below these averages. There is not much upside momentum left for SHIB to rely on because the 200-day EMA is positioned close to $0.0000138 and serving as a ceiling.
A narrowing triangle structure is also visible on the chart, with SHIB moving toward the lower boundary at about $0.0000128. A quicker sell-off could be triggered if this floor gives way, pulling the token in a longer correction toward $0.0000120 or even the $0.0000110 region. The declining RSI, which is currently hovering slightly above the neutral zone, indicates that buyers are retreating, giving sellers more space to exert control.
The outlook in the near future is still cautious. The market may be viewing $0.000013 as resistance rather than support if it loses that level but is unable to reclaim it decisively. This means that the path of least resistance remains downward until SHIB closes above both $0.000013 and the clustered EMAs.
Right now, the market is entering a weekend trading session on a negative note, which means volatility and liquidity will get even thinner and potentially cause a foundation for a bearish rally on the market.
728 RM B 7/F GEE LOK IND BLDG NO 34 HUNG TO RD KWUN TONG KLN HONG KONG


White Label
Data API
Web Plug-ins
Poster Maker
Affiliate Program
The risk of loss in trading financial instruments such as stocks, FX, commodities, futures, bonds, ETFs and crypto can be substantial. You may sustain a total loss of the funds that you deposit with your broker. Therefore, you should carefully consider whether such trading is suitable for you in light of your circumstances and financial resources.
No decision to invest should be made without thoroughly conducting due diligence by yourself or consulting with your financial advisors. Our web content might not suit you since we don't know your financial conditions and investment needs. Our financial information might have latency or contain inaccuracy, so you should be fully responsible for any of your trading and investment decisions. The company will not be responsible for your capital loss.
Without getting permission from the website, you are not allowed to copy the website's graphics, texts, or trademarks. Intellectual property rights in the content or data incorporated into this website belong to its providers and exchange merchants.
Not Logged In
Log in to access more features

FastBull Membership
Not yet
Purchase


Log In
Sign Up


