

Markets
News
Analysis
User
24/7
Economic Calendar
Education
Data
- Names
- Latest
- Prev


Signal Accounts for Members
All Signal Accounts
All Contests
 U.K. Trade Balance Non-EU (SA) (Oct)
A:--
F: --
P: --
U.K. Trade Balance (Oct)A:--
F: --
P: --
U.K. Services Index MoMA:--
F: --
P: --
U.K. Construction Output MoM (SA) (Oct)A:--
F: --
P: --
U.K. Industrial Output YoY (Oct)A:--
F: --
P: --
U.K. Trade Balance (SA) (Oct)A:--
F: --
P: --
U.K. Trade Balance EU (SA) (Oct)A:--
F: --
P: --
U.K. Manufacturing Output YoY (Oct)A:--
F: --
P: --
U.K. GDP MoM (Oct)A:--
F: --
P: --
U.K. GDP YoY (SA) (Oct)A:--
F: --
P: --
U.K. Industrial Output MoM (Oct)A:--
F: --
P: --
U.K. Construction Output YoY (Oct)A:--
F: --
P: --
 France HICP Final MoM (Nov)
A:--
F: --
P: --
 China, Mainland Outstanding Loans Growth YoY (Nov)
A:--
F: --
P: --
China, Mainland M2 Money Supply YoY (Nov)A:--
F: --
P: --
China, Mainland M0 Money Supply YoY (Nov)A:--
F: --
P: --
China, Mainland M1 Money Supply YoY (Nov)A:--
F: --
P: --
 India CPI YoY (Nov)
A:--
F: --
P: --
India Deposit Gowth YoYA:--
F: --
P: --
 Brazil Services Growth YoY (Oct)
A:--
F: --
P: --
 Mexico Industrial Output YoY (Oct)
A:--
F: --
P: --
 Russia Trade Balance (Oct)
A:--
F: --
P: --
 Philadelphia Fed President Henry Paulson delivers a speech
 Canada Building Permits MoM (SA) (Oct)
A:--
F: --
P: --
Canada Wholesale Sales YoY (Oct)A:--
F: --
P: --
Canada Wholesale Inventory MoM (Oct)A:--
F: --
P: --
Canada Wholesale Inventory YoY (Oct)A:--
F: --
P: --
Canada Wholesale Sales MoM (SA) (Oct)A:--
F: --
P: --
 Germany Current Account (Not SA) (Oct)
A:--
F: --
P: --
U.S. Weekly Total Rig CountA:--
F: --
P: --
U.S. Weekly Total Oil Rig CountA:--
F: --
P: --
 Japan Tankan Large Non-Manufacturing Diffusion Index (Q4)
--
F: --
P: --
Japan Tankan Small Manufacturing Outlook Index (Q4)--
F: --
P: --
Japan Tankan Large Non-Manufacturing Outlook Index (Q4)--
F: --
P: --
Japan Tankan Large Manufacturing Outlook Index (Q4)--
F: --
P: --
Japan Tankan Small Manufacturing Diffusion Index (Q4)--
F: --
P: --
Japan Tankan Large Manufacturing Diffusion Index (Q4)--
F: --
P: --
Japan Tankan Large-Enterprise Capital Expenditure YoY (Q4)--
F: --
P: --
U.K. Rightmove House Price Index YoY (Dec)--
F: --
P: --
China, Mainland Industrial Output YoY (YTD) (Nov)--
F: --
P: --
China, Mainland Urban Area Unemployment Rate (Nov)--
F: --
P: --
 Saudi Arabia CPI YoY (Nov)
--
F: --
P: --
 Euro Zone Industrial Output YoY (Oct)
--
F: --
P: --
Euro Zone Industrial Output MoM (Oct)--
F: --
P: --
Canada Existing Home Sales MoM (Nov)--
F: --
P: --
Euro Zone Total Reserve Assets (Nov)--
F: --
P: --
U.K. Inflation Rate Expectations--
F: --
P: --
Canada National Economic Confidence Index--
F: --
P: --
Canada New Housing Starts (Nov)--
F: --
P: --
U.S. NY Fed Manufacturing Employment Index (Dec)--
F: --
P: --
U.S. NY Fed Manufacturing Index (Dec)--
F: --
P: --
Canada Core CPI YoY (Nov)--
F: --
P: --
Canada Manufacturing Unfilled Orders MoM (Oct)--
F: --
P: --
Canada Manufacturing New Orders MoM (Oct)--
F: --
P: --
Canada Core CPI MoM (Nov)--
F: --
P: --
Canada Manufacturing Inventory MoM (Oct)--
F: --
P: --
Canada CPI YoY (Nov)--
F: --
P: --
Canada CPI MoM (Nov)--
F: --
P: --
Canada CPI YoY (SA) (Nov)--
F: --
P: --
Canada Core CPI MoM (SA) (Nov)--
F: --
P: --

No matching data
Latest Views
Latest Views
Trending Topics
Top Columnists
Latest Update
White Label
Data API
Web Plug-ins
Affiliate Program
View All
No data


What Happened?
Shares of insurance and annuity provider Brighthouse Financial jumped 10.1% in the morning session after reports revealed that private capital group Aquarian Holdings is advancing its plans to acquire the life insurer.
According to a report from the Financial Times, Aquarian is in late-stage discussions with two large Middle Eastern investors to secure the necessary equity financing for the potential deal. The prospect of an acquisition is driving significant investor interest, as such deals often involve a premium over the current stock price. The stock was already showing strength in premarket trading following the emergence of the news.
Is now the time to buy Brighthouse Financial? Access our full analysis report here, it’s free.
What Is The Market Telling Us
Brighthouse Financial’s shares are quite volatile and have had 17 moves greater than 5% over the last year. But moves this big are rare even for Brighthouse Financial and indicate this news significantly impacted the market’s perception of the business.
The biggest move we wrote about over the last year was about 2 months ago when the stock gained 9.5% on the news that reports surfaced that the company is in exclusive talks to be acquired by investment firm Aquarian Holdings. The news, first reported by The Wall Street Journal, indicated that a deal could be finalized within a few weeks. This development follows a period of exploration by Brighthouse, which had reportedly been working with bankers on a potential sale for much of the year. Life insurance and annuity companies like Brighthouse have increasingly become attractive targets for private equity firms and asset managers. These buyers are often drawn to the large asset bases of insurers, which they can manage and deploy into their own investment strategies. The potential acquisition by Aquarian highlights a strategic interest in Brighthouse's substantial financial operations and its undervalued assets.
Brighthouse Financial is down 0% since the beginning of the year, and at $47.98 per share, it is trading 23.8% below its 52-week high of $62.97 from February 2025. Investors who bought $1,000 worth of Brighthouse Financial’s shares 5 years ago would now be looking at an investment worth $1,577.

Insurance companies serve as the backbone of risk management, providing essential protection and financial security for individuals and businesses. But worries about an economic slowdown and potential claims deterioration have kept sentiment in check, and over the past six months, the industry’s 5.9% return has trailed the S&P 500 by 9.8 percentage points.
The elite companies can churn out earnings growth under any circumstance, however, and our mission at StockStory is to help you find them. With that said, here are two resilient insurance stocks at the top of our wish list and one we’re passing on.
One Insurance Stock to Sell:
Brighthouse Financial (BHF)
Market Cap: $2.48 billion
Spun off from MetLife in 2017 to focus specifically on retail financial products, Brighthouse Financial provides annuity contracts and life insurance products designed to help individuals protect wealth, generate income, and transfer assets.
Why Are We Hesitant About BHF?
At $46.28 per share, Brighthouse Financial trades at 0.6x forward P/B. Read our free research report to see why you should think twice about including BHF in your portfolio.
Two Insurance Stocks to Watch:
Primerica (PRI)
Market Cap: $8.90 billion
With a sales force of over 140,000 licensed representatives operating on an independent contractor model, Primerica provides term life insurance, investment products, and other financial services to middle-income households in the United States and Canada.
Why Is PRI Interesting?
Primerica is trading at $274.90 per share, or 3.8x forward P/B. Is now a good time to buy? See for yourself in our full research report, it’s free.
Skyward Specialty Insurance (SKWD)
Market Cap: $2.03 billion
Founded in 2006 to serve markets where standard insurance coverage falls short, Skyward Specialty Insurance provides customized commercial property, casualty, and health insurance solutions for underserved or specialized market niches.
Why Is SKWD a Top Pick?
Skyward Specialty Insurance’s stock price of $50.29 implies a valuation ratio of 2.2x forward P/B. Is now the right time to buy? Find out in our full research report, it’s free.
Stocks We Like Even More
Donald Trump’s April 2025 "Liberation Day" tariffs sent markets into a tailspin, but stocks have since rebounded strongly, proving that knee-jerk reactions often create the best buying opportunities.
The smart money is already positioning for the next leg up. Don’t miss out on the recovery - check out our Top 9 Market-Beating Stocks. This is a curated list of our High Quality stocks that have generated a market-beating return of 183% over the last five years (as of March 31st 2025).
Stocks that made our list in 2020 include now familiar names such as Nvidia (+1,545% between March 2020 and March 2025) as well as under-the-radar businesses like the once-micro-cap company Tecnoglass (+1,754% five-year return).
StockStory is growing and hiring equity analyst and marketing roles. Are you a 0 to 1 builder passionate about the markets and AI? See the open roles here.


Let’s dig into the relative performance of Primerica and its peers as we unravel the now-completed Q2 life insurance earnings season.
Life insurance companies collect premiums from policyholders in exchange for providing a future death benefit or retirement income stream. Interest rates matter for the sector (and make it cyclical), with higher rates allowing insurers to reinvest their fixed-income portfolios at more attractive yields and vice versa. Additionally, favorable demographic shifts, such as an aging population, are driving strong demand for retirement products while AI and data analytics offer significant opportunities to improve underwriting accuracy and operational efficiency. Conversely, the industry faces headwinds from persistent competition from agile insurtechs that threaten traditional distribution models.
The 15 life insurance stocks we track reported a slower Q2. As a group, revenues beat analysts’ consensus estimates by 0.8%.
Thankfully, share prices of the companies have been resilient as they are up 5.1% on average since the latest earnings results.
With a sales force of over 140,000 licensed representatives operating on an independent contractor model, Primerica provides term life insurance, investment products, and other financial services to middle-income households in the United States and Canada.
Primerica reported revenues of $793.3 million, up 7.1% year on year. This print exceeded analysts’ expectations by 0.9%. Despite the top-line beat, it was still a mixed quarter for the company with an impressive beat of analysts’ book value per share estimates but a significant miss of analysts’ net premiums earned estimates.
“Our second quarter results underscore the resilience and strength of our business model,” said Glenn Williams, Chief Executive Officer of Primerica.
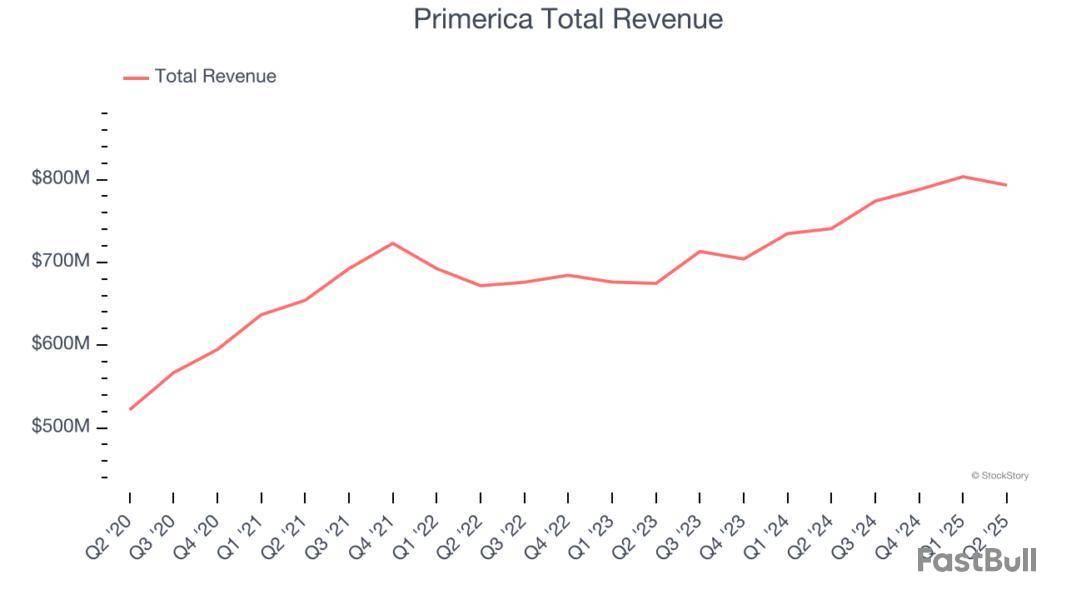
The market was likely pricing in the results, and the stock is flat since reporting. It currently trades at $266.85.
Is now the time to buy Primerica? Access our full analysis of the earnings results here, it’s free.
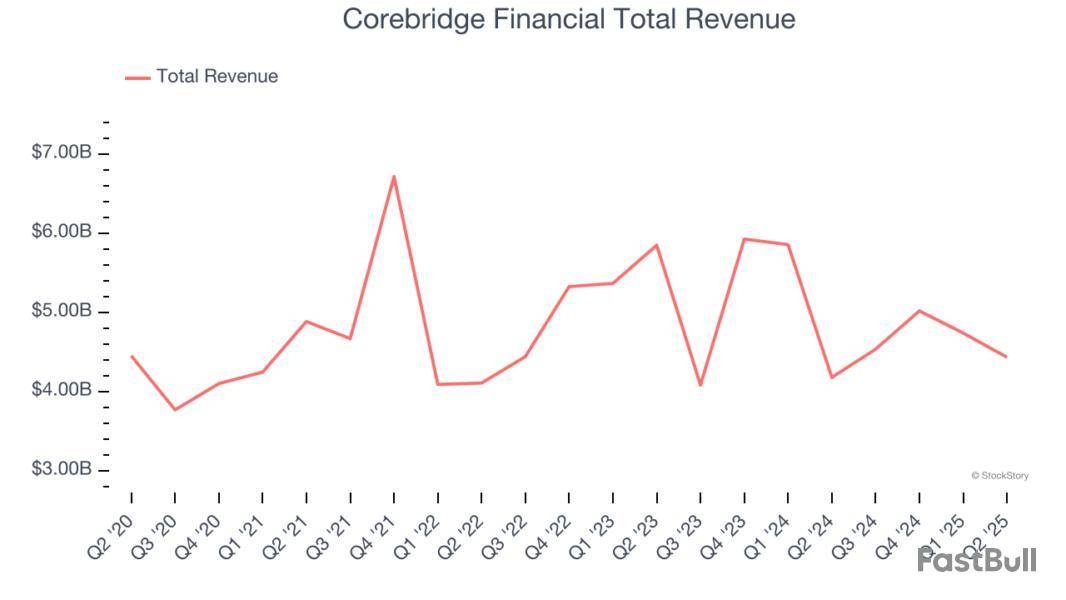
Spun off from insurance giant AIG in 2022 to focus on the growing retirement market, Corebridge Financial provides retirement solutions, annuities, life insurance, and institutional risk management products in the United States.
Corebridge Financial reported revenues of $4.43 billion, up 6.1% year on year, outperforming analysts’ expectations by 7.6%. The business had a stunning quarter with a beat of analysts’ EPS estimates.

However, the results were likely priced into the stock as it’s traded sideways since reporting. Shares currently sit at $34.45.
Is now the time to buy Corebridge Financial? Access our full analysis of the earnings results here, it’s free.
Weakest Q2: Brighthouse Financial
Spun off from MetLife in 2017 to focus specifically on retail financial products, Brighthouse Financial provides annuity contracts and life insurance products designed to help individuals protect wealth, generate income, and transfer assets.
Brighthouse Financial reported revenues of $2.15 billion, down 2.9% year on year, falling short of analysts’ expectations by 1.3%. It was a disappointing quarter as it posted a significant miss of analysts’ net premiums earned estimates and a significant miss of analysts’ EPS estimates.
Interestingly, the stock is up 1.8% since the results and currently trades at $47.
Read our full analysis of Brighthouse Financial’s results here.
Spun off from British insurer Prudential plc in 2021 after more than 60 years as its U.S. subsidiary, Jackson Financial offers annuity products and retirement solutions that help Americans grow and protect their retirement savings and income.
Jackson Financial reported revenues of $1.75 billion, up 1.4% year on year. This number was in line with analysts’ expectations. Zooming out, it was a mixed quarter as it recorded a narrow beat of analysts’ EPS estimates.
The stock is up 12.3% since reporting and currently trades at $97.16.
Read our full, actionable report on Jackson Financial here, it’s free.
Founded in 1945 and named after the 19th-century education reformer known as the "father of American public education," Horace Mann Educators is an insurance company that specializes in providing auto, property, life, and retirement products tailored for educators and other public service employees.
Horace Mann Educators reported revenues of $411.7 million, up 6.1% year on year. This print came in 3.5% below analysts' expectations. Overall, it was a slower quarter as it also produced a significant miss of analysts’ book value per share estimates and a slight miss of analysts’ net premiums earned estimates.
The stock is up 9.1% since reporting and currently trades at $46.12.
Read our full, actionable report on Horace Mann Educators here, it’s free.
Market Update
The Fed’s interest rate hikes throughout 2022 and 2023 have successfully cooled post-pandemic inflation, bringing it closer to the 2% target. Inflationary pressures have eased without tipping the economy into a recession, suggesting a soft landing. This stability, paired with recent rate cuts (0.5% in September 2024 and 0.25% in November 2024), fueled a strong year for the stock market in 2024. The markets surged further after Donald Trump’s presidential victory in November, with major indices reaching record highs in the days following the election. Still, questions remain about the direction of economic policy, as potential tariffs and corporate tax changes add uncertainty for 2025.
By Katherine Hamilton
Brighthouse Financial named Myles Lambert as chief operating officer.
Lambert, who started the role on Aug. 30, has been serving as chief distribution and marketing officer since August 2017.
The Charlotte, N.C., insurance company has been without a chief operating officer since March 2022, when Conor Murphy stepped down. At the time, Brighthouse said it had decided to eliminate the position.
Lambert, 50, will be paid a salary of $700,000, which is $100,000 more than the salary Murphy was getting when he left in 2022, according to a separate filing. Lambert is also getting $1 million as a special cash award for starting the job. Murphy made a total compensation of $2.4 million in 2022.
Brighthouse also said it had appointed Melissa Pavlovich as chief accounting officer. She succeeds Richard Cook, who was serving in the interim, and she was previously leading the company's tax department.
Write to Katherine Hamilton at katherine.hamilton@wsj.com


Wall Street is overwhelmingly bullish on the stocks in this article, with price targets suggesting significant upside potential. However, it’s worth remembering that analysts rarely issue sell ratings, partly because their firms often seek other business from the same companies they cover.
At StockStory, we look beyond the headlines with our independent analysis to determine whether these bullish calls are justified. That said, here is one stock likely to meet or exceed Wall Street’s lofty expectations and two where analysts may be overlooking some important risks.
Two Stocks to Sell:
Denny's (DENN)
Consensus Price Target: $5.55 (19.9% implied return)
Open around the clock, Denny’s is a chain of diner restaurants serving breakfast and traditional American fare.
Why Do We Avoid DENN?
Denny's is trading at $4.63 per share, or 9x forward P/E. Check out our free in-depth research report to learn more about why DENN doesn’t pass our bar.
Brighthouse Financial (BHF)
Consensus Price Target: $56.22 (20.3% implied return)
Spun off from MetLife in 2017 to focus specifically on retail financial products, Brighthouse Financial provides annuity contracts and life insurance products designed to help individuals protect wealth, generate income, and transfer assets.
Why Are We Wary of BHF?
Brighthouse Financial’s stock price of $46.75 implies a valuation ratio of 0.6x forward P/B. Dive into our free research report to see why there are better opportunities than BHF.
One Stock to Buy:
Merck (MRK)
Consensus Price Target: $100.41 (19.3% implied return)
With roots dating back to 1891 and a portfolio that includes the blockbuster cancer immunotherapy Keytruda, Merck develops and sells prescription medicines, vaccines, and animal health products across oncology, infectious diseases, cardiovascular, and other therapeutic areas.
Why Do We Love MRK?
At $84.13 per share, Merck trades at 9.2x forward P/E. Is now the right time to buy? Find out in our full research report, it’s free.
Stocks We Like Even More
When Trump unveiled his aggressive tariff plan in April 2025, markets tanked as investors feared a full-blown trade war. But those who panicked and sold missed the subsequent rebound that’s already erased most losses.
Don’t let fear keep you from great opportunities and take a look at Top 6 Stocks for this week. This is a curated list of our High Quality stocks that have generated a market-beating return of 183% over the last five years (as of March 31st 2025).
Stocks that made our list in 2020 include now familiar names such as Nvidia (+1,545% between March 2020 and March 2025) as well as under-the-radar businesses like the once-micro-cap company Tecnoglass (+1,754% five-year return).
StockStory is growing and hiring equity analyst and marketing roles. Are you a 0 to 1 builder passionate about the markets and AI? See the open roles here.


The end of an earnings season can be a great time to discover new stocks and assess how companies are handling the current business environment. Let’s take a look at how F&G Annuities & Life and the rest of the life insurance stocks fared in Q2.
Life insurance companies collect premiums from policyholders in exchange for providing a future death benefit or retirement income stream. Interest rates matter for the sector (and make it cyclical), with higher rates allowing insurers to reinvest their fixed-income portfolios at more attractive yields and vice versa. Additionally, favorable demographic shifts, such as an aging population, are driving strong demand for retirement products while AI and data analytics offer significant opportunities to improve underwriting accuracy and operational efficiency. Conversely, the industry faces headwinds from persistent competition from agile insurtechs that threaten traditional distribution models.
The 15 life insurance stocks we track reported a slower Q2. As a group, revenues beat analysts’ consensus estimates by 0.8%.
Thankfully, share prices of the companies have been resilient as they are up 5.7% on average since the latest earnings results.
Founded in 1959 and serving approximately 677,000 policyholders who rely on its financial protection products, F&G Annuities & Life provides fixed annuities, life insurance, and pension risk transfer solutions to retail and institutional clients.
F&G Annuities & Life reported revenues of $1.35 billion, up 12.6% year on year. This print exceeded analysts’ expectations by 13.8%. Overall, it was a very strong quarter for the company with a beat of analysts’ EPS estimates and an impressive beat of analysts’ net premiums earned estimates.
Chris Blunt, F&G's Chief Executive Officer, said, "We grew AUM before flow reinsurance to $69.2 billion at the end of the second quarter, an increase of 13% from second quarter 2024, driven by strong sales. Our business is benefiting from increased scale, as our ratio of operating expense to AUM before flow reinsurance has decreased by 5 basis points from the second quarter of 2024, and we expect further improvement in the second half of the year. Our high quality investment portfolio is performing well and credit related impairments remain below our pricing assumption. Overall, we have had tremendous growth since FNF acquired F&G in June 2020, with a cumulative 58% increase in book value per share excluding AOCI since year-end 2020, to $43.39 at the end of the second quarter."
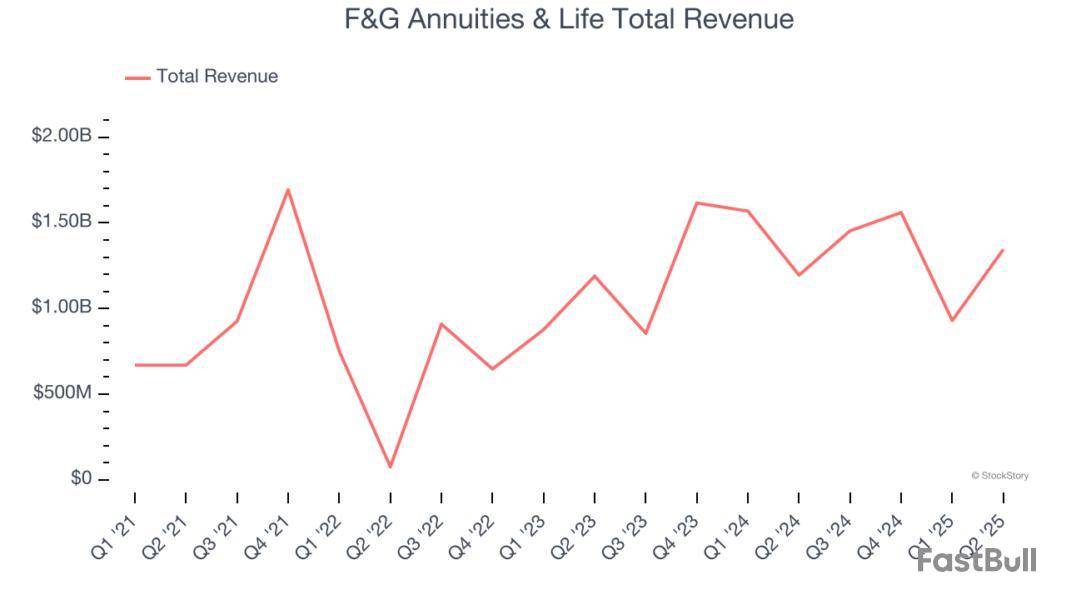
F&G Annuities & Life achieved the biggest analyst estimates beat and fastest revenue growth of the whole group. Unsurprisingly, the stock is up 4.3% since reporting and currently trades at $34.57.
Spun off from insurance giant AIG in 2022 to focus on the growing retirement market, Corebridge Financial provides retirement solutions, annuities, life insurance, and institutional risk management products in the United States.
Corebridge Financial reported revenues of $4.43 billion, up 6.1% year on year, outperforming analysts’ expectations by 7.6%. The business had a stunning quarter with a beat of analysts’ EPS estimates.

However, the results were likely priced into the stock as it’s traded sideways since reporting. Shares currently sit at $34.77.
Is now the time to buy Corebridge Financial? Access our full analysis of the earnings results here, it’s free.
Weakest Q2: Brighthouse Financial
Spun off from MetLife in 2017 to focus specifically on retail financial products, Brighthouse Financial provides annuity contracts and life insurance products designed to help individuals protect wealth, generate income, and transfer assets.
Brighthouse Financial reported revenues of $2.15 billion, down 2.9% year on year, falling short of analysts’ expectations by 1.3%. It was a disappointing quarter as it posted a significant miss of analysts’ net premiums earned estimates and a significant miss of analysts’ EPS estimates.
Interestingly, the stock is up 1.2% since the results and currently trades at $46.75.
Read our full analysis of Brighthouse Financial’s results here.
Founded in 1863 by a group of New York businessmen during the Civil War era, MetLife is a global financial services company that provides insurance, annuities, employee benefits, and asset management services to individuals and businesses worldwide.
MetLife reported revenues of $17.92 billion, down 4.1% year on year. This print missed analysts’ expectations by 3.9%. It was a softer quarter as it also produced a significant miss of analysts’ book value per share estimates and a significant miss of analysts’ EPS estimates.
The stock is up 7% since reporting and currently trades at $81.36.
Read our full, actionable report on MetLife here, it’s free.
Tracing its roots back to 1859 as one of America's oldest financial institutions, Equitable Holdings provides retirement planning, asset management, and life insurance products through its two main franchises, Equitable and AllianceBernstein.
Equitable Holdings reported revenues of $4.03 billion, up 11.4% year on year. This result surpassed analysts’ expectations by 1.3%. More broadly, it was a softer quarter as it logged a significant miss of analysts’ EPS estimates.
The stock is up 3.7% since reporting and currently trades at $52.80.
Read our full, actionable report on Equitable Holdings here, it’s free.
Market Update
The Fed’s interest rate hikes throughout 2022 and 2023 have successfully cooled post-pandemic inflation, bringing it closer to the 2% target. Inflationary pressures have eased without tipping the economy into a recession, suggesting a soft landing. This stability, paired with recent rate cuts (0.5% in September 2024 and 0.25% in November 2024), fueled a strong year for the stock market in 2024. The markets surged further after Donald Trump’s presidential victory in November, with major indices reaching record highs in the days following the election. Still, questions remain about the direction of economic policy, as potential tariffs and corporate tax changes add uncertainty for 2025.


As the Q2 earnings season wraps, let’s dig into this quarter’s best and worst performers in the life insurance industry, including CNO Financial Group and its peers.
Life insurance companies collect premiums from policyholders in exchange for providing a future death benefit or retirement income stream. Interest rates matter for the sector (and make it cyclical), with higher rates allowing insurers to reinvest their fixed-income portfolios at more attractive yields and vice versa. Additionally, favorable demographic shifts, such as an aging population, are driving strong demand for retirement products while AI and data analytics offer significant opportunities to improve underwriting accuracy and operational efficiency. Conversely, the industry faces headwinds from persistent competition from agile insurtechs that threaten traditional distribution models.
The 15 life insurance stocks we track reported a slower Q2. As a group, revenues beat analysts’ consensus estimates by 0.8%.
Thankfully, share prices of the companies have been resilient as they are up 5.9% on average since the latest earnings results.
Rebranded from Conseco in 2010 to signal a fresh start after navigating financial challenges, CNO Financial Group develops and markets health insurance, annuities, and life insurance products primarily targeting middle-income pre-retirees and retirees.
CNO Financial Group reported revenues of $954.9 million, up 1.6% year on year. This print fell short of analysts’ expectations by 0.7%. Overall, it was a softer quarter for the company with a significant miss of analysts’ book value per share estimates and a narrow beat of analysts’ EPS estimates.
"Building on our strong second quarter and first half results, CNO remains on track to achieve our full-year 2025-2027 return on equity targets," said Gary C. Bhojwani, chief executive officer.
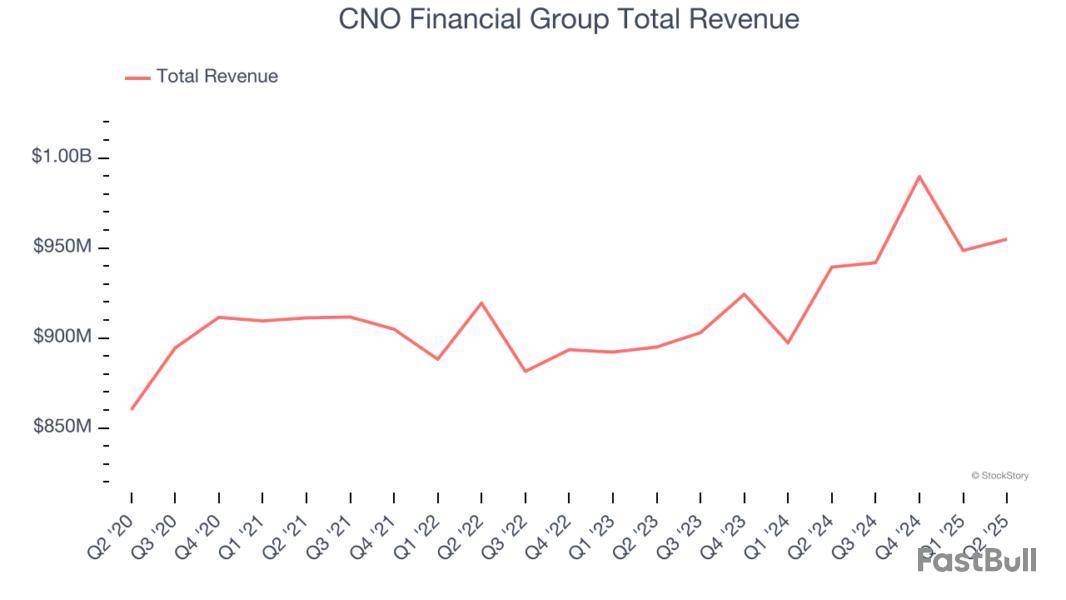
Interestingly, the stock is up 5.3% since reporting and currently trades at $39.62.
Read our full report on CNO Financial Group here, it’s free.
Spun off from insurance giant AIG in 2022 to focus on the growing retirement market, Corebridge Financial provides retirement solutions, annuities, life insurance, and institutional risk management products in the United States.
Corebridge Financial reported revenues of $4.43 billion, up 6.1% year on year, outperforming analysts’ expectations by 7.6%. The business had a stunning quarter with a beat of analysts’ EPS estimates.
However, the results were likely priced into the stock as it’s traded sideways since reporting. Shares currently sit at $34.97.
Is now the time to buy Corebridge Financial? Access our full analysis of the earnings results here, it’s free.
Weakest Q2: Brighthouse Financial
Spun off from MetLife in 2017 to focus specifically on retail financial products, Brighthouse Financial provides annuity contracts and life insurance products designed to help individuals protect wealth, generate income, and transfer assets.
Brighthouse Financial reported revenues of $2.15 billion, down 2.9% year on year, falling short of analysts’ expectations by 1.3%. It was a disappointing quarter as it posted a significant miss of analysts’ net premiums earned estimates and a significant miss of analysts’ EPS estimates.
Interestingly, the stock is up 1.4% since the results and currently trades at $46.82.
Read our full analysis of Brighthouse Financial’s results here.
Recognized by its iconic Rock of Gibraltar logo symbolizing strength and stability since 1896, Prudential Financial provides life insurance, annuities, retirement solutions, investment management, and other financial services to individual and institutional customers globally.
Prudential reported revenues of $13.51 billion, down 2.5% year on year. This result lagged analysts' expectations by 1%. Aside from that, it was a mixed quarter as it also recorded a solid beat of analysts’ net premiums earned estimates but a significant miss of analysts’ book value per share estimates.
The stock is up 7.3% since reporting and currently trades at $109.30.
Read our full, actionable report on Prudential here, it’s free.
Founded in 1879 by a Civil War veteran seeking to provide financial security for families, Principal Financial Group (NASDAQGS:PFG) provides retirement solutions, asset management, and employee benefits to businesses, individuals, and institutional clients globally.
Principal Financial Group reported revenues of $3.69 billion, down 9.4% year on year. This number missed analysts’ expectations by 7%. Overall, it was a softer quarter as it also produced a significant miss of analysts’ net premiums earned estimates and a significant miss of analysts’ book value per share estimates.
Principal Financial Group had the weakest performance against analyst estimates and slowest revenue growth among its peers. The stock is flat since reporting and currently trades at $80.72.
Read our full, actionable report on Principal Financial Group here, it’s free.
Market Update
The Fed’s interest rate hikes throughout 2022 and 2023 have successfully cooled post-pandemic inflation, bringing it closer to the 2% target. Inflationary pressures have eased without tipping the economy into a recession, suggesting a soft landing. This stability, paired with recent rate cuts (0.5% in September 2024 and 0.25% in November 2024), fueled a strong year for the stock market in 2024. The markets surged further after Donald Trump’s presidential victory in November, with major indices reaching record highs in the days following the election. Still, questions remain about the direction of economic policy, as potential tariffs and corporate tax changes add uncertainty for 2025.
728 RM B 7/F GEE LOK IND BLDG NO 34 HUNG TO RD KWUN TONG KLN HONG KONG


White Label
Data API
Web Plug-ins
Poster Maker
Affiliate Program
The risk of loss in trading financial instruments such as stocks, FX, commodities, futures, bonds, ETFs and crypto can be substantial. You may sustain a total loss of the funds that you deposit with your broker. Therefore, you should carefully consider whether such trading is suitable for you in light of your circumstances and financial resources.
No decision to invest should be made without thoroughly conducting due diligence by yourself or consulting with your financial advisors. Our web content might not suit you since we don't know your financial conditions and investment needs. Our financial information might have latency or contain inaccuracy, so you should be fully responsible for any of your trading and investment decisions. The company will not be responsible for your capital loss.
Without getting permission from the website, you are not allowed to copy the website's graphics, texts, or trademarks. Intellectual property rights in the content or data incorporated into this website belong to its providers and exchange merchants.
Not Logged In
Log in to access more features

FastBull Membership
Not yet
Purchase


Log In
Sign Up


