• Trade
  • Markets
  • Copy
  • Contests
  • 24/7
  • Calendar
  • Q&A
  • Chats
Screeners
SYMBOL
LAST
BID
ASK
HIGH
LOW
NET CHG.
%CHG.
SPREAD
SOURCE
SPX
S&P 500 Index
7175.83
7175.83
7175.83
7415.64
7173.63
-147.80
-2.02%
--
--
DJI
Dow Jones Industrial Average
49097.06
49097.06
49097.06
50454.81
49091.92
-1101.11
-2.19%
--
--
IXIC
NASDAQ Composite Index
23879.21
23879.21
23879.21
24939.62
23870.70
-550.67
-2.25%
--
--
USDX
US Dollar Index
103.638
103.638
103.718
103.852
103.610
-0.199
-0.19%
--
--
EURUSD
Euro / US Dollar
1.09858
1.09858
1.09866
1.09886
1.09610
+0.00203
+ 0.19%
--
--
GBPUSD
Pound Sterling / US Dollar
1.31168
1.31168
1.31180
1.31198
1.30780
+0.00319
+ 0.24%
--
--
XAUUSD
Gold / US Dollar
3551.32
3551.32
3551.75
3636.65
3514.30
-74.74
-2.06%
--
--
WTI
Light Sweet Crude Oil
82.759
82.759
82.789
83.097
82.229
-0.283
-0.34%
--
--

Community Accounts

Signal Accounts
--
Profit Accounts
--
Loss Accounts
--
View More

Become a signal provider

Sell trading signals to earn additional income

View More

Guide to Copy Trading

Get started with ease and confidence

View More

Signal Accounts for Members

All Signal Accounts

Best Return
  • Best Return
  • Best P/L
  • Best MDD
Past 1W
  • Past 1W
  • Past 1M
  • Past 1Y

All Contests

  • All
  • Recommend
  • Stocks
  • Cryptocurrencies
  • Central Banks
  • Trump Updates
  • Featured News
Top News Only
Share

Central Bank Of Turkey: Turkey's Net External Debt Stock Was $206.73 Billion At The End Of The Third Quarter

Share

UK Office For National Statistics: UK Supermarket Sales Strengthened In October After The Government Advised Buying Durable Goods

Share

According To AmSpec, An Independent Inspection Agency In Malaysia, Malaysia's Palm Oil Exports From November 1 To 20 Totaled 973,805 Tons, A Decrease Of 10.24% Compared To 1,084,928 Tons In The Same Period Last Month

Share

Ding Xuexiang Will Visit Singapore And Chair A Meeting Of The China-Singapore Bilateral Cooperation Mechanism

Share

Viewpoint: Current Short-term Bitcoin Holders Are Realizing An Average Loss Of About 15%, And The SOPR Indicator Is Signaling An Entry Point

Share

Polish Prime Minister Tusk: I Have Received Reports From The Ministers Regarding The Entry Into Polish Airspace; There Is No Threat From The Air

Share

Russian Deputy Foreign Minister Ryabkov Stated That NATO's Granting Of "quasi-member" Status To Ukraine Is Unacceptable

Share

Russian Foreign Ministry: No Agreement Reached On The Next Round Of Ukraine Talks

Share

Russian Foreign Ministry: Preparations Are Underway For A Visit By EU Representatives

Share

Sri Lanka Central Bank Governor: There Are Many Policies That Affect Economic Growth, Not Just Monetary Policy

Share

The Commander Of The Ukrainian Drone Force Stated That In The Past 50 Days, Ukrainian Drone Forces Have Struck 41 Russian Oil Refineries And Weapons Production Facilities

Share

Sri Lanka Central Bank Governor: A Buffer Mechanism Will Be Established To Cope With Headwinds

Share

Sri Lanka Central Bank Governor: Hope To See The Impact Of The Current Global Oil Price Decline

Share

Hungarian Finance Minister Kármán Stated That A New Medium-term Agreement Is Being Developed To Ensure That Nominal Wages Are Aligned With Economic Performance

Share

Sri Lanka Central Bank Governor: Even With Fuel Subsidies, Inflation Remains Higher Than Expected

Share

Sri Lanka Central Bank Governor: Once Inflation Enters A Downward Trend, The Central Bank Will Return To An Easing Policy

Share

The Governor Of The Central Bank Of Sri Lanka Said That The Reserve Requirement Ratio Will Be Used To Absorb About 150 Billion Rupees Flowing Back To The Central Bank

Share

Sri Lanka Central Bank Governor: Reserve Requirement Ratio Will Help Maintain Short-term Interest Rates

Share

The Governor Of The Central Bank Of Sri Lanka Said He Hopes To Bring The Inflation Rate Down To The Target Level Of 5% As Soon As Possible

Share

Tanker Shipping Company Frontline: The Current Supply Disruptions Will Have A Lasting Impact On Crude Oil Purchasing Patterns, With Asian Buyers Maintaining A Diversified Supply Base And Holding Larger Inventories

TIME
ACT
FCST
PREV
IMPACT
Canada Industrial Product Price Index YoY (Oct)

A:--

F: --

P: --
USDCAD
  • USDCAD
  • XAUUSD
  • XAGUSD
  • WTI
  • USDX
U.S. Philadelphia Fed Business Activity Index (SA) (Nov)

A:--

F: --

P: --

USDX
  • USDX
  • XAUUSD
  • XAGUSD
  • WTI
U.S. Initial Jobless Claims 4-Week Avg. (SA)

A:--

F: --

P: --
XAUUSD
  • XAUUSD
  • XAGUSD
  • WTI
  • USDX
U.S. Weekly Continued Jobless Claims (SA)

A:--

F: --

P: --
XAUUSD
  • XAUUSD
  • XAGUSD
  • WTI
  • USDX
U.S. Philadelphia Fed Manufacturing Employment Index (Nov)

A:--

F: --

P: --

USDX
  • USDX
  • XAUUSD
  • XAGUSD
  • WTI
ECB President Lagarde Speaks
FOMC Member Hammack Speaks
U.S. Conference Board Leading Economic Index MoM (Oct)

A:--

F: --

P: --

USDX
  • USDX
  • XAUUSD
  • XAGUSD
  • WTI
U.S. Conference Board Lagging Economic Index MoM (Oct)

A:--

F: --

P: --

USDX
  • USDX
  • XAUUSD
  • XAGUSD
  • WTI
U.S. Conference Board Coincident Economic Index MoM (Oct)

A:--

F: --

P: --

USDX
  • USDX
  • XAUUSD
  • XAGUSD
  • WTI
U.S. Conference Board Leading Economic Index (Oct)

A:--

F: --

P: --

USDX
  • USDX
  • XAUUSD
  • XAGUSD
  • WTI
U.S. EIA Weekly Natural Gas Stocks Change

A:--

F: --

P: --

WTI
  • WTI
  • XAUUSD
  • XAGUSD
  • USDX
U.S. Kansas Fed Manufacturing Production Index (Nov)

A:--

F: --

P: --

USDX
  • USDX
  • XAUUSD
  • XAGUSD
  • WTI
U.S. Kansas Fed Manufacturing Composite Index (Nov)

A:--

F: --

P: --

USDX
  • USDX
  • XAUUSD
  • XAGUSD
  • WTI
U.S. 10-Year TIPS Auction Avg. Yield

A:--

F: --

P: --

XAUUSD
  • XAUUSD
  • XAGUSD
  • WTI
  • USDX
Argentina Trade Balance (Oct)

A:--

F: --

P: --

XAUUSD
  • XAUUSD
  • XAGUSD
  • WTI
  • USDX
Richmond Federal Reserve President Barkin delivered a speech.
South Korea PPI MoM (Oct)

A:--

F: --

P: --
XAUUSD
  • XAUUSD
  • XAGUSD
  • WTI
  • USDX
Richmond Federal Reserve President Barkin delivered a speech.
U.S. Weekly Treasuries Held by Foreign Central Banks

A:--

F: --

P: --

USDX
  • USDX
  • XAUUSD
  • XAGUSD
  • WTI
Japan National CPI MoM (Oct)

A:--

F: --

P: --

USDJPY
  • USDJPY
  • XAUUSD
  • XAGUSD
  • WTI
Japan National CPI MoM (Not SA) (Oct)

A:--

F: --

P: --

USDJPY
  • USDJPY
  • XAUUSD
  • XAGUSD
  • WTI
Japan National Core CPI YoY (Oct)

A:--

F: --

P: --

USDJPY
  • USDJPY
  • XAUUSD
  • XAGUSD
  • WTI
Japan National CPI YoY (Oct)

A:--

F: --

P: --

USDJPY
  • USDJPY
  • XAUUSD
  • XAGUSD
  • WTI
Philadelphia Fed President Henry Paulson delivers a speech
U.K. GfK Consumer Confidence Index (Nov)

A:--

F: --

P: --

GBPUSD
  • GBPUSD
  • XAUUSD
  • XAGUSD
  • WTI
China, Mainland 5-Year Loan Prime Rate

A:--

F: --

P: --

XAUUSD
  • XAUUSD
  • XAGUSD
  • WTI
  • USDX
China, Mainland 1-Year Loan Prime Rate (LPR)

A:--

F: --

P: --

XAUUSD
  • XAUUSD
  • XAGUSD
  • WTI
  • USDX
Turkey Capacity Utilization (Nov)

A:--

F: --

P: --

XAUUSD
  • XAUUSD
  • XAGUSD
  • WTI
  • USDX
Turkey Consumer Confidence Index (Nov)

A:--

F: --

P: --

XAUUSD
  • XAUUSD
  • XAGUSD
  • WTI
  • USDX
Germany PPI MoM (Oct)

A:--

F: --

P: --

EURUSD
  • EURUSD
  • XAUUSD
  • XAGUSD
  • WTI
  • USDX
Germany PPI YoY (Oct)

A:--

F: --

P: --

EURUSD
  • EURUSD
  • XAUUSD
  • XAGUSD
  • WTI
  • USDX
U.K. Core Retail Sales YoY (SA) (Oct)

A:--

F: --

P: --
GBPUSD
  • GBPUSD
  • XAUUSD
  • XAGUSD
  • WTI
  • USDX
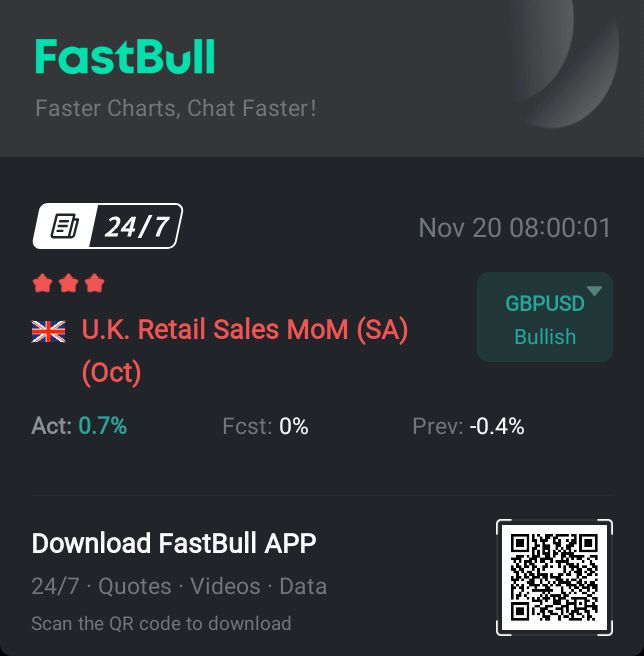
U.K. Retail Sales MoM (SA) (Oct)

A:--

F: --

P: --
GBPUSD
  • GBPUSD
  • XAUUSD
  • XAGUSD
  • WTI
  • USDX
U.K. Retail Sales YoY (SA) (Oct)

A:--

F: --

P: --
GBPUSD
  • GBPUSD
  • XAUUSD
  • XAGUSD
  • WTI
  • USDX
ECB President Lagarde Speaks
India Industrial Production Index YoY (Oct)

--

F: --

P: --

Mexico Retail Sales MoM (Sept)

--

F: --

P: --

Canada Core Retail Sales MoM (SA) (Sept)

--

F: --

P: --

Canada Retail Sales MoM (SA) (Sept)

--

F: --

P: --

U.S. UMich Current Economic Conditions Index Final (Nov)

--

F: --

P: --

U.S. UMich 1-Year-Ahead Inflation Expectations Final (Nov)

--

F: --

P: --

U.S. UMich Consumer Expectations Index Final (Nov)

--

F: --

P: --

U.S. UMich Consumer Sentiment Index Final (Nov)

--

F: --

P: --

Euro Zone Consumer Confidence Index Prelim (Nov)

--

F: --

P: --

U.S. Weekly Total Oil Rig Count

--

F: --

P: --

U.S. Weekly Total Rig Count

--

F: --

P: --

Australia Composite PMI Prelim (Nov)

--

F: --

P: --

Australia Manufacturing PMI Prelim (Nov)

--

F: --

P: --

France Services PMI Prelim (SA) (Nov)

--

F: --

P: --

France Manufacturing PMI Prelim (Nov)

--

F: --

P: --

France Composite PMI Prelim (SA) (Nov)

--

F: --

P: --

Germany Composite PMI Prelim (SA) (Nov)

--

F: --

P: --

Germany Services PMI Prelim (SA) (Nov)

--

F: --

P: --

Germany Manufacturing PMI Prelim (SA) (Nov)

--

F: --

P: --

Euro Zone Composite PMI Prelim (SA) (Nov)

--

F: --

P: --

Euro Zone Services PMI Prelim (SA) (Nov)

--

F: --

P: --

Euro Zone Manufacturing PMI Prelim (SA) (Nov)

--

F: --

P: --

U.K. Composite PMI Prelim (Nov)

--

F: --

P: --

Q&A with Experts
    • All
    • Chatrooms
    • Groups
    • Friends
    Size flag
    6088176
    What level of gold do you think could be a good starting point for a long‑term purchase?
    With $3,250 as a deeper zone to keep in mind if selling pressure continues.@Visitor6088176
    Skylark flag
    6088176
    What level of gold do you think could be a good starting point for a long‑term purchase?
    Gold is currently trading near $3,560 after falling from $5,600, so buying near $3,500 would mean you are entering close to the bottom of this long correction phase right now. @Visitor6088176
    Size flag
    6088176
    What level of gold do you think could be a good starting point for a long‑term purchase?
    Gold has been under significant pressure from dollar strength and expectations of further Fed tightening@Visitor6088176
    Skylark flag
    6088176
    What level of gold do you think could be a good starting point for a long‑term purchase?
    I would not put all your money in at one level, but rather split your purchase into three parts around $3,500, $3,400 and $3,300 to reduce your average entry price. @Visitor6088176
    Size flag
    6088176
    What level of gold do you think could be a good starting point for a long‑term purchase?
    I wouldn't rush into buying just because price is falling, though@Visitor6088176
    Skylark flag
    Skylark flag
    6088176
    What level of gold do you think could be a good starting point for a long‑term purchase?
    The long term story is still strong because central banks keep buying gold, inflation remains a risk, and the Fed is expected to cut rates in late 2027 for support. @Visitor6088176
    SlowBear ⛅ flag
    Qw
    goldd any ideaa
    @Qwhi mate, how are you doing, i hope you are doing good
    Skylark flag
    6088176
    What level of gold do you think could be a good starting point for a long‑term purchase?
    Analysts like Goldman Sachs still see gold reaching around $4,650 by end of 2027 and $5,600 by end of 2028, which makes $3,500 look like a good value zone today.@Visitor6088176
    Size flag
    6088176
    What level of gold do you think could be a good starting point for a long‑term purchase?
    I'd prefer to see weekly stabilization and a clear shift in market structure before building a long-term position.@Visitor6088176
    "Size" recalled a message
    Skylark flag
    6088176
    What level of gold do you think could be a good starting point for a long‑term purchase?
    If price breaks strongly below $3,500 on a weekly close, then do not panic, because the next support is near $3,300 and that would be an even better buying chance. @Visitor6088176
    Size flag
    Qw
    goldd any ideaa
    @QwHey mate, how are you doing today? welcome here..
    Skylark flag
    6088176
    What level of gold do you think could be a good starting point for a long‑term purchase?
    Just remember this is not financial advice, so always do your own research, buy from trusted sources, and only invest money you can afford to hold long term without panic.@Visitor6088176
    Size flag
    Qw
    goldd any ideaa
    @QwGold is still showing strong selling pressure.
    Size flag
    Qw
    goldd any ideaa
    I'm more interested in seeing how price reacts around the 3,518–3,500 support zone before considering any longs@Qw
    Skylark flag
    Qw
    goldd any ideaa
    @QwHello mate how are you doing today hope you're doing great welcome?
    Sanjeev Ku flag
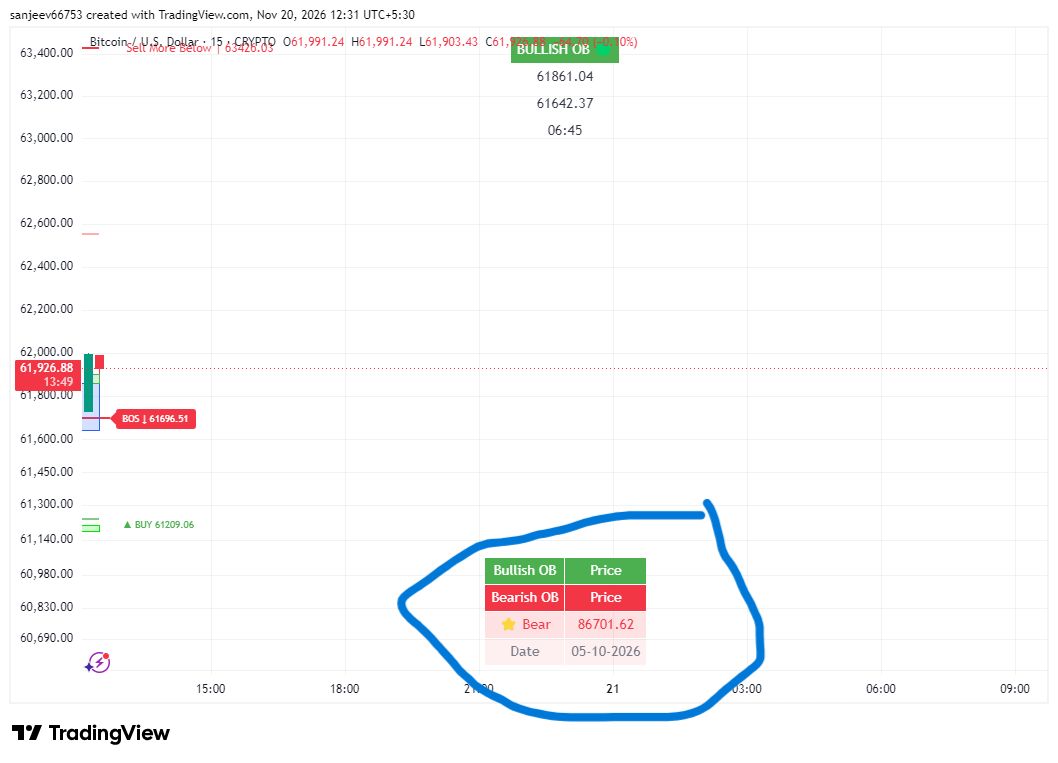
    power of institutions. date 05/10 2026. selling started btc at 86701. today 20/11/2026 price 62k . 24000 points in one month .disclaimer me and my clients holding sell from here haha
    Sanjeev Ku flag
    Skylark flag
    Qw
    goldd any ideaa
    @QwGold is showing strong bearish pressure the bears are still having an upper hand in the market
    Type here...
    Add Symbol or Code

      No matching data

      All
      Recommend
      Stocks
      Cryptocurrencies
      Central Banks
      Trump Updates
      Featured News
      • All
      • Russia-Ukraine Conflict
      • Middle East Flashpoint
      • All
      • Russia-Ukraine Conflict
      • Middle East Flashpoint
      Search
      Products

      Charts Free Forever

      Chats Q&A with Experts
      Screeners Economic Calendar Data Tools
      Membership Features
      Data Warehouse Market Trends Institutional Data Policy Rates Macro

      Market Trends

      Market Sentiment Order Book Forex Correlations

      Top Indicators

      Charts Free Forever
      Markets

      News

      24/7 Analysis Education

      Latest Views

      Latest Update

      Signals

      Copy Rankings Latest Signals Become a signal provider AI Rating
      Contests
      Brokers

      Overview Brokers Assessment Rankings Regulators News Claims
      Broker listing Forex Brokers Comparison Tool Live Spread Comparison Scam
      Q&A Complaint Scam Alert Videos Tips to Detect Scam
      More

      Business
      Events
      Careers About Us Advertising Help Center

      White Label

      Broker API

      Data API

      Web Plug-ins

      Affiliate Program

      Awards Institution Evaluation IB Seminar Salon Event Exhibition
      Vietnam Thailand Singapore Dubai
      Fans Party Investment Sharing Session
      FastBull Summit BrokersView Expo
      Recent Searches
        Top Searches
          Markets
          Analysis
          User
          24/7
          Economic Calendar
          Education
          Data
          • Names
          • Latest
          • Prev

          View All

          No data

          Scan to Download

          Faster Charts, Chat Faster!

          Download
          English
          • English
          • Español
          • العربية
          • Bahasa Indonesia
          • Bahasa Melayu
          • Tiếng Việt
          • ภาษาไทย
          • Français
          • Italiano
          • Türkçe
          • Русский язык
          • 简中
          • 繁中
          Open Account
          Search
          Products
          Charts Free Forever
          Markets
          News
          Signals

          Copy Rankings Latest Signals Become a signal provider AI Rating
          Contests
          Brokers

          Overview Brokers Assessment Rankings Regulators News Claims
          Broker listing Forex Brokers Comparison Tool Live Spread Comparison Scam
          Q&A Complaint Scam Alert Videos Tips to Detect Scam
          More

          Business
          Events
          Careers About Us Advertising Help Center

          White Label

          Broker API

          Data API

          Web Plug-ins

          Affiliate Program

          Awards Institution Evaluation IB Seminar Salon Event Exhibition
          Vietnam Thailand Singapore Dubai
          Fans Party Investment Sharing Session
          FastBull Summit BrokersView Expo

          When to Sell Stocks: Key Signs, Strategies, and When to Hold

          zhan chen
          Summary:

          Learn when to sell stocks for a profit or at a loss, how to evaluate stock valuations, when to hold investments, and how taxes affect selling decisions.

          Knowing when to sell stocks is just as important as knowing when to buy them. Investors may sell to lock in profits, limit losses, respond to changing company fundamentals, or rebalance a portfolio. The right decision depends on why you bought the stock, what has changed, and whether it still fits your financial goals.
          When to Sell Stocks: Key Signs, Strategies, and When to Hold_1

          When Should You Sell a Stock? Key Signs to Watch

          No single price or percentage gain tells every investor when to sell. Look instead at the company's performance, valuation, portfolio risk, and your financial needs.

          The Company's Fundamentals Have Deteriorated

          Consider selling when the business is no longer performing as expected. Persistent declines in revenue, profit margins, or cash flow, alongside rising debt, can signal deeper problems.

          A weakening competitive position, loss of market share, or an outdated business model can also damage long-term prospects.

          Ask whether your original investment thesis still holds. If expected earnings growth is no longer realistic, holding simply because the share price has fallen may not be sound.

          The Stock Is Overvalued

          A company can perform well while its stock becomes too expensive. If the share price rises much faster than earnings or realistic growth expectations, its valuation may be difficult to justify.

          The price-to-earnings (P/E) ratio can help you compare a stock with its history and peers. A high P/E alone is not a sell signal; faster-growing businesses may reasonably trade at higher valuations.

          A stock reaching an all-time high is not automatically a sell signal. Consider whether the price already reflects overly optimistic expectations and still offers an attractive risk-reward balance.

          Your Portfolio Has Become Unbalanced

          A strong-performing stock can become too large a part of your portfolio. If one company or industry accounts for much more than planned, concentration risk increases.

          Selling part of the position can restore your target allocation. Rebalancing does not mean you have lost confidence; the position may simply have grown beyond your intended risk level.

          Your Financial Goals Have Changed

          Your strategy should reflect your financial situation. If you are approaching retirement, preparing for a major expense, or need cash, selling some stocks may be appropriate even when the companies remain strong.

          Your time horizon matters, too. Money needed soon generally should not depend on a volatile stock; reducing exposure can help protect funds you cannot afford to risk in a downturn.

          When to Sell Stocks for a Profit

          Selling at a profit can be difficult. Selling too early may limit returns, while waiting too long can give back gains. A clear target can make the decision easier.

          How to Calculate a Stock's Target Selling Price

          Set a target return before buying a stock. Use this formula to estimate the price that would deliver it:

          Target Selling Price = Purchase Price × (1 + Target Return)

          For example, if you buy a stock at $50 per share and set a target return of 20%, the target selling price is:

          $50 × (1 + 0.20) = $60

          Reaching $60 is a reason to review the position, not an automatic sell signal. If the outlook and valuation remain attractive, holding may offer further upside. The calculation excludes costs, taxes, and dividends.

          You can also estimate value using earnings forecasts, growth expectations, and comparable companies. A business-based target is more useful than one based only on a percentage gain.

          Should You Sell All Your Shares or Take Partial Profits?

          You do not always need to sell an entire position. Taking partial profits secures some gains while preserving exposure to future growth.

          If a stock has become too large a portfolio holding, sell enough to restore your target allocation. A full exit may make more sense if the investment thesis has failed, the valuation is unjustifiable, or you need the money.

          Use a Trailing Stop to Protect Gains

          A trailing stop can help protect gains while allowing a stock to keep rising. It moves the sell trigger upward as the share price increases and triggers an order if the price falls by a preset amount or percentage. For example, a 10% trailing stop would set a trigger near $63 after a stock rises to $70.

          Trailing stops can also trigger during normal volatility, and execution may differ from the trigger price if the market moves quickly. Choose a distance that reflects the stock's volatility and your investment plan.

          Should You Sell Stocks at a Loss?

          A falling share price does not automatically mean you should sell. Determine whether the decline reflects temporary market conditions or a lasting change in the business.

          When a Falling Stock Is a Reason to Sell

          Consider selling when fundamentals weaken or your investment thesis changes materially—for example, after persistent earnings deterioration, the loss of a major customer, unsustainable debt, or serious competitive pressure.

          Reassess a position when its downside risk exceeds your tolerance. Holding only to avoid realizing a loss can tie up money better used elsewhere.

          When You Should Hold Instead of Selling at a Loss

          If a decline reflects short-term volatility and the business remains healthy, selling immediately may not be necessary. Market-wide declines or shifts in sentiment can lower a stock price without damaging the company.

          Check whether the original investment thesis still holds and whether the position fits your risk tolerance and time horizon. If so, holding may be reasonable.

          When Should You Hold Stocks Instead of Selling?

          Holding can be appropriate when the business remains strong, its valuation is reasonable, and the investment still serves your long-term plan.

          Short-Term Market Volatility Does Not Change the Long-Term Outlook

          Daily price swings and temporary corrections are not, by themselves, reasons to exit. If financial health and competitive position remain intact, reacting to every decline can lead to unnecessary trading and missed recoveries.

          The Company's Growth Potential Remains Strong

          A company with growing revenue and earnings, a competitive advantage, and effective reinvestment may still have room to expand. If its valuation reflects that potential and the stock fits your portfolio, there may be little reason to sell for a short-term gain.

          How to Decide When to Sell Stocks: A Practical Checklist

          For beginners, this checklist can make the decision more consistent. Before selling, review three questions:

          Review Your Original Investment Thesis

          Check why you bought the stock and whether those reasons still apply. Compare your expectations with recent results, company guidance, and major business developments.

          Compare the Stock's Current Valuation With Its Future Potential

          Compare the price with expected earnings, growth, and industry valuations. Ask whether the potential return still compensates you for the risk, rather than relying on your purchase price alone.

          Consider Your Risk Tolerance and Alternative Investments

          Check the position size, your time horizon, and when you need the money. Selling is easier to justify when proceeds support a clear plan, such as reducing concentration risk or funding a goal, rather than chasing another stock.

          How Do Taxes Affect When You Sell Stocks?

          Taxes affect how much of a gain you keep. For U.S. investors selling stocks in taxable brokerage accounts, the holding period and treatment of losses can change the result.

          Short-Term vs. Long-Term Capital Gains Tax

          The IRS generally classifies a stock gain as short-term or long-term based on how long you owned the shares:

          • Short-term capital gains: Gains on stocks held for one year or less. They are generally taxed at ordinary income tax rates.
          • Long-term capital gains: Gains on stocks held for more than one year. They generally qualify for federal rates of 0%, 15%, or 20%, depending on taxable income and filing status.

          Selling after 11 months generally produces a short-term gain; selling after more than one year generally produces a long-term gain. State taxes and the net investment income tax may also apply.

          Consider taxes before selling, but do not keep an overvalued or unsuitable stock solely to qualify for a lower rate.

          Tax-Loss Harvesting and the Wash-Sale Rule

          Tax-loss harvesting means selling an investment at a loss to offset capital gains. If net capital losses exceed gains, individuals can generally deduct up to $3,000 against ordinary income each year ($1,500 if married filing separately); unused losses can generally be carried forward.

          The wash-sale rule can prevent an immediate loss deduction. Generally, a loss is disallowed if you buy the same or substantially identical stock or securities within 30 days before or after selling at a loss. Certain contracts, options, and IRA or Roth IRA purchases can also trigger the rule.

          For a replacement purchase in a taxable account, the disallowed loss is generally added to the new shares' cost basis. IRA and Roth IRA purchases have different treatment. See the IRS Publication 550 and Topic No. 409: Capital Gains and Losses.

          Taxes should inform, not replace, your investment decision. A tax benefit does not make an unsuitable stock worth holding.

          Risk Warnings and Disclaimers
          You understand and acknowledge that there is a high degree of risk involved in trading. Following any strategies or investment methods may lead to potential losses. The content on the site is provided by our contributors and analysts for information purposes only. You are solely responsible for determining whether any trading assets, securities, strategy, or any other product is suitable for investing based on your own investment objectives and financial situation.
          Add to Favorites
          Share
          FastBull
          Copyright © 2026 FastBull Ltd

          728 RM B 7/F GEE LOK IND BLDG NO 34 HUNG TO RD KWUN TONG KLN HONG KONG

          TelegramInstagramTwitterfacebooklinkedin
          App Store Google Play Android Windows
          Products
          Charts

          Chats

          Q&A with Experts
          Screeners
          Economic Calendar
          Data
          Tools
          Membership
          Features
          Function
          Markets
          Copy Trading
          Latest Signals
          Contests
          24/7
          Analysis
          Education
          Company
          Careers
          About Us
          Contact Us
          Advertising
          Download FastBull
          Help Center
          Feedback
          User Agreement
          Privacy Policy
          Personal Information Protection Statement
          Business

          White Label

          Broker API

          Data API

          Web Plug-ins

          Poster Maker

          Affiliate Program

          Risk Disclosure

          The risk of loss in trading financial instruments such as stocks, FX, commodities, futures, bonds, ETFs and crypto can be substantial. You may sustain a total loss of the funds that you deposit with your broker. Therefore, you should carefully consider whether such trading is suitable for you in light of your circumstances and financial resources.

          No decision to invest should be made without thoroughly conducting due diligence by yourself or consulting with your financial advisors. Our web content might not suit you since we don't know your financial conditions and investment needs. Our financial information might have latency or contain inaccuracy, so you should be fully responsible for any of your trading and investment decisions. The company will not be responsible for your capital loss.

          Without getting permission from the website, you are not allowed to copy the website's graphics, texts, or trademarks. Intellectual property rights in the content or data incorporated into this website belong to its providers and exchange merchants.

          Not Logged In

          Log in to access more features

          Connect Broker
          Become a signal provider
          Help Center
          Customer Service
          Dark Mode
          Price Up/Down Colors

          Log In

          Sign Up

          Position
          Layout
          Fullscreen
          Default to Chart
          The chart page opens by default when you visit fastbull.com