

Markets
News
Analysis
User
24/7
Economic Calendar
Education
Data
- Names
- Latest
- Prev


Signal Accounts for Members
All Signal Accounts
All Contests
The Hang Seng Index Opened 0.82% Lower, And The Hang Seng Tech Index Fell 1.31%. Bilibili Fell More Than 4%, Tencent Music And Hua Hong Semiconductor Fell More Than 3%, And Alibaba, Kuaishou, SMIC, Meituan And Others Fell More Than 2%. Baidu Rose More Than 2% After Authorizing A Share Repurchase Program With A Total Amount Not Exceeding US$5 Billion And Expects To Announce Its First Dividend In 2026
China Central Bank Injects 118.5 Billion Yuan Via 7-Day Reverse Repos At 1.40% Versus Prior 1.40%
Taiwan Overnight Interbank Rate Opens At 0.805 Percent (Versus 0.805 Percent At Previous Session Open)
[CITIC Securities: Current US Financial Market Environment Does Not Favor Balance Sheet Reduction] CITIC Securities Points Out That Although Warsh Repeatedly Mentioned The Policy Direction Of Interest Rate Cuts And Balance Sheet Reduction In 2025, Considering That The Liquidity Pressure In The US Money Market Only Significantly Eased In January, The Current Reserve-to-GDP Ratio Is Still Around 10%, And The Fed's Assets Held As A Percentage Of GDP Are Around 20%, Approaching The Pre-pandemic Level Of 2018, Indicating Limited Overall Reserve Adequacy. If Warsh Becomes The Next Fed Chairman, And If He Quickly Initiates Balance Sheet Reduction After Taking Office, The US Money Market May Face Liquidity Pressure Again. Therefore, Overall, CITIC Securities Believes That The Current US Financial Market Environment Does Not Favor Balance Sheet Reduction
UN Secretary General Guterres: Dissolution Of New Start Could Not Come At A Worse Time, With Risk Of Nuclear Weapon Use At Highest In Decades
 U.K. Composite PMI Final (Jan)
A:--
F: --
P: --
U.K. Total Reserve Assets (Jan)A:--
F: --
P: --
U.K. Services PMI Final (Jan)A:--
F: --
P: --
 Euro Zone Core CPI Prelim YoY (Jan)
A:--
F: --
P: --
Euro Zone Core HICP Prelim YoY (Jan)A:--
F: --
P: --
Euro Zone HICP Prelim YoY (Jan)A:--
F: --
P: --
Euro Zone PPI MoM (Dec)A:--
F: --
Euro Zone Core HICP Prelim MoM (Jan)A:--
F: --
P: --
 Italy HICP Prelim YoY (Jan)
A:--
F: --
P: --
Euro Zone Core CPI Prelim MoM (Jan)A:--
F: --
P: --
Euro Zone PPI YoY (Dec)A:--
F: --
 U.S. MBA Mortgage Application Activity Index WoW
A:--
F: --
P: --
 Brazil IHS Markit Composite PMI (Jan)
A:--
F: --
P: --
Brazil IHS Markit Services PMI (Jan)A:--
F: --
P: --
U.S. ADP Employment (Jan)A:--
F: --
The U.S. Treasury Department released its quarterly refinancing statement. U.S. IHS Markit Composite PMI Final (Jan)A:--
F: --
P: --
U.S. IHS Markit Services PMI Final (Jan)A:--
F: --
P: --
U.S. ISM Non-Manufacturing Price Index (Jan)A:--
F: --
P: --
U.S. ISM Non-Manufacturing Employment Index (Jan)A:--
F: --
P: --
U.S. ISM Non-Manufacturing New Orders Index (Jan)A:--
F: --
P: --
U.S. ISM Non-Manufacturing Inventories Index (Jan)A:--
F: --
P: --
U.S. ISM Non-Manufacturing PMI (Jan)A:--
F: --
P: --
U.S. EIA Weekly Crude Oil Imports ChangesA:--
F: --
P: --
U.S. EIA Weekly Heating Oil Stock ChangesA:--
F: --
P: --
U.S. EIA Weekly Crude Demand Projected by ProductionA:--
F: --
P: --
U.S. EIA Weekly Gasoline Stocks ChangeA:--
F: --
P: --
U.S. EIA Weekly Crude Stocks ChangeA:--
F: --
P: --
U.S. EIA Weekly Cushing, Oklahoma Crude Oil Stocks ChangeA:--
F: --
P: --
 Australia Trade Balance (SA) (Dec)
A:--
F: --
P: --
Australia Exports MoM (SA) (Dec)A:--
F: --
P: --
 Japan 30-Year JGB Auction Yield
--
F: --
P: --
 Indonesia Annual GDP Growth
--
F: --
P: --
Indonesia GDP YoY (Q4)--
F: --
P: --
 France Industrial Output MoM (SA) (Dec)
--
F: --
P: --
Italy IHS Markit Construction PMI (Jan)--
F: --
P: --
Euro Zone IHS Markit Construction PMI (Jan)--
F: --
P: --
 Germany Construction PMI (SA) (Jan)
--
F: --
P: --
Italy Retail Sales MoM (SA) (Dec)--
F: --
P: --
U.K. Markit/CIPS Construction PMI (Jan)--
F: --
P: --
France 10-Year OAT Auction Avg. Yield--
F: --
P: --
Euro Zone Retail Sales YoY (Dec)--
F: --
P: --
Euro Zone Retail Sales MoM (Dec)--
F: --
P: --
U.K. BOE MPC Vote Cut (Feb)--
F: --
P: --
U.K. BOE MPC Vote Hike (Feb)--
F: --
P: --
U.K. BOE MPC Vote Unchanged (Feb)--
F: --
P: --
U.K. Benchmark Interest Rate--
F: --
P: --
MPC Rate Statement U.S. Challenger Job Cuts (Jan)--
F: --
P: --
U.S. Challenger Job Cuts MoM (Jan)--
F: --
P: --
U.S. Challenger Job Cuts YoY (Jan)--
F: --
P: --
Bank of England Governor Bailey held a press conference on monetary policy. Euro Zone ECB Marginal Lending Rate--
F: --
P: --
Euro Zone ECB Deposit Rate--
F: --
P: --
Euro Zone ECB Main Refinancing Rate--
F: --
P: --
ECB Monetary Policy Statement U.S. Weekly Initial Jobless Claims (SA)--
F: --
P: --
U.S. Initial Jobless Claims 4-Week Avg. (SA)--
F: --
P: --
U.S. Weekly Continued Jobless Claims (SA)--
F: --
P: --
ECB Press Conference


Aris Aris
ID: 9979627


No matching data
View All
No data
Household products company Reynolds will be reporting earnings this Wednesday before the bell. Here’s what to look for.
Reynolds beat analysts’ revenue expectations by 3.4% last quarter, reporting revenues of $931 million, up 2.3% year on year. It was a strong quarter for the company, with revenue guidance for next quarter exceeding analysts’ expectations and a solid beat of analysts’ organic revenue estimates.
Is Reynolds a buy or sell going into earnings? Read our full analysis here, it’s free for active Edge members.
This quarter, analysts are expecting Reynolds’s revenue to decline 1.5% year on year to $1.01 billion, a reversal from the 1.4% increase it recorded in the same quarter last year. Adjusted earnings are expected to come in at $0.59 per share.
Analysts covering the company have generally reconfirmed their estimates over the last 30 days, suggesting they anticipate the business to stay the course heading into earnings. Reynolds has only missed Wall Street’s revenue estimates once over the last two years, exceeding top-line expectations by 2.5% on average.
Looking at Reynolds’s peers in the household products segment, some have already reported their Q4 results, giving us a hint as to what we can expect. Colgate-Palmolive delivered year-on-year revenue growth of 5.8%, beating analysts’ expectations by 1.7%, and Procter & Gamble reported revenues up 1.5%, in line with consensus estimates. Colgate-Palmolive traded up 7.2% following the results while Procter & Gamble was also up 2.8%.
Read our full analysis of Colgate-Palmolive’s results here and Procter & Gamble’s results here.
There has been positive sentiment among investors in the household products segment, with share prices up 9.3% on average over the last month. Reynolds is up 2.3% during the same time and is heading into earnings with an average analyst price target of $26.86 (compared to the current share price of $23.09).


The end of the earnings season is always a good time to take a step back and see who shined (and who not so much). Let’s take a look at how household products stocks fared in Q3, starting with Central Garden & Pet .
Household products stocks are generally stable investments, as many of the industry's products are essential for a comfortable and functional living space. Recently, there's been a growing emphasis on eco-friendly and sustainable offerings, reflecting the evolving consumer preferences for environmentally conscious options. These trends can be double-edged swords that benefit companies who innovate quickly to take advantage of them and hurt companies that don't invest enough to meet consumers where they want to be with regards to trends.
The 10 household products stocks we track reported a satisfactory Q3. As a group, revenues beat analysts’ consensus estimates by 1.9% while next quarter’s revenue guidance was 1% above.
While some household products stocks have fared somewhat better than others, they have collectively declined. On average, share prices are down 3.2% since the latest earnings results.
Enhancing the lives of both pets and homeowners, Central Garden & Pet is a leading producer and distributor of essential products for pet care, lawn and garden maintenance, and pest control.
Central Garden & Pet reported revenues of $678.2 million, up 1.3% year on year. This print exceeded analysts’ expectations by 3.9%. Overall, it was an exceptional quarter for the company with a beat of analysts’ EPS and adjusted operating income estimates.
"This was a record year on the bottom line, marked by continued margin expansion and disciplined execution of our Cost and Simplicity agenda," said Niko Lahanas, CEO of Central Garden & Pet.
Interestingly, the stock is up 1.7% since reporting and currently trades at $31.97.
Founded in 1913 with bleach as the sole product offering, Clorox today is a consumer products giant whose product portfolio spans everything from bleach to skincare to salad dressing to kitty litter.
Clorox reported revenues of $1.43 billion, down 18.9% year on year, outperforming analysts’ expectations by 2%. The business had a strong quarter with a solid beat of analysts’ EBITDA estimates and a decent beat of analysts’ revenue estimates.
Although it had a fine quarter compared its peers, the market seems unhappy with the results as the stock is down 7.5% since reporting. It currently trades at $100.95.
Masterminds behind the viral Energizer Bunny mascot, Energizer is one of the world's largest manufacturers of batteries.
Energizer reported revenues of $832.8 million, up 3.4% year on year, exceeding analysts’ expectations by 0.8%. Still, it was a softer quarter as it posted EPS guidance for next quarter missing analysts’ expectations and a miss of analysts’ gross margin estimates.
As expected, the stock is down 16.3% since the results and currently trades at $19.97.
Read our full analysis of Energizer’s results here.
A leader in multiple consumer product categories, Spectrum Brands is a diversified company with a portfolio of trusted brands spanning home appliances, garden care, personal care, and pet care.
Spectrum Brands reported revenues of $733.5 million, down 5.2% year on year. This print missed analysts’ expectations by 1.1%. Zooming out, it was a mixed quarter as it also recorded a beat of analysts’ EPS estimates but a miss of analysts’ gross margin estimates.
Spectrum Brands had the weakest performance against analyst estimates among its peers. The stock is up 12.8% since reporting and currently trades at $60.04.
Read our full, actionable report on Spectrum Brands here, it’s free for active Edge members.
Best known for its aluminum foil, Reynolds is a household products company whose products focus on food storage, cooking, and waste.
Reynolds reported revenues of $931 million, up 2.3% year on year. This result surpassed analysts’ expectations by 3.4%. It was a strong quarter as it also logged revenue guidance for next quarter exceeding analysts’ expectations and an impressive beat of analysts’ organic revenue estimates.
The stock is down 2.7% since reporting and currently trades at $23.06.
Read our full, actionable report on Reynolds here, it’s free for active Edge members.

The end of the earnings season is always a good time to take a step back and see who shined (and who not so much). Let’s take a look at how household products stocks fared in Q3, starting with Church & Dwight .
Household products stocks are generally stable investments, as many of the industry's products are essential for a comfortable and functional living space. Recently, there's been a growing emphasis on eco-friendly and sustainable offerings, reflecting the evolving consumer preferences for environmentally conscious options. These trends can be double-edged swords that benefit companies who innovate quickly to take advantage of them and hurt companies that don't invest enough to meet consumers where they want to be with regards to trends.
The 10 household products stocks we track reported a satisfactory Q3. As a group, revenues beat analysts’ consensus estimates by 1.9% while next quarter’s revenue guidance was 1% above.
While some household products stocks have fared somewhat better than others, they have collectively declined. On average, share prices are down 2% since the latest earnings results.
Best known for its Arm & Hammer baking soda, Church & Dwight is a household and personal care products company with a vast portfolio that spans laundry detergent to toothbrushes to hair removal creams.
Church & Dwight reported revenues of $1.59 billion, up 5% year on year. This print exceeded analysts’ expectations by 3.3%. Overall, it was a strong quarter for the company with a solid beat of analysts’ EBITDA estimates and a solid beat of analysts’ revenue estimates.
Rick Dierker, Chief Executive Officer, commented, “In a challenging environment, we are pleased to deliver another quarter of strong results. We continue to drive both dollar and volume share gains across most of our brands. Our balanced portfolio of value and premium products and our relentless focus on innovation continue to position us well for the future. We also were encouraged with our first quarter of ownership of TOUCHLAND, as our results exceeded our initial expectations.
Church & Dwight scored the fastest revenue growth of the whole group. Unsurprisingly, the stock is up 4.3% since reporting and currently trades at $85.36.
Enhancing the lives of both pets and homeowners, Central Garden & Pet is a leading producer and distributor of essential products for pet care, lawn and garden maintenance, and pest control.
Central Garden & Pet reported revenues of $678.2 million, up 1.3% year on year, outperforming analysts’ expectations by 3.9%. The business had an exceptional quarter with a beat of analysts’ EPS estimates and an impressive beat of analysts’ adjusted operating income estimates.
The market seems content with the results as the stock is up 4% since reporting. It currently trades at $32.68.
Masterminds behind the viral Energizer Bunny mascot, Energizer is one of the world's largest manufacturers of batteries.
Energizer reported revenues of $832.8 million, up 3.4% year on year, exceeding analysts’ expectations by 0.8%. Still, it was a softer quarter as it posted EPS guidance for next quarter missing analysts’ expectations significantly and a miss of analysts’ gross margin estimates.
As expected, the stock is down 16.5% since the results and currently trades at $19.92.
Read our full analysis of Energizer’s results here.
Founded in 1913 with bleach as the sole product offering, Clorox today is a consumer products giant whose product portfolio spans everything from bleach to skincare to salad dressing to kitty litter.
Clorox reported revenues of $1.43 billion, down 18.9% year on year. This number topped analysts’ expectations by 2%. Overall, it was a strong quarter as it also produced an impressive beat of analysts’ EBITDA estimates and a decent beat of analysts’ revenue estimates.
Clorox had the slowest revenue growth among its peers. The stock is down 9.8% since reporting and currently trades at $98.47.
Read our full, actionable report on Clorox here, it’s free for active Edge members.
Best known for its aluminum foil, Reynolds is a household products company whose products focus on food storage, cooking, and waste.
Reynolds reported revenues of $931 million, up 2.3% year on year. This result beat analysts’ expectations by 3.4%. It was a strong quarter as it also logged revenue guidance for next quarter exceeding analysts’ expectations and a solid beat of analysts’ organic revenue estimates.
The stock is down 1.7% since reporting and currently trades at $23.29.
Read our full, actionable report on Reynolds here, it’s free for active Edge members.

As the Q3 earnings season comes to a close, it’s time to take stock of this quarter’s best and worst performers in the household products industry, including Reynolds and its peers.
Household products stocks are generally stable investments, as many of the industry's products are essential for a comfortable and functional living space. Recently, there's been a growing emphasis on eco-friendly and sustainable offerings, reflecting the evolving consumer preferences for environmentally conscious options. These trends can be double-edged swords that benefit companies who innovate quickly to take advantage of them and hurt companies that don't invest enough to meet consumers where they want to be with regards to trends.
The 10 household products stocks we track reported a satisfactory Q3. As a group, revenues beat analysts’ consensus estimates by 1.9% while next quarter’s revenue guidance was 1% above.
While some household products stocks have fared somewhat better than others, they have collectively declined. On average, share prices are down 1.5% since the latest earnings results.
Best known for its aluminum foil, Reynolds is a household products company whose products focus on food storage, cooking, and waste.
Reynolds reported revenues of $931 million, up 2.3% year on year. This print exceeded analysts’ expectations by 3.4%. Overall, it was a strong quarter for the company with revenue guidance for next quarter exceeding analysts’ expectations and an impressive beat of analysts’ organic revenue estimates.
“Our people, brands and products are winning in a challenging environment, with all four business units delivering improved results driven by share gains in the majority of our categories,” said Scott Huckins, President and Chief Executive Officer.
Interestingly, the stock is up 2.1% since reporting and currently trades at $24.18.
Enhancing the lives of both pets and homeowners, Central Garden & Pet is a leading producer and distributor of essential products for pet care, lawn and garden maintenance, and pest control.
Central Garden & Pet reported revenues of $678.2 million, up 1.3% year on year, outperforming analysts’ expectations by 3.9%. The business had an exceptional quarter with a beat of analysts’ EPS estimates and an impressive beat of analysts’ adjusted operating income estimates.
The market seems content with the results as the stock is up 3.9% since reporting. It currently trades at $32.65.
Masterminds behind the viral Energizer Bunny mascot, Energizer is one of the world's largest manufacturers of batteries.
Energizer reported revenues of $832.8 million, up 3.4% year on year, exceeding analysts’ expectations by 0.8%. Still, it was a softer quarter as it posted EPS guidance for next quarter missing analysts’ expectations significantly and a miss of analysts’ gross margin estimates.
As expected, the stock is down 15.3% since the results and currently trades at $20.20.
Read our full analysis of Energizer’s results here.
Originally founded as a Wisconsin paper mill in 1872, Kimberly-Clark (NYSE:KMB) is now a household products powerhouse known for personal care and tissue products.
Kimberly-Clark reported revenues of $4.15 billion, flat year on year. This print met analysts’ expectations. Aside from that, it was a satisfactory quarter as it also produced a decent beat of analysts’ EBITDA estimates but gross margin in line with analysts’ estimates.
The stock is down 13% since reporting and currently trades at $101.50.
Read our full, actionable report on Kimberly-Clark here, it’s free for active Edge members.
Founded in 1913 with bleach as the sole product offering, Clorox today is a consumer products giant whose product portfolio spans everything from bleach to skincare to salad dressing to kitty litter.
Clorox reported revenues of $1.43 billion, down 18.9% year on year. This result topped analysts’ expectations by 2%. Overall, it was a strong quarter as it also logged an impressive beat of analysts’ EBITDA estimates and a decent beat of analysts’ revenue estimates.
Clorox had the slowest revenue growth among its peers. The stock is down 8.7% since reporting and currently trades at $99.70.
Read our full, actionable report on Clorox here, it’s free for active Edge members.
Wrapping up Q3 earnings, we look at the numbers and key takeaways for the household products stocks, including Kimberly-Clark and its peers.
Household products stocks are generally stable investments, as many of the industry's products are essential for a comfortable and functional living space. Recently, there's been a growing emphasis on eco-friendly and sustainable offerings, reflecting the evolving consumer preferences for environmentally conscious options. These trends can be double-edged swords that benefit companies who innovate quickly to take advantage of them and hurt companies that don't invest enough to meet consumers where they want to be with regards to trends.
The 10 household products stocks we track reported a satisfactory Q3. As a group, revenues beat analysts’ consensus estimates by 1.9% while next quarter’s revenue guidance was 1% above.
While some household products stocks have fared somewhat better than others, they have collectively declined. On average, share prices are down 2.1% since the latest earnings results.
Originally founded as a Wisconsin paper mill in 1872, Kimberly-Clark (NYSE:KMB) is now a household products powerhouse known for personal care and tissue products.
Kimberly-Clark reported revenues of $4.15 billion, flat year on year. This print was in line with analysts’ expectations, and overall, it was a satisfactory quarter for the company with a decent beat of analysts’ EBITDA estimates but gross margin in line with analysts’ estimates.
"The operating environment remains dynamic, but we continue to execute our strategy with discipline and excellence as we play to win," said Kimberly-Clark Chairman and CEO, Mike Hsu.
Unsurprisingly, the stock is down 11.6% since reporting and currently trades at $103.15.
Is now the time to buy Kimberly-Clark? Access our full analysis of the earnings results here, it’s free for active Edge members.
Enhancing the lives of both pets and homeowners, Central Garden & Pet is a leading producer and distributor of essential products for pet care, lawn and garden maintenance, and pest control.
Central Garden & Pet reported revenues of $678.2 million, up 1.3% year on year, outperforming analysts’ expectations by 3.9%. The business had an exceptional quarter with a beat of analysts’ EPS estimates and an impressive beat of analysts’ adjusted operating income estimates.
The market seems happy with the results as the stock is up 8.1% since reporting. It currently trades at $33.98.
Is now the time to buy Central Garden & Pet? Access our full analysis of the earnings results here, it’s free for active Edge members.
Masterminds behind the viral Energizer Bunny mascot, Energizer is one of the world's largest manufacturers of batteries.
Energizer reported revenues of $832.8 million, up 3.4% year on year, exceeding analysts’ expectations by 0.8%. Still, it was a softer quarter as it posted EPS guidance for next quarter missing analysts’ expectations significantly and a miss of analysts’ gross margin estimates.
As expected, the stock is down 20.5% since the results and currently trades at $18.96.
Read our full analysis of Energizer’s results here.
Founded in 1913 with bleach as the sole product offering, Clorox today is a consumer products giant whose product portfolio spans everything from bleach to skincare to salad dressing to kitty litter.
Clorox reported revenues of $1.43 billion, down 18.9% year on year. This number beat analysts’ expectations by 2%. It was a strong quarter as it also logged an impressive beat of analysts’ EBITDA estimates and a decent beat of analysts’ revenue estimates.
Clorox had the slowest revenue growth among its peers. The stock is down 5.4% since reporting and currently trades at $103.20.
Read our full, actionable report on Clorox here, it’s free for active Edge members.
Best known for its aluminum foil, Reynolds is a household products company whose products focus on food storage, cooking, and waste.
Reynolds reported revenues of $931 million, up 2.3% year on year. This result topped analysts’ expectations by 3.4%. Overall, it was a strong quarter as it also put up revenue guidance for next quarter exceeding analysts’ expectations and an impressive beat of analysts’ organic revenue estimates.
The stock is up 2.8% since reporting and currently trades at $24.36.
Read our full, actionable report on Reynolds here, it’s free for active Edge members.

Even though Reynolds (currently trading at $24.60 per share) has gained 7.3% over the last six months, it has lagged the S&P 500’s 21.3% return during that period. This might have investors contemplating their next move.
Is there a buying opportunity in Reynolds, or does it present a risk to your portfolio? Dive into our full research report to see our analyst team’s opinion, it’s free for active Edge members.
Why Do We Think Reynolds Will Underperform?
We don't have much confidence in Reynolds. Here are three reasons why REYN doesn't excite us and a stock we'd rather own.
1. Demand Slipping as Sales Volumes Decline
Revenue growth can be broken down into changes in price and volume (the number of units sold). While both are important, volume is the lifeblood of a successful staples business as there’s a ceiling to what consumers will pay for everyday goods; they can always trade down to non-branded products if the branded versions are too expensive.
Reynolds’s average quarterly sales volumes have shrunk by 1.6% over the last two years. This decrease isn’t ideal because the quantity demanded for consumer staples products is typically stable. 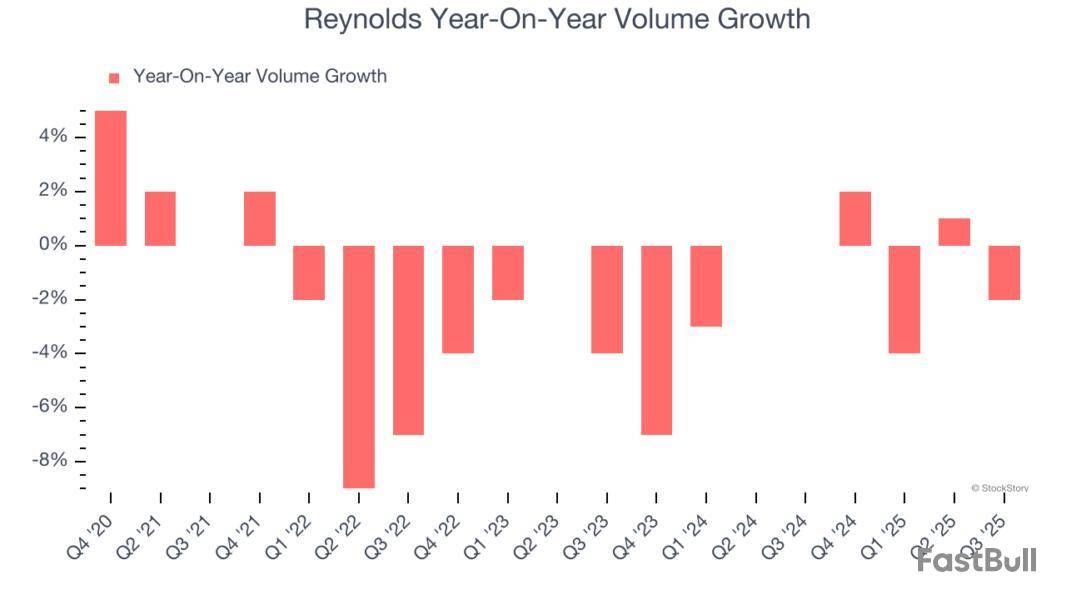
2. Projected Revenue Growth Shows Limited Upside
Forecasted revenues by Wall Street analysts signal a company’s potential. Predictions may not always be accurate, but accelerating growth typically boosts valuation multiples and stock prices while slowing growth does the opposite.
Over the next 12 months, sell-side analysts expect Reynolds’s revenue to stall, close to This projection is underwhelming and implies its newer products will not catalyze better top-line performance yet.
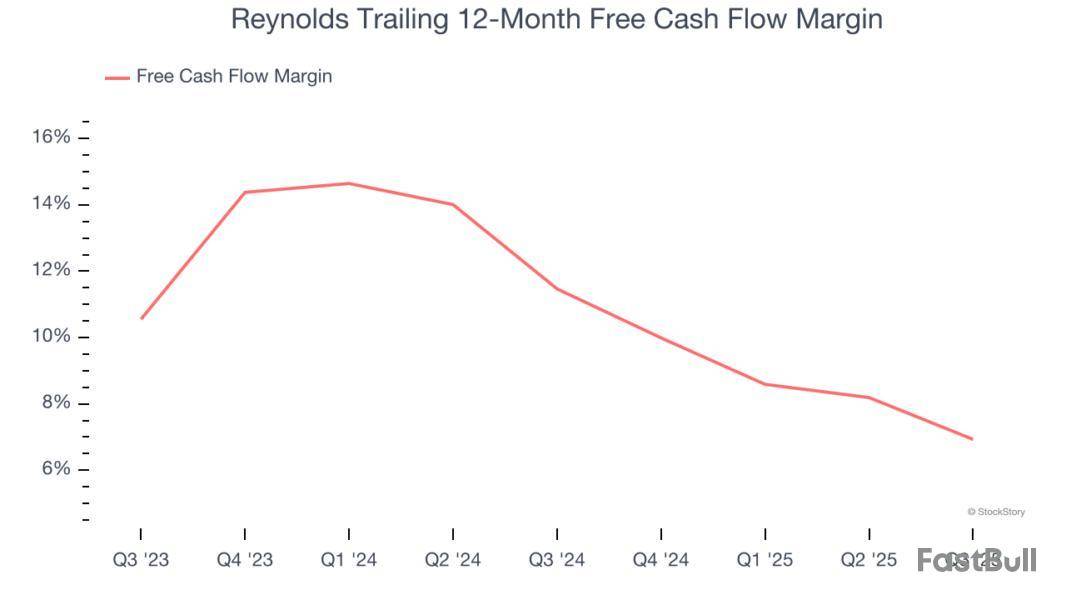
3. Free Cash Flow Margin Dropping
Free cash flow isn't a prominently featured metric in company financials and earnings releases, but we think it's telling because it accounts for all operating and capital expenses, making it tough to manipulate. Cash is king.
As you can see below, Reynolds’s margin dropped by 4.5 percentage points over the last year. This decrease warrants extra caution because Reynolds failed to grow its revenue organically. Its cash profitability could decay further if it tries to reignite growth through investments.
Final Judgment
Reynolds doesn’t pass our quality test. With its shares lagging the market recently, the stock trades at 14.5× forward P/E (or $24.60 per share). While this valuation is reasonable, we don’t see a big opportunity at the moment. There are superior stocks to buy right now. Let us point you toward our favorite semiconductor picks and shovels play.
Stocks We Like More Than Reynolds
Donald Trump’s April 2025 "Liberation Day" tariffs sent markets into a tailspin, but stocks have since rebounded strongly, proving that knee-jerk reactions often create the best buying opportunities.
The smart money is already positioning for the next leg up. Don’t miss out on the recovery - check out our Top 5 Growth Stocks for this month. This is a curated list of our High Quality stocks that have generated a market-beating return of 183% over the last five years (as of March 31st 2025).
Stocks that made our list in 2020 include now familiar names such as Nvidia (+1,545% between March 2020 and March 2025) as well as under-the-radar businesses like the once-small-cap company Comfort Systems (+782% five-year return).
StockStory is growing and hiring equity analyst and marketing roles. Are you a 0 to 1 builder passionate about the markets and AI? See the open roles here.

Reynolds reported third quarter results that surpassed Wall Street’s expectations, with management crediting broad-based market share gains and execution on cost discipline as key drivers. CEO Scott Huckins highlighted that retail share increased across multiple product lines, including Hefty Waste Bags and Reynolds Wrap, which benefited from improved pricing and a narrower price gap versus store brands. Management also pointed to advancements in manufacturing productivity and supply chain efficiency, noting, “We are operating with increased agility, outperforming our categories and driving improved financial results.”
Is now the time to buy REYN? Find out in our full research report (it’s free for active Edge members).
Reynolds (REYN) Q3 CY2025 Highlights:
While we enjoy listening to the management's commentary, our favorite part of earnings calls are the analyst questions. Those are unscripted and can often highlight topics that management teams would rather avoid or topics where the answer is complicated. Here is what has caught our attention.
Our Top 5 Analyst Questions From Reynolds’s Q3 Earnings Call
Robert Ottenstein (Evercore ISI) asked about holiday season promotional intensity and consumer affordability. CEO Scott Huckins explained that promotional activity is steady with pre-pandemic levels, and the company is prepared to serve both value-focused and brand-loyal consumers.
Kaumil Gajrawala (Jefferies) inquired about the strategic impact of new leadership hires. Huckins stated that the addition of a Chief Commercial Officer and Chief Operations Officer directly supports innovation, revenue management, and cost reduction initiatives.
Lauren Lieberman (Barclays) questioned the outlook for the tableware business amid volume declines. Huckins clarified that foam headwinds drove most of the decline but expressed confidence that these headwinds would lessen next year, with profitability improving despite lower volumes.
Andrea Teixeira (JPMorgan Chase) sought detail on promotional strategy and distribution gains for Hefty. Huckins emphasized that innovation and high supply chain fill rates drive growth more than promotion, with scented waste bags and private label offerings both performing well.
Peter Grom (UBS) asked if the effectiveness of promotions has changed. Huckins said that Reynolds is focused on optimizing promotional spend through revenue growth management tools but has not seen a structural change in trade effectiveness.
Catalysts in Upcoming Quarters
In the coming quarters, the StockStory team will be closely monitoring (1) the pace and sustainability of retail share gains in Reynolds’ core categories, (2) the impact of automation and lean initiatives on margins and cost structure, and (3) how successfully the management team navigates retailer dynamics and private label bidding amid inflation and tariffs. Execution on new product launches and the ability to manage input cost volatility will also be important signposts for ongoing performance.
Reynolds currently trades at $24.64, up from $23.72 just before the earnings. At this price, is it a buy or sell? Find out in our full research report (it’s free for active Edge members).
Our Favorite Stocks Right Now
Trump’s April 2025 tariff bombshell triggered a massive market selloff, but stocks have since staged an impressive recovery, leaving those who panic sold on the sidelines.
Take advantage of the rebound by checking out our Top 5 Strong Momentum Stocks for this week. This is a curated list of our High Quality stocks that have generated a market-beating return of 183% over the last five years (as of March 31st 2025).
Stocks that made our list in 2020 include now familiar names such as Nvidia (+1,545% between March 2020 and March 2025) as well as under-the-radar businesses like the once-small-cap company Comfort Systems (+782% five-year return).
StockStory is growing and hiring equity analyst and marketing roles. Are you a 0 to 1 builder passionate about the markets and AI? See the open roles here.
728 RM B 7/F GEE LOK IND BLDG NO 34 HUNG TO RD KWUN TONG KLN HONG KONG


The risk of loss in trading financial instruments such as stocks, FX, commodities, futures, bonds, ETFs and crypto can be substantial. You may sustain a total loss of the funds that you deposit with your broker. Therefore, you should carefully consider whether such trading is suitable for you in light of your circumstances and financial resources.
No decision to invest should be made without thoroughly conducting due diligence by yourself or consulting with your financial advisors. Our web content might not suit you since we don't know your financial conditions and investment needs. Our financial information might have latency or contain inaccuracy, so you should be fully responsible for any of your trading and investment decisions. The company will not be responsible for your capital loss.
Without getting permission from the website, you are not allowed to copy the website's graphics, texts, or trademarks. Intellectual property rights in the content or data incorporated into this website belong to its providers and exchange merchants.
Not Logged In
Log in to access more features


Log In
Sign Up


