


- XAUUSD
- XAGUSD
- WTI
- USDX



Markets
Analysis
User
24/7
Economic Calendar
Education
Data
- Names
- Latest
- Prev









Understand inflation, its main causes, how CPI and PCE measure price changes, and how inflation affects purchasing power, savings, and the economy.
Inflation is the sustained increase in the overall prices of goods and services over time. As prices rise, money loses purchasing power, so the same income buys less than before. Understanding what drives inflation and how it is measured helps explain changes in household budgets, interest rates, and the wider economy.
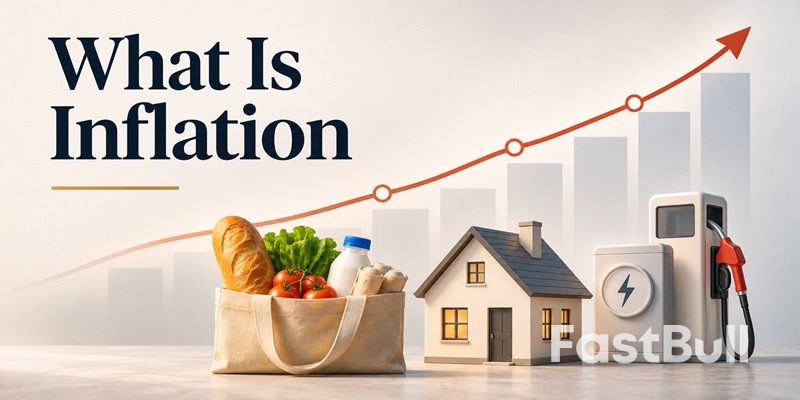
Inflation is a broad rise in the general price level across an economy. It does not mean every product becomes more expensive at the same rate. Instead, it describes a sustained increase across many goods and services, measured using a price index.
For example, if a representative basket of goods and services costs $100 one year and $103 the next, its price has risen by 3%. A higher price for one item, such as gasoline or coffee, is not enough on its own to show that the economy has inflation. The increase must be broad enough to affect the overall price level.
As prices rise, each dollar buys fewer goods and services. This loss of purchasing power is why inflation matters to consumers, businesses, and policymakers.
Inflation can have several causes. The main forces include stronger demand, higher production costs, and expectations that prices will keep rising.
Demand-pull inflation occurs when total demand for goods and services grows faster than businesses can supply them. When consumers, companies, or governments spend more, but production cannot expand quickly enough, sellers may raise prices.
This can happen when household incomes and consumer confidence rise, government spending increases, taxes fall, or lower interest rates encourage borrowing and spending. Demand-pull pressure is more likely when the economy is already operating close to its productive capacity.
Cost-push inflation begins when it becomes more expensive to produce or deliver goods and services. Higher oil and electricity prices, more expensive raw materials, rising wages, tariffs, or supply-chain disruptions can increase business costs. Companies may pass some of those costs on to customers through higher prices.
For example, a rise in fuel prices can make transportation and manufacturing more expensive. The effect can spread to food, retail goods, and other products that depend on shipping. Cost-push inflation can occur even when consumer demand is not especially strong.
Expectations can help make inflation persist. If workers expect living costs to rise, they may seek higher wages. If businesses then raise prices to cover higher labor costs, workers may ask for further pay increases. This feedback loop is often called a wage-price spiral.
It is not automatic: productivity, competition, demand, and monetary policy all affect whether wage and price increases reinforce each other. But when households and businesses expect high inflation to continue, those expectations can influence current wage negotiations and pricing decisions.
Inflation is measured by tracking changes in price indexes over time. In the United States, the two most closely watched consumer price measures are the Consumer Price Index (CPI) and the Personal Consumption Expenditures (PCE) Price Index.
The CPI, published by the Bureau of Labor Statistics (BLS), measures the average change in prices paid by urban consumers for a representative basket of goods and services. The basket covers categories such as housing, food, transportation, medical care, education, and clothing. Each category has a weight based on consumer spending, so a price change in a heavily weighted category can have a larger effect on the overall index.
Headline CPI includes all major categories, including food and energy. Core CPI excludes food and energy because their prices can be especially volatile. Core CPI is useful for examining underlying trends, but it is not a measure of the full cost of living and does not replace headline CPI.
The PCE Price Index, published by the Bureau of Economic Analysis (BEA), measures price changes for goods and services consumed by or on behalf of households. It includes some expenses paid by employers or government programs, such as parts of healthcare spending, so its coverage is broader than the CPI's out-of-pocket household spending measure.
The PCE uses a chain-weighted formula that updates spending weights as consumption patterns change. This helps it reflect substitutions consumers make when relative prices change. The Federal Reserve's longer-run 2% inflation goal is measured using the annual change in the PCE price index. See the Federal Reserve's inflation target explanation.
The inflation rate is the percentage change in a price index over a stated period. It is commonly calculated year over year or month over month.
Inflation Rate = [(Current Price Index − Previous Price Index) ÷ Previous Price Index] × 100
For example, if an index rises from 300 to 309 over a year, the annual inflation rate is [(309 − 300) ÷ 300] × 100 = 3%. This means the measured price level is 3% higher than it was a year earlier.
Three terms are important when reading inflation data:
For a current U.S. snapshot, the October 2026 CPI rose 0.4% from September on a seasonally adjusted basis, while core CPI rose 0.3%. BLS could not publish most October year-over-year CPI changes because October 2025 survey data were unavailable after a lapse in federal appropriations. The latest available PCE report, for September 2026, showed a 3.6% year-over-year increase in the PCE price index and a 3.1% increase excluding food and energy. These figures cover different periods and indexes, so they should not be compared as if they were the same measure. BLS October 2026 CPI report; BEA September 2026 PCE report.
The effect of inflation depends on how quickly prices rise and whether incomes, savings returns, and business revenues keep pace.
When prices rise faster than income, households can afford less with the same paycheck. If wages increase by 2% while consumer prices rise by 4%, real purchasing power falls. The impact also differs by household: people who spend a larger share of their income on rent, food, or energy may feel sharper increases in those categories.
Inflation reduces the real value of wages and cash savings when their growth or interest earnings lag behind prices. For example, if a savings account earns 2% while inflation is 3%, its approximate real return is negative 1% before taxes.
Inflation also affects interest-rate decisions. When price increases remain too high, the Federal Reserve may raise its policy rate to restrain demand. Higher policy rates can feed through to mortgages, credit cards, and business loans, although the effect on each borrowing rate depends on loan terms, credit risk, and market conditions.
Businesses may face higher costs for labor, energy, materials, and transportation. They can respond by raising prices, accepting lower profit margins, or delaying investment. When inflation is high or unpredictable, households and companies may also find it harder to plan spending, wages, and long-term projects.
Moderate, predictable inflation is not necessarily harmful. The greater challenge is inflation that stays high or changes sharply, because it makes prices and financial decisions harder to plan around.
Inflation is a broad rise in prices that reduces the purchasing power of money. Understanding its causes, the differences between CPI and PCE, and how inflation rates are calculated makes it easier to interpret economic data and assess its effect on household and business decisions.

728 RM B 7/F GEE LOK IND BLDG NO 34 HUNG TO RD KWUN TONG KLN HONG KONG


The risk of loss in trading financial instruments such as stocks, FX, commodities, futures, bonds, ETFs and crypto can be substantial. You may sustain a total loss of the funds that you deposit with your broker. Therefore, you should carefully consider whether such trading is suitable for you in light of your circumstances and financial resources.
No decision to invest should be made without thoroughly conducting due diligence by yourself or consulting with your financial advisors. Our web content might not suit you since we don't know your financial conditions and investment needs. Our financial information might have latency or contain inaccuracy, so you should be fully responsible for any of your trading and investment decisions. The company will not be responsible for your capital loss.
Without getting permission from the website, you are not allowed to copy the website's graphics, texts, or trademarks. Intellectual property rights in the content or data incorporated into this website belong to its providers and exchange merchants.
Not Logged In
Log in to access more features


Log In
Sign Up