


- XAUUSD
- XAGUSD
- WTI
- USDX



Markets
Analysis
User
24/7
Economic Calendar
Education
Data
- Names
- Latest
- Prev









Compare Treasury bills vs. bonds, including interest rates, maturity dates, yields, and risks. See how much a $10,000 Treasury bill can earn and which investment may suit your goals.
Treasury bills (T-bills) and Treasury bonds are both U.S. government debt securities, but they serve different investment goals. Their main differences include maturity, interest payments, yields, and interest rate risk. Understanding these factors can help investors decide which option better fits their financial needs.
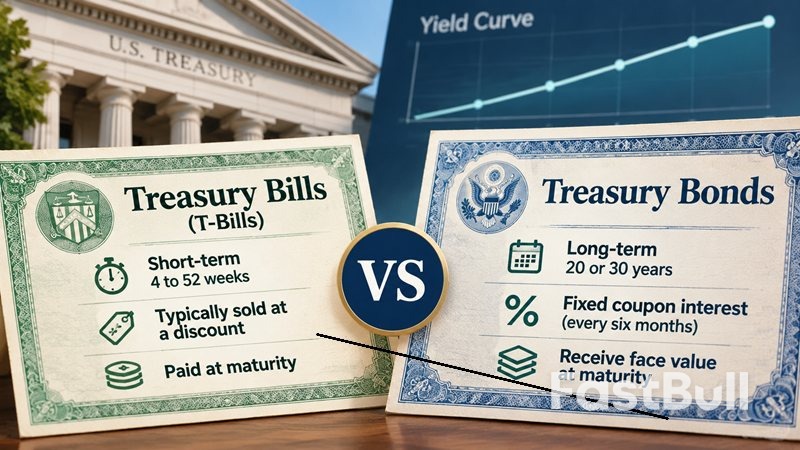
The biggest difference between Treasury bills and Treasury bonds is how long investors lend money to the U.S. government. T-bills are short-term securities that mature within one year, while Treasury bonds are long-term investments with maturities of 20 or 30 years.
Treasury bills are short-term debt securities issued by the U.S. Department of the Treasury. They are available with maturities of 4, 6, 8, 13, 17, 26, and 52 weeks, making them suitable for investors who want to earn a return without committing their money for several years.
Unlike traditional bonds, T-bills do not pay periodic interest. They are typically sold at a discount to their face value, although they can also be issued at par. When a bill matures, the investor receives its full face value. The difference between the purchase price and the amount received represents the investment earnings.
For example, an investor might pay $9,850 for a T-bill with a $10,000 face value. At maturity, the Treasury pays $10,000, generating $150 in earnings before taxes.
Investors can hold T-bills until maturity or sell them in the secondary market beforehand. Their short maturities generally make them less sensitive to interest rate changes than long-term Treasury securities.
Treasury bonds are long-term securities issued by the U.S. government with maturities of 20 or 30 years. They are commonly used by investors seeking predictable interest income over an extended period.
Unlike T-bills, Treasury bonds pay fixed interest every six months until maturity. The coupon rate is established when the bond is first issued and does not change during its life. At maturity, investors receive the bond's face value.
For example, a $10,000 Treasury bond with a 4% annual coupon rate pays $400 in interest each year, typically through two $200 payments. The investor also receives the $10,000 principal when the bond matures, assuming the bond is held to maturity.
However, Treasury bonds can be sold before maturity. Their market prices fluctuate as interest rates change, meaning an investor may receive more or less than the original purchase price when selling early.
Treasury notes occupy the middle ground between T-bills and Treasury bonds. They have maturities of 2, 3, 5, 7, or 10 years and pay fixed interest every six months.
The U.S. Treasury classifies bills, notes, and bonds separately based on their maturity periods. Understanding this distinction helps investors compare securities with similar investment horizons rather than treating all Treasury products as interchangeable.
Although both securities are backed by the U.S. government, their investment characteristics differ significantly. The following table highlights the main differences:
| Feature | Treasury Bills | Treasury Bonds |
|---|---|---|
| Maturity | 4 to 52 weeks | 20 or 30 years |
| Interest Structure | Typically sold at a discount | Fixed coupon rate |
| Interest Payments | At maturity | Every six months |
| Purchase Price | Usually below face value | Can be above, below, or at face value |
| Interest Rate Risk | Generally lower | Generally higher |
| Investment Horizon | Short-term | Long-term |
| Typical Purpose | Short-term cash management | Long-term income and portfolio planning |
The most important distinction is the relationship between maturity and interest rate risk. T-bills mature quickly, allowing investors to reinvest their money relatively soon when market rates change. Treasury bonds lock in fixed coupon payments for much longer, making their market prices more sensitive to interest rate movements.
Treasury bill rates and Treasury bond yields both indicate the return investors can expect, but they are calculated differently. Comparing them requires looking beyond the quoted interest rate to understand the purchase price, payment structure, and time to maturity.
Treasury bill rates are determined through government auctions. The discount rate reflects the difference between a bill's face value and its purchase price over the time remaining until maturity.
For example, if an investor purchases a 13-week T-bill for $9,900 and receives $10,000 at maturity, the earnings are $100. The actual annualized return depends on the amount invested and the holding period.
One important detail is that the quoted T-bill discount rate is not the same as the investor's actual annualized return. The discount rate is calculated using face value and a 360-day convention, while the investment rate uses the purchase price and a 365-day basis, or 366 days in a leap year. Investors should compare investment rates rather than discount rates when evaluating different securities.
Treasury bond yields depend on the bond's coupon payments, purchase price, and remaining time until maturity. The coupon rate is fixed at issuance, but the yield changes as the bond's market price moves.
For example, a bond with a $10,000 face value and a 4% coupon rate pays $400 annually regardless of its market price. However, if the bond trades below $10,000, a new buyer may earn a higher yield to maturity than the original coupon rate. If it trades above face value, the yield to maturity may be lower.
This is why investors should distinguish between coupon rates and yield to maturity (YTM). The coupon rate measures annual interest relative to face value, while YTM estimates the annualized return from buying the bond at its current price and holding it until maturity, assuming scheduled payments are made and coupon payments are reinvested as assumed.
For more details, investors can review TreasuryDirect's explanation of Treasury pricing and interest rates.
Neither Treasury bills nor Treasury bonds consistently offer higher returns. The difference depends on current market conditions, the yield curve, and how long investors plan to hold their money.
Long-term Treasury bonds may offer higher yields to compensate investors for committing their money over a longer period and accepting greater interest rate risk. However, this is not guaranteed. When the yield curve is inverted, short-term Treasury bills can offer higher yields than long-term bonds.
Investors should compare a T-bill's investment rate with a Treasury bond's yield to maturity, rather than comparing a T-bill's discount rate with a bond's coupon rate. These measures provide a more meaningful comparison of potential returns.
The amount an investor earns from a 3-month Treasury bill depends on its purchase price and discount rate. For example, assume a 13-week T-bill has a face value of $10,000, a 91-day maturity, and a hypothetical annualized discount rate of 4%.
Treasury bills are priced using the following formula:
Purchase Price = Face Value × [1 − (Discount Rate × Days to Maturity ÷ 360)]
Using these figures:
When the bill matures, the investor receives $10,000. The earnings are therefore:
$10,000 − $9,898.89 = $101.11
This means an investor earns approximately $101.11 over 13 weeks on a $10,000 face-value T-bill. The equivalent annualized investment rate is approximately 4.10%, using a 365-day basis. This differs from the 4% discount rate.
The example assumes $10,000 is the bill's face value, not the amount of cash invested. If $10,000 is the actual investment budget, the investor could purchase a slightly higher face value, generating approximately $102.14 in earnings under the same assumptions.
Both Treasury bills and Treasury bonds are backed by the full faith and credit of the U.S. government, giving them very low credit risk. However, government backing does not eliminate inflation risk, reinvestment risk, or losses from selling before maturity.
The main drawback of T-bills is reinvestment risk. Because they mature within one year, investors must frequently reinvest their money if they want to maintain their holdings. If interest rates fall, newly issued bills may offer lower returns than previous ones.
Inflation is another concern. Even if a T-bill generates a positive nominal return, rising prices can reduce the purchasing power of the earnings. Investors may also receive less than their original purchase price if they sell a bill before maturity during unfavorable market conditions.
Treasury bonds have greater interest rate risk because of their long maturities. When market interest rates rise, existing fixed-rate bond prices generally fall. Investors who need to sell before maturity may have to accept a loss.
Inflation can also reduce the real value of fixed coupon payments over a 20- or 30-year period. Although investors who hold a bond to maturity receive its face value, the purchasing power of that money may be lower than expected.
For a clearer understanding of this relationship, Investor.gov explains how interest rates affect fixed-rate bond prices.
The right choice depends on when you need your money, whether you want regular income, and how much interest rate risk you are willing to accept.
Treasury bills may be a better fit for investors who want to earn a return on money set aside for short-term goals, such as a planned down payment, tuition payment, or upcoming purchase. They can also be useful for cash that is not needed immediately but should remain invested for a relatively short period.
Their short maturities provide more frequent access to principal at maturity and allow investors to reinvest at prevailing market rates. However, investors should match maturity dates to their cash needs. For an emergency fund that requires immediate access, a savings account may be more practical than a T-bill.
Treasury bonds may suit investors who want predictable interest income over a longer period and can tolerate fluctuations in market value. Their semiannual coupon payments provide a regular income stream, while holding the bond to maturity allows investors to receive its face value.
They can also help investors lock in a fixed coupon rate for longer, reducing the need to reinvest frequently. However, investors should consider inflation and interest rate risk before committing money for 20 or 30 years.
Treasury bills and certificates of deposit (CDs) are both commonly used for short-term savings, but they differ in government backing, insurance, liquidity, and tax treatment.
| Feature | Treasury Bills | CDs |
|---|---|---|
| Issuer | U.S. government | Banks and credit unions |
| Maturity | 4 to 52 weeks | Varies by institution and product |
| Return | Discount-based earnings | Typically fixed interest |
| Protection | Backed by the U.S. government | FDIC insurance for eligible bank deposits, subject to coverage limits |
| Early Access | Can be sold in the secondary market | Traditional CDs usually impose an early withdrawal penalty |
| Tax Treatment | Federal tax; exempt from state and local income taxes | Generally subject to applicable federal and state taxes |
CDs may appeal to savers who prefer a fixed interest rate and FDIC insurance. Eligible deposits are generally insured up to $250,000 per depositor, per insured bank, for each ownership category. Treasury bills are not FDIC-insured but are backed by the U.S. government.
T-bills may be more attractive to investors who value short-term flexibility and the state and local tax exemption. The better option depends on the available rates, withdrawal requirements, and applicable taxes. Investors can review the FDIC's deposit insurance rules before choosing a CD.

728 RM B 7/F GEE LOK IND BLDG NO 34 HUNG TO RD KWUN TONG KLN HONG KONG


The risk of loss in trading financial instruments such as stocks, FX, commodities, futures, bonds, ETFs and crypto can be substantial. You may sustain a total loss of the funds that you deposit with your broker. Therefore, you should carefully consider whether such trading is suitable for you in light of your circumstances and financial resources.
No decision to invest should be made without thoroughly conducting due diligence by yourself or consulting with your financial advisors. Our web content might not suit you since we don't know your financial conditions and investment needs. Our financial information might have latency or contain inaccuracy, so you should be fully responsible for any of your trading and investment decisions. The company will not be responsible for your capital loss.
Without getting permission from the website, you are not allowed to copy the website's graphics, texts, or trademarks. Intellectual property rights in the content or data incorporated into this website belong to its providers and exchange merchants.
Not Logged In
Log in to access more features


Log In
Sign Up