

Markets
News
Analysis
User
24/7
Economic Calendar
Education
Data
- Names
- Latest
- Prev


Signal Accounts for Members
All Signal Accounts
All Contests
 France Trade Balance (SA) (Oct)
A:--
F: --
 Euro Zone Employment YoY (SA) (Q3)
A:--
F: --
 Canada Part-Time Employment (SA) (Nov)
A:--
F: --
P: --
Canada Unemployment Rate (SA) (Nov)A:--
F: --
P: --
Canada Full-time Employment (SA) (Nov)A:--
F: --
P: --
Canada Labor Force Participation Rate (SA) (Nov)A:--
F: --
P: --
Canada Employment (SA) (Nov)A:--
F: --
P: --
 U.S. PCE Price Index MoM (Sept)
A:--
F: --
P: --
U.S. Personal Income MoM (Sept)A:--
F: --
P: --
U.S. Core PCE Price Index MoM (Sept)A:--
F: --
P: --
U.S. PCE Price Index YoY (SA) (Sept)A:--
F: --
P: --
U.S. Core PCE Price Index YoY (Sept)A:--
F: --
P: --
U.S. Personal Outlays MoM (SA) (Sept)A:--
F: --
U.S. 5-10 Year-Ahead Inflation Expectations (Dec)A:--
F: --
P: --
U.S. Real Personal Consumption Expenditures MoM (Sept)A:--
F: --
U.S. Weekly Total Rig CountA:--
F: --
P: --
U.S. Weekly Total Oil Rig CountA:--
F: --
P: --
U.S. Consumer Credit (SA) (Oct)A:--
F: --
 China, Mainland Foreign Exchange Reserves (Nov)
A:--
F: --
P: --
 Japan Trade Balance (Oct)
A:--
F: --
P: --
Japan Nominal GDP Revised QoQ (Q3)A:--
F: --
P: --
China, Mainland Imports YoY (CNH) (Nov)A:--
F: --
P: --
China, Mainland Exports (Nov)A:--
F: --
P: --
China, Mainland Imports (CNH) (Nov)A:--
F: --
P: --
China, Mainland Trade Balance (CNH) (Nov)A:--
F: --
P: --
China, Mainland Exports YoY (USD) (Nov)A:--
F: --
P: --
China, Mainland Imports YoY (USD) (Nov)A:--
F: --
P: --
 Germany Industrial Output MoM (SA) (Oct)
A:--
F: --
Euro Zone Sentix Investor Confidence Index (Dec)A:--
F: --
P: --
Canada National Economic Confidence IndexA:--
F: --
P: --
 U.K. BRC Like-For-Like Retail Sales YoY (Nov)
--
F: --
P: --
U.K. BRC Overall Retail Sales YoY (Nov)--
F: --
P: --
 Australia Overnight (Borrowing) Key Rate
--
F: --
P: --
RBA Rate Statement RBA Press Conference Germany Exports MoM (SA) (Oct)--
F: --
P: --
U.S. NFIB Small Business Optimism Index (SA) (Nov)--
F: --
P: --
 Mexico 12-Month Inflation (CPI) (Nov)
--
F: --
P: --
Mexico Core CPI YoY (Nov)--
F: --
P: --
Mexico PPI YoY (Nov)--
F: --
P: --
U.S. Weekly Redbook Index YoY--
F: --
P: --
U.S. JOLTS Job Openings (SA) (Oct)--
F: --
P: --
China, Mainland M1 Money Supply YoY (Nov)--
F: --
P: --
China, Mainland M0 Money Supply YoY (Nov)--
F: --
P: --
China, Mainland M2 Money Supply YoY (Nov)--
F: --
P: --
U.S. EIA Short-Term Crude Production Forecast For The Year (Dec)--
F: --
P: --
U.S. EIA Natural Gas Production Forecast For The Next Year (Dec)--
F: --
P: --
U.S. EIA Short-Term Crude Production Forecast For The Next Year (Dec)--
F: --
P: --
EIA Monthly Short-Term Energy Outlook U.S. API Weekly Gasoline Stocks--
F: --
P: --
U.S. API Weekly Cushing Crude Oil Stocks--
F: --
P: --
U.S. API Weekly Crude Oil Stocks--
F: --
P: --
U.S. API Weekly Refined Oil Stocks--
F: --
P: --
 South Korea Unemployment Rate (SA) (Nov)
--
F: --
P: --
Japan Reuters Tankan Non-Manufacturers Index (Dec)--
F: --
P: --
Japan Reuters Tankan Manufacturers Index (Dec)--
F: --
P: --
Japan Domestic Enterprise Commodity Price Index MoM (Nov)--
F: --
P: --
Japan Domestic Enterprise Commodity Price Index YoY (Nov)--
F: --
P: --
China, Mainland PPI YoY (Nov)--
F: --
P: --
China, Mainland CPI MoM (Nov)--
F: --
P: --
 Italy Industrial Output YoY (SA) (Oct)
--
F: --
P: --

No matching data
Latest Views
Latest Views
Trending Topics
Top Columnists
Latest Update
White Label
Data API
Web Plug-ins
Affiliate Program
View All
No data


The quarterly report for Treasure (MAGIC) is crucial for investors. These reports usually include updates on project progress, financial health, and future plans. A positive report can attract more buyers, boosting the price. Conversely, negative findings could push the price down. Since this report includes fresh insights into the project's future, MAGIC's price might experience sudden changes. Investors will look for signs of growth and stability in these documents. Keep an eye on this event if you're trading MAGIC. For more details, visit source.
The WBTC Ignition Livestream could impact Colend (CLND) and Core (CORE) prices. During the event, important techniques to earn more Sparks with WBTC are revealed. Information from such events can influence demand for associated tokens. Enhanced earnings could attract new users, which might increase the token's value. Investors watching this livestream may reposition their holdings based on insights shared. Keep an eye out for any price movement before or after the event. For more details, visit source.
Core DAO@Coredao_OrgMay 03, 2025The WBTC Ignition livestream is just 2 days away!
Learn how to earn more Sparks with your WBTC—straight from the teams involved. ️
Join us alongside @WrappedBTC, @BitFluxFi, @colend_xyz, @glyph_exchange, and @dylanjdennis.
️ May 5 | 9AM EST
Live on YouTube & X pic.twitter.com/jlGZjrxLST
The listing of Solvex Network (SOLVEX) on UZX Exchange can make access to this token easier, often a positive sign for price movement. When new listings occur, increased visibility and higher demand can lead to price growth. The new trading pair, SOLVEX/USDT, will offer new trading opportunities. If the token attracts new investors through this exposure, expect possible price increases. However, competition from other assets could moderate the impact. Mark your calendar and consider this listing if you hold SOLVEX. Learn more by visiting source.
Solvex Network@SolvexNetworkMay 03, 2025One more listing coming up!$SOLVEX will soon be listed on UZX Exchange!
We’re excited to expand our presence and bring our vision to even more users.
Official announcement:https://t.co/7UyGcKwEFc#SolveX
Bitcoin maintains its bullish form from April as it gains by over 4% in the first two days of May to surge above $97,000. Following this recent gain, the premier cryptocurrency is experiencing a minor retracement as investors attempt to decipher the current market phase.
Meanwhile, a prominent crypto analyst with the X handle IT Tech has shared some valuable insights on Bitcoin’s market structure, highlighting the key price levels that could decide the asset’s movement in the short term.
Bitcoin Cools Off After Price Rally: Breather Or Bull Trap?
According to IT Tech in an X post on May 2, Bitcoin appears to be catching its breath following a price rally from $93,600 to above $97,000. As market traders await to see if this will be a mere cooling period before another upswing or the start of a deeper price correction, IT Tech has shared some helpful technical and on-chain insights on potential price targets.
The analyst states that the Bitcoin SuperTrend Indicator had printed a buy signal when prices hit $94,000, followed by a sell signal at $97,300. However, with market prices still above $94,000, the Bitcoin market structure and SuperTrend Indicator remain bullish.
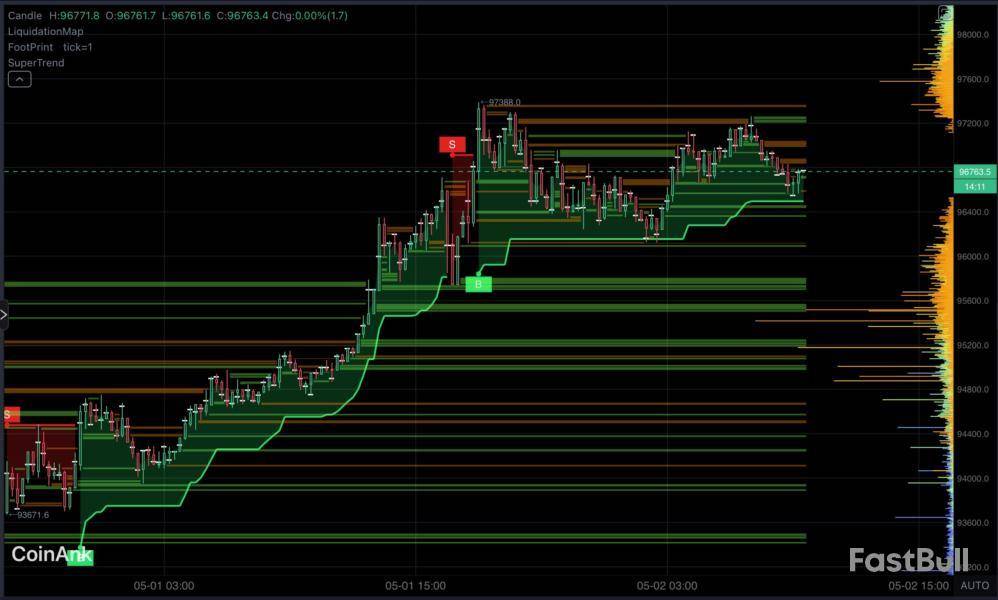
Meanwhile, liquidation data has also hinted at potential points for price volatility. Most notably, IT Tech states there are long liquidation zones between the $95,200 – $96,000 price region and another dense cluster of orders at the $93,600 – $94,000 price region. Both regions are expected to act as strong price supports in the case of an unexpected decline.
In determining Bitcoin’s next move, IT Tech says that market sentiment remains cautiously bullish as long as the $96,000 support level remains valid. This is because a decisive price fall below this level would trigger a liquidation cascade pushing prices back to $94,000. Meanwhile, another price breakout above $97,400 to allow Bitcoin to trade as high as $98,500.
What’s Next For Bitcoin?
At press time, Bitcoin trades at $96,463, reflecting a 1.64% gain in the past seven days. Meanwhile, the asset’s trading volume is down by 21.82% and valued at $26 billion.
As earlier stated, bullish sentiment continues to ravage the market as indicated by recent developments, including the surge in Bitcoin Spot ETF inflows. Meanwhile, the US’s willingness to negotiate a new trade deal with China may signify no further negative developments on international trade tariffs.
Amidst Bitcoin’s recent bullish stint, analysts continue to roll out bullish predictions with lofty price targets as high as $150,000.
These are positive signals indicating more growth in long-term price support for Solana tokens.
The growth in the stablecoin market cap on the Solana ecosystem in 2025 has been absolutely staggering. More details on that are below. But, these are the kind of healthy Web3 indicators that help evaluate network effects and user activity for financial risk assessment.
Solana prices have been trending along with the broad crypto market over the past 12 months. But they may be on a trajectory to outperform many other altcoins in Q2 2025.
Here are five reasons why:1. Bullish Long Term SOL Cup and Handle Pattern
Zooming out, #Solana $SOL appears to form a textbook-perfect cup and handle pattern! pic.twitter.com/91oYYgY0yL
— Ali (@ali_charts) April 28, 2025
On Apr. 28, popular Crypto X chart technical analyst Ali Martinez (“Ali Charts”) posted an interesting observation to some 136K followers..
The Solana price chart does certainly form a bullish cup and handle pattern starting around Oct. 2022. The cup completes in Nov. 2024, and the handle forms during market panic after Trump took office.
This chart pattern is a classic technical analysis signal of a bullish reversal about to begin in exchange markets. The fact that the pattern spans some two-and-a-half years does not discredit its usefulness as a price signal for Solana in May.
This classically reliable pattern usually becomes more reliable the longer it takes to form.
Ali added that the Bollinger Bands squeezing the middle on the 4-hour chart for SOL tokens alsosmelled like something is cookingin Solana markets.
The Bollinger Bands are squeezing on the 4-hour chart for #Solana $SOL, signaling that a major price move could be imminent. pic.twitter.com/47Tq593su6
— Ali (@ali_charts) April 30, 2025
2. Solana Tokenized Stocks Announcement
1/4 @solanainstitute, @superstatefunds and @orca_so, with support from @LowensteinLLP, have submitted a proposal to the SEC – dubbed Project Open – for a pilot project to enable the issuance and trading of equity securities on public blockchain networks like @solana.
— Solana Policy Institute (@SolanaInstitute) April 30, 2025
Tokenized contracts stand to transform the world even more than Bitcoin’s settlement-based finance rocked the system. One of the most abundant use cases for that would be tokenized stocks.
BlackRock CEO Larry Fink said in his annual letter to shareholders in April that tokenizing stocks will revolutionize financial markets. In a powerful statement, Fink wrote:
“Every stock, every bond, every fund—every asset—can be tokenized. If they are, it will revolutionize investing. Markets wouldn’t need to close. Transactions that currently take days would clear in seconds. And billions of dollars currently immobilized by settlement delays could be reinvested immediately back into the economy, generating more growth.”
The Solana Policy Institute and three other organizations announced on Apr. 30 a proposal submitted to the SEC called “Project Open.” The proposal is for a product that allows Solana to issue tokens for stocks that users can trade on the blockchain.3. Bloomberg SOL ETF Approval Odds Jump to 90%
Would love to hear directly from Atkins, but all good chance of happening. Here’s our latest odds of approval for all the dif spot ETFs via @JSeyff https://t.co/nLhYJJmO9U pic.twitter.com/4AcJVwhics
— Eric Balchunas (@EricBalchunas) April 30, 2025
Meanwhile, on Apr. 29, Eric Balchunas, senior ETF analyst for Bloomberg, posted the latest approval odds from Bloomberg Intelligence for active crypto ETF applications at the SEC.
Bloomberg’s forecast for a Solana ETF approval from the SEC in 2025 jumped to 90%. Although there are currently more Ripple ETF applications than Solana, Bloomberg’s odds for a SOL ETF were higher, with XRP at 85%.
Solana tops the odds among altcoins at 90%, but Avalanche and Cardano have a 75% chance of approval, according to Bloomberg’s current estimation. When Bitcoin’s ETFs went live in Q1 2024, its price went on a 12-month historic rally.4. Solana Stablecoin Market Cap Is Spacewalking
#Solana stablecoin supply is at all time high of $11.7 billion pic.twitter.com/tSZmWeJ8O4
— MartyParty (@martypartymusic) February 8, 2025
In addition to the technical and derivatives market signals, and Solana ecosystem development with more use cases, data from DeFiLlama shows an utterly significant increase in such stablecoins from under $5 billion a year ago to above $13 billion in May.
Web3 users like stablecoins for making currency swaps convenient and sheltering their money from market volatility while having it ready to deploy to take advantage of opportunities.
Having that much liquidity suddenly available for trading in under 12 months is an item of fundamental analysis for the bullish column for Solana this quarter.
XRP has started May with a choppy price action between the lower and upper ends of $2.195 and $2.25, respectively, in the past three days. Although XRP has spent the majority of the past two months correcting from the peak price of $3.3 in January, its 2-month candlestick is showing a strong green body, a sign that bulls are still in control in the higher timeframes despite the fluctuations on the lower timeframes.
Interestingly, a precise signal that hasn’t appeared since XRP’s historic 2017 rally is back, and the same trigger that led to its 20x price explosion that year has just returned.
Technical Pattern Shows Clear Breakout Structure On 2-Month Timeframe
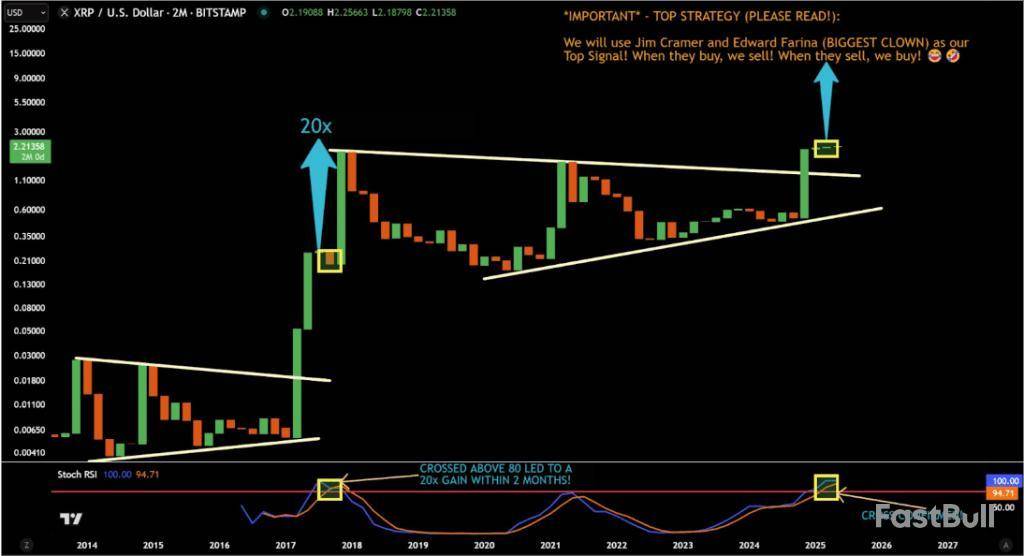
Technical analysis of XRP’s price action on the 2-month candlestick timeframe chart shows that the cryptocurrency is still trading in a bullish setup on a larger timeframe. This analysis, shared by crypto analyst JD on social media platform X, shows XRP breaking out from a long-term triangle pattern, which has held its price in consolidation since the 2018 peak.
The structure formed by this triangle includes a flat resistance trendline at the top and a gradually rising trendline at the bottom. XRP’s price performance in late 2024 saw it break above the upper resistance trendline, much like it did in a similar setup in the first few months of 2017.
Notably, the XRP price broke above this trendline with conviction, which allowed it to reach a multi-year high of $3.3. However, the ensuing price action has been corrections upon corrections, with XRP now trading close to the $2 price level.
Notwithstanding, the appearance of a bullish cross on the RSI means a bullish setup is still in action, with crypto analyst JD highlighting a potential 20x surge.
Stochastic RSI Cross Above 80: The Same Spark From 2017
The appearance of a cross on the Stochastic RSI above the 80 level makes the current bullish setup more convincing. JD pointed out that the last time this crossover happened was in 2017, right before XRP recorded a 20x gain within three months.
His chart illustrates this visually, showing a yellow highlight at the intersection point of the SRSI lines during that historic breakout. The same cross has now been confirmed on the 2-month chart.
The SRSI cross occurs when the %K line crosses above or below the %D line within the Stochastic RSI indicator. In the case of XRP, the bullish signal of the cross is examined above the 80 threshold on the 2-month chart. The last time this happened in 2017, XRP went on a rally over four months from around $0.15 until it reached its current all-time high of $3.40.
If a similar scenario were to unfold, this would put the target around $45. This may seem unrealistic, considering the inflows needed to reach this level. Nonetheless, a rally from the recent SRSI cross could send the XRP price to new all-time highs.
At the time of writing, XRP is trading at $2.2.
Featured image from Unsplash, chart from TradingView
Alongside the general crypto market, Ethereum (ETH) registered a significant market recovery at the end of April to return above $1,800. After an extensive price correction that began in December 2024, the prominent altcoin may have finally found some bullish momentum to turn around investors’ fortunes. Interestingly, prominent crypto analyst Burak Kesmeci has shed some positive light on this development.
Ethereum Retail Investor Inflows Support Bullish Case
In an X post on May 2, Burak Kesmeci postulates that Ethereum may be entering a prolonged price uptrend based on the short-term holders’ activity. According to the seasoned analyst, the number of ETH short-term holders or traders is headed for a particular threshold that historically signifies a long-term price rally.
In the ETH market, short-term holders refer to wallets or addresses that have recently acquired ETH, usually less than 155 days. These investors are usually sensitive to market trends and price volatility, often driven by speculation and quick profit-taking rather than long-term conviction.
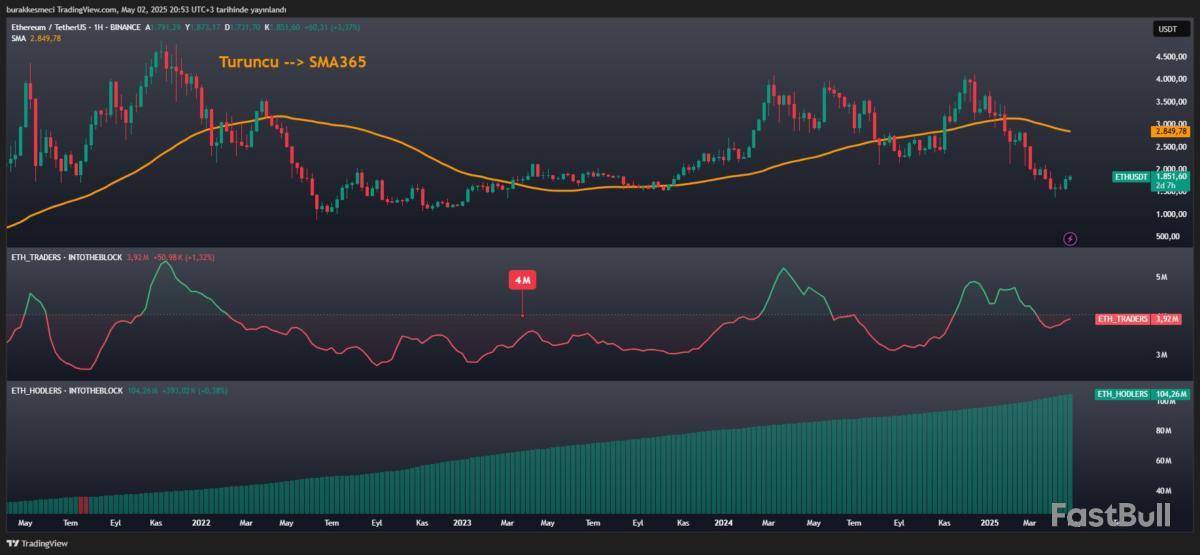
Typically, a rising number of short-term investors indicates renewed market interest due to new market entrants. However, Kesmeci states that ETH short-term holders, presently at 3.92 million, must cross above 4 million to suggest the ETH market possesses sufficient bullish strength for a robust uptrend. Notably, Ethereum produced strong price rallies when STH numbers previously rose above 4 million, as seen in 2022 and 2024. Kesmeci states that as long as ETH short-term holders remain below this threshold, it may reflect insufficient market demand to sustain Ethereum’s current rally.Meanwhile, the number of Ethereum long-term holders has now reached 104.24 million, indicating a strong market confidence in the asset’s price appreciation prospects. A rise in LTH generally occurs due to coin maturation as short-term holders opt against selling for over 155 days.
Ethereum SMA 365 Presents Another Barrier
Alongside developments in the short-term holders cohort, Burak Kesmeci notes that Ethereum remains far below its 365-day simple moving average (SMA 365), suggesting that market bulls are yet to take full control of the market. As the name implies, the SMA 365 measures the average closing price over the last 365 days. It is used to indicate price trends and often acts as a resistance in bearish markets or support in bullish markets. Despite recent market gains, ETH must move above its SMA 365 at $2,849 to confirm any intent of a strong uptrend. At press time, Ethereum trades at $1,835, reflecting a price decline of 0.80% in the past day. Meanwhile, the asset’s trading volume is down by 15.01%.
728 RM B 7/F GEE LOK IND BLDG NO 34 HUNG TO RD KWUN TONG KLN HONG KONG


White Label
Data API
Web Plug-ins
Poster Maker
Affiliate Program
The risk of loss in trading financial instruments such as stocks, FX, commodities, futures, bonds, ETFs and crypto can be substantial. You may sustain a total loss of the funds that you deposit with your broker. Therefore, you should carefully consider whether such trading is suitable for you in light of your circumstances and financial resources.
No decision to invest should be made without thoroughly conducting due diligence by yourself or consulting with your financial advisors. Our web content might not suit you since we don't know your financial conditions and investment needs. Our financial information might have latency or contain inaccuracy, so you should be fully responsible for any of your trading and investment decisions. The company will not be responsible for your capital loss.
Without getting permission from the website, you are not allowed to copy the website's graphics, texts, or trademarks. Intellectual property rights in the content or data incorporated into this website belong to its providers and exchange merchants.
Not Logged In
Log in to access more features

FastBull Membership
Not yet
Purchase


Log In
Sign Up


