• Trade
  • Markets
  • Copy
  • Contests
  • News
  • 24/7
  • Calendar
  • Q&A
  • Chats
Trending
Screeners
SYMBOL
LAST
BID
ASK
HIGH
LOW
NET CHG.
%CHG.
SPREAD
SPX
S&P 500 Index
6859.57
6859.57
6859.57
6878.28
6859.47
-10.83
-0.16%
--
DJI
Dow Jones Industrial Average
47802.88
47802.88
47802.88
47971.51
47771.72
-152.10
-0.32%
--
IXIC
NASDAQ Composite Index
23589.67
23589.67
23589.67
23698.93
23579.88
+11.56
+ 0.05%
--
USDX
US Dollar Index
99.090
99.170
99.090
99.090
98.730
+0.140
+ 0.14%
--
EURUSD
Euro / US Dollar
1.16274
1.16282
1.16274
1.16717
1.16273
-0.00152
-0.13%
--
GBPUSD
Pound Sterling / US Dollar
1.33127
1.33137
1.33127
1.33462
1.33126
-0.00185
-0.14%
--
XAUUSD
Gold / US Dollar
4178.35
4178.78
4178.35
4218.85
4175.92
-19.56
-0.47%
--
WTI
Light Sweet Crude Oil
58.964
58.994
58.964
60.084
58.892
-0.845
-1.41%
--

Community Accounts

Signal Accounts
--
Profit Accounts
--
Loss Accounts
--
View More

Become a signal provider

Sell trading signals to earn additional income

View More

Guide to Copy Trading

Get started with ease and confidence

View More

Signal Accounts for Members

All Signal Accounts

Best Return
  • Best Return
  • Best P/L
  • Best MDD
Past 1W
  • Past 1W
  • Past 1M
  • Past 1Y

All Contests

  • All
  • Trump Updates
  • Recommend
  • Stocks
  • Cryptocurrencies
  • Central Banks
  • Featured News
Top News Only
Share

The S&P 500 Opened 4.80 Points Higher, Or 0.07%, At 6875.20; The Dow Jones Industrial Average Opened 16.52 Points Higher, Or 0.03%, At 47971.51; And The Nasdaq Composite Opened 60.09 Points Higher, Or 0.25%, At 23638.22

Share

Reuters Poll - Swiss National Bank Policy Rate To Be 0.00% At End-2026, Said 21 Of 25 Economists, Four Said It Would Be Cut To -0.25%

Share

USGS - Magnitude 7.6 Earthquake Strikes Misawa, Japan

Share

Reuters Poll - Swiss National Bank To Hold Policy Rate At 0.00% On December 11, Said 38 Of 40 Economists, Two Said Cut To -0.25%

Share

Traders Believe There Is A 20% Chance That The European Central Bank Will Raise Interest Rates Before The End Of 2026

Share

Toronto Stock Index .GSPTSE Rises 11.99 Points, Or 0.04 Percent, To 31323.40 At Open

Share

Japan Meteorological Agency: A Tsunami With A Maximum Height Of Three Meters Is Expected Following The Earthquake In Japan

Share

Japan Meteorological Agency: A 7.2-magnitude Earthquake Struck Off The Coast Of Northern Japan, And A Tsunami Warning Has Been Issued

Share

Japan Finance Minister Katayama: G7 Expected To Hold Another Meeting By The End Of This Year

Share

The Japan Meteorological Agency Reported That An Earthquake Occurred In The Sea Near Aomori

Share

Japan Finance Minister Katayama: The G7 Finance Ministers' Meeting Discussed The Critical Mineral Supply Chain And Support For Ukraine

Share

Japan Finance Minister Katayama: Held Onlinemeeting With G7 Finance Ministers

Share

Fed Data - USA Effective Federal Funds Rate At 3.89 Percent On 05 December On $88 Billion In Trades Versus 3.89 Percent On $87 Billion On 04 December

Share

Chinese Foreign Minister Wang Yi: One-China Principle Is An Important Political Foundation For China-Germany Relations, And There Is No Room For Ambiguity

Share

Chinese Foreign Minister Wang Yi: Hopes Germany To Understand, Support China's Position Regarding Japan Prime Minister's Remark On Taiwan

Share

Chinese Foreign Minister Wang Yi: Hopes Germany Will View China More Objectively And Rationally, Adhere To The Positioning Of China-Germany Partnership

Share

China Foreign Ministry: China's Foreign Minister Wang Yi Meets German Counterpart

Share

Israeli Government Spokesperson: Netanyahu Will Meet Trump On December 29

Share

Stc Did Not Ask Internationally-Government To Leave Aden - Senior Stc Official To Reuters

Share

Members Of Internationally-Recognised Government, Opposed To Northern Houthis, Have Left Aden - Senior Stc Official To Reuters

TIME
ACT
FCST
PREV
France Trade Balance (SA) (Oct)

A:--

F: --

P: --
Euro Zone Employment YoY (SA) (Q3)

A:--

F: --

P: --
Canada Part-Time Employment (SA) (Nov)

A:--

F: --

P: --

Canada Unemployment Rate (SA) (Nov)

A:--

F: --

P: --

Canada Full-time Employment (SA) (Nov)

A:--

F: --

P: --

Canada Labor Force Participation Rate (SA) (Nov)

A:--

F: --

P: --

Canada Employment (SA) (Nov)

A:--

F: --

P: --

U.S. PCE Price Index MoM (Sept)

A:--

F: --

P: --

U.S. Personal Income MoM (Sept)

A:--

F: --

P: --

U.S. Core PCE Price Index MoM (Sept)

A:--

F: --

P: --

U.S. PCE Price Index YoY (SA) (Sept)

A:--

F: --

P: --

U.S. Core PCE Price Index YoY (Sept)

A:--

F: --

P: --

U.S. Personal Outlays MoM (SA) (Sept)

A:--

F: --

P: --
U.S. 5-10 Year-Ahead Inflation Expectations (Dec)

A:--

F: --

P: --

U.S. Real Personal Consumption Expenditures MoM (Sept)

A:--

F: --

P: --
U.S. Weekly Total Rig Count

A:--

F: --

P: --

U.S. Weekly Total Oil Rig Count

A:--

F: --

P: --

U.S. Consumer Credit (SA) (Oct)

A:--

F: --

P: --
China, Mainland Foreign Exchange Reserves (Nov)

A:--

F: --

P: --

Japan Trade Balance (Oct)

A:--

F: --

P: --

Japan Nominal GDP Revised QoQ (Q3)

A:--

F: --

P: --

China, Mainland Imports YoY (CNH) (Nov)

A:--

F: --

P: --

China, Mainland Exports (Nov)

A:--

F: --

P: --

China, Mainland Imports (CNH) (Nov)

A:--

F: --

P: --

China, Mainland Trade Balance (CNH) (Nov)

A:--

F: --

P: --

China, Mainland Exports YoY (USD) (Nov)

A:--

F: --

P: --

China, Mainland Imports YoY (USD) (Nov)

A:--

F: --

P: --

Germany Industrial Output MoM (SA) (Oct)

A:--

F: --

P: --
Euro Zone Sentix Investor Confidence Index (Dec)

A:--

F: --

P: --

Canada National Economic Confidence Index

A:--

F: --

P: --

U.K. BRC Like-For-Like Retail Sales YoY (Nov)

--

F: --

P: --

U.K. BRC Overall Retail Sales YoY (Nov)

--

F: --

P: --

Australia Overnight (Borrowing) Key Rate

--

F: --

P: --

RBA Rate Statement
RBA Press Conference
Germany Exports MoM (SA) (Oct)

--

F: --

P: --

U.S. NFIB Small Business Optimism Index (SA) (Nov)

--

F: --

P: --

Mexico 12-Month Inflation (CPI) (Nov)

--

F: --

P: --

Mexico Core CPI YoY (Nov)

--

F: --

P: --

Mexico PPI YoY (Nov)

--

F: --

P: --

U.S. Weekly Redbook Index YoY

--

F: --

P: --

U.S. JOLTS Job Openings (SA) (Oct)

--

F: --

P: --

China, Mainland M1 Money Supply YoY (Nov)

--

F: --

P: --

China, Mainland M0 Money Supply YoY (Nov)

--

F: --

P: --

China, Mainland M2 Money Supply YoY (Nov)

--

F: --

P: --

U.S. EIA Short-Term Crude Production Forecast For The Year (Dec)

--

F: --

P: --

U.S. EIA Natural Gas Production Forecast For The Next Year (Dec)

--

F: --

P: --

U.S. EIA Short-Term Crude Production Forecast For The Next Year (Dec)

--

F: --

P: --

EIA Monthly Short-Term Energy Outlook
U.S. API Weekly Gasoline Stocks

--

F: --

P: --

U.S. API Weekly Cushing Crude Oil Stocks

--

F: --

P: --

U.S. API Weekly Crude Oil Stocks

--

F: --

P: --

U.S. API Weekly Refined Oil Stocks

--

F: --

P: --

South Korea Unemployment Rate (SA) (Nov)

--

F: --

P: --

Japan Reuters Tankan Non-Manufacturers Index (Dec)

--

F: --

P: --

Japan Reuters Tankan Manufacturers Index (Dec)

--

F: --

P: --

Japan Domestic Enterprise Commodity Price Index MoM (Nov)

--

F: --

P: --

Japan Domestic Enterprise Commodity Price Index YoY (Nov)

--

F: --

P: --

China, Mainland PPI YoY (Nov)

--

F: --

P: --

China, Mainland CPI MoM (Nov)

--

F: --

P: --

Q&A with Experts
    • All
    • Chatrooms
    • Groups
    • Friends
    Connecting
    .
    .
    .
    Type here...
    Add Symbol or Code

      No matching data

      All
      Trump Updates
      Recommend
      Stocks
      Cryptocurrencies
      Central Banks
      Featured News
      • All
      • Russia-Ukraine Conflict
      • Middle East Flashpoint
      • All
      • Russia-Ukraine Conflict
      • Middle East Flashpoint
      Search
      Products

      Charts Free Forever

      Chats Q&A with Experts
      Screeners Economic Calendar Data Tools
      Membership Features
      Data Warehouse Market Trends Institutional Data Policy Rates Macro

      Market Trends

      Market Sentiment Order Book Forex Correlations

      Top Indicators

      Charts Free Forever
      Markets

      News

      News Analysis 24/7 Columns Education
      From Institutions From Analysts
      Topics Columnists

      Latest Views

      Latest Views

      Trending Topics

      Top Columnists

      Latest Update

      Signals

      Copy Rankings Latest Signals Become a signal provider AI Rating
      Contests
      Brokers

      Overview Brokers Assessment Rankings Regulators News Claims
      Broker listing Forex Brokers Comparison Tool Live Spread Comparison Scam
      Q&A Complaint Scam Alert Videos Tips to Detect Scam
      More

      Business
      Events
      Careers About Us Advertising Help Center

      White Label

      Data API

      Web Plug-ins

      Affiliate Program

      Awards Institution Evaluation IB Seminar Salon Event Exhibition
      Vietnam Thailand Singapore Dubai
      Fans Party Investment Sharing Session
      FastBull Summit BrokersView Expo
      Recent Searches
        Top Searches
          Markets
          News
          Analysis
          User
          24/7
          Economic Calendar
          Education
          Data
          • Names
          • Latest
          • Prev

          View All

          No data

          Scan to Download

          Faster Charts, Chat Faster!

          Download App
          English
          • English
          • Español
          • العربية
          • Bahasa Indonesia
          • Bahasa Melayu
          • Tiếng Việt
          • ภาษาไทย
          • Français
          • Italiano
          • Türkçe
          • Русский язык
          • 简中
          • 繁中
          Open Account
          Search
          Products
          Charts Free Forever
          Markets
          News
          Signals

          Copy Rankings Latest Signals Become a signal provider AI Rating
          Contests
          Brokers

          Overview Brokers Assessment Rankings Regulators News Claims
          Broker listing Forex Brokers Comparison Tool Live Spread Comparison Scam
          Q&A Complaint Scam Alert Videos Tips to Detect Scam
          More

          Business
          Events
          Careers About Us Advertising Help Center

          White Label

          Data API

          Web Plug-ins

          Affiliate Program

          Awards Institution Evaluation IB Seminar Salon Event Exhibition
          Vietnam Thailand Singapore Dubai
          Fans Party Investment Sharing Session
          FastBull Summit BrokersView Expo

          The Truth About Ripple (XRP) ETFs: Should You Be Worried?

          CryptoPotato
          1inch / Tether
          -1.39%
          AAVE / Tether
          +4.16%
          Acala / Tether
          -5.42%
          Fusionist / Tether
          -7.89%
          Alchemy Pay / Tether
          +0.23%

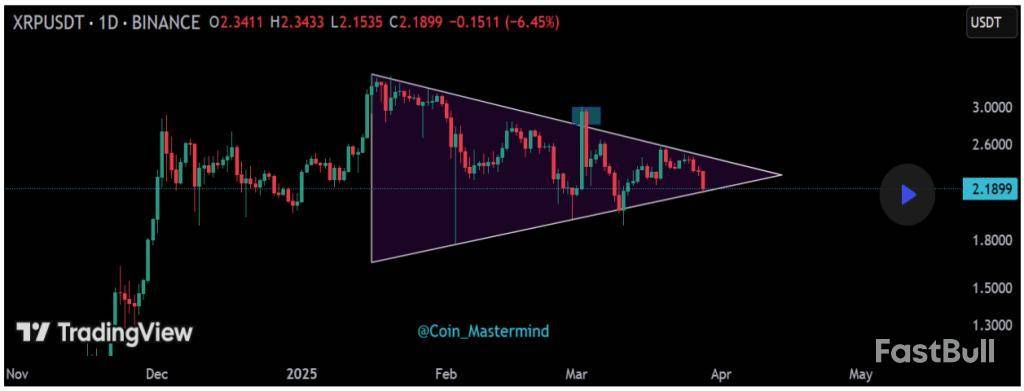
          XRP’s price has been one of the hottest topics for discussion amongst the crypto community for a while now and that’s understandable.

          After all, it’s an O.G. cryptocurrency that’s here for the past few cycles, but it’s status has been debated at length, especially during Ripple’s legal battle with the US Securities and Exchange Commission. The outcome of this was long touted as a massive catalyst for XRP’s price and it appears that the dispute has reached a turning point and one that is seemingly in favor of the company.XRP and the Outcome of the Ripple v. SEC Lawsuit

          Just recently, Brad Garlinghouse,took it to social mediato share the big news – the Commission quit the pursue of its appeal, essentially putting a de-facto end to the lawsuit – the moment the community was waiting for.

          There it was – the massive catalyst everyone was waiting for, so how did the XRP price react? Initially, there was a sruge, but things calmed down almost immediately and the price has since retraced to the levels from before the self-proclaimed victory.

          This begs the question – what now? Well, it appears that the market is chasing the next potential catalyst – namely, the approval of spot XRP exchange-traded funds in the US.XRP ETFs: The Reality

          Multiple high-profile asset managers have filed applications for the approval of a spot XRP ETF in the United States, the majority of which are awaiting decision by the end of this year. The list includes, but is not limited to Franklin Templeton, Grayscale, Bitwise, Canary Capital, and so forth.

          Many industry expertsare of the opinionthat following Ripple’s de-facto victory in the battle against the US Securities and Exchange Commission, the path to an approval is more or less paved. Why? Well, according to the standing decision of Judge Analisa Torres, XRP sales on the secondary market to regular users do not constitute an investment contract.

          But is the approval of an XRP ETF a potential catalyst for a surge in its price? This depends on one major factor – demand.

          BTC has seen a massively healthy flow in spot-based ETF products since their inception (with the occasional market-drive exceptions), but that’s because of its nature and widely-accepted status of a digital store of value. Its supply is fairly distributed with no single entity controling a dominant share, which is the absolute opposite for ripple.

          XRP’s supply is heavily concentrated and the company behind it – Ripple – controls the market – it’s as simple as that. No locking structures and promises can change the fact that there’s a single centralized entity capable of shifting the market dynamics at any time – something that could be seen as a major deterrent for serious investors even upon the potential approval of a spot XRP ETF.

          And while a short-term surge is likely a given, the longer-term impact on ETFs on XRP’s price is far from certain.

          Risk Warnings and Disclaimers
          You understand and acknowledge that there is a high degree of risk involved in trading. Following any strategies or investment methods may lead to potential losses. The content on the site is provided by our contributors and analysts for information purposes only. You are solely responsible for determining whether any trading assets, securities, strategy, or any other product is suitable for investing based on your own investment objectives and financial situation.
          Add to Favorites
          Share

          Has 20,000,000th Bitcoin Been Mined?

          U.Today
          1inch / Tether
          -1.39%
          AAVE / Tether
          +4.16%
          Acala / Tether
          -5.42%
          Fusionist / Tether
          -7.89%
          Alchemy Pay / Tether
          +0.23%

          Jameson Lopp, an American cypherpunk and software engineer, has recently noted that Bitbo, a popular real-time dashboard for on-chain data, is incorrectly displaying the total number of Bitcoins.

          The most recent data shows that there are already 20,000,543 coins in existence, meaning that the 20-millionth Bitcoin was mined during this weekend.

          However, this is not the case. According to Lopp, the error is likely due to Bitbo running some proprietary calculation rather than querying a full node.

          For now, Bitcoin's total supply stands at 19,843,807 coins, while 1,155,974 coins are yet to be mined.

          On average, Bitcoin adds roughly 900 coins to its supply per day.

          Last million

          Lopp has estimated that the 20-millionth Bitcoin is still about a year away from now. The mining of that coin will represent a groundbreaking milestone for the original cryptocurrency, which is widely considered to be a digital version of gold.

          Roughly 99% of Bitcoin's total circulating supply will be mined in about a decade from now. Bitcoin inflation will be over in just a few more halving events.

          The last Bitcoin ever will be mined in more than a century from now, when the very last halving event takes place.

          Millions of lost coins

          There are also millions of lost Bitcoins in wallets that have been inactive for decades. While many such long-dormant addresses do end up getting reactivated for unknown reasons, such cases are relatively rare. Hence, it is likely that a big chunk of Bitcoin's total supply has indeed been lost or abandoned.

          Satoshi Nakamoto, the mysterious creator of the original cryptocurrency, has supposedly mined roughly a million coins.

          Risk Warnings and Disclaimers
          You understand and acknowledge that there is a high degree of risk involved in trading. Following any strategies or investment methods may lead to potential losses. The content on the site is provided by our contributors and analysts for information purposes only. You are solely responsible for determining whether any trading assets, securities, strategy, or any other product is suitable for investing based on your own investment objectives and financial situation.
          Add to Favorites
          Share

          XRP On The Edge: Will Support Hold Or Unleash A Breakdown?

          NewsBTC
          1inch / Tether
          -1.39%
          AAVE / Tether
          +4.16%
          Acala / Tether
          -5.42%
          Fusionist / Tether
          -7.89%
          Alchemy Pay / Tether
          +0.23%

          XRP has been on a consistent downward trend since the beginning of the just concluded week. A steady flow of consecutive bearish candles on the daily timeframe has pulled the price lower each day, eventually guiding it toward an important support at the time of writing.

          As of now, XRP is pressing against the lower boundary of a symmetrical triangle, which could determine whether this dip becomes a deeper fall or the start of a rebound for the cryptocurrency.

          Symmetrical Triangle Support In Focus

          The symmetrical triangle on XRP’s daily chart is not a new pattern, but the way its price is currently interacting with its lower trendline is setting the stage for what could be a significant move. This interesting phenomenon was noted by a crypto analyst on the TradingView platform, who highlighted this technical zone as a critical decision point for XRP.

          As shown in the chart below, the symmetrical triangle has been forming gradually since January, with the price oscillating between a sequence of lower highs and higher lows. This has led to a tightening range that hints at an impending breakout or breakdown.

          The pattern’s base support line has been tested on three separate occasions over the past couple of months, each time resulting in a bounce upward. However, the persistence of retests also means the current retest might be broken easily.

          Where Can XRP Go From Here?

          If XRP manages to hold its ground at this support level and attract buying interest, a bounce could be on the cards. A successful rebound from this trendline might trigger a move toward the triangle’s upper boundary, which is acting as resistance.

          Such a rally wouldn’t just keep the triangle intact, but it could also bring in bullish sentiment after four weeks of selling pressure. Still, the strength of any bounce will likely hinge on the accompanying trading volume. A bounce without a strong trading volume could result in a fake breakout.

          However, the opposite scenario is just as likely. If XRP closes the daily candlestick below this support level, it would confirm a breakdown from the triangle structure, opening the door to further downside. As the analyst noted, “losing support may lead to further downside pressure.”

          A breakdown would not only invalidate the consolidation structure but could also trigger stop-loss orders below support. Given the lack of immediate strong support beneath the current zone, XRP might face a strong decline to $2 if the support level fails to hold.

          At the time of writing, XRP is trading at $2.18, having increased by 3.8% in the past 24 hours. Interestingly, the price dipped slightly below the lower boundary of the triangle earlier in the day. However, this move was quickly met with buying pressure, pushing the price action back into the triangle’s range. This small yet important action shows that bulls are still active at this level.

          Featured image from Pexels, chart from TradingView

          Risk Warnings and Disclaimers
          You understand and acknowledge that there is a high degree of risk involved in trading. Following any strategies or investment methods may lead to potential losses. The content on the site is provided by our contributors and analysts for information purposes only. You are solely responsible for determining whether any trading assets, securities, strategy, or any other product is suitable for investing based on your own investment objectives and financial situation.
          Add to Favorites
          Share

          Whale Opens $27.53 Million Leveraged PEPE Long on Hyperliquid

          Beincrypto
          1inch / Tether
          -1.39%
          AAVE / Tether
          +4.16%
          Acala / Tether
          -5.42%
          Fusionist / Tether
          -7.89%
          Alchemy Pay / Tether
          +0.23%

          A crypto whale’s high-stakes, 10x leveraged PEPE position on Hyperliquid faces mounting risk. The whale’s leveraged PEPE bet remains precarious, risking liquidation amid market instability.

          With added margin but persistent losses, any adverse price move could trigger cascading sell-offs and broader crypto turbulence.

          Whale Opens 10X Leverage on PEPE

          Crypto and DeFi analyst Ai revealed a notable gamble by a whale trader, placing a high-stakes bet on the PEPE meme coin. They opened a 10x leveraged long position worth $27.53 million on the Hyperliquid network.

          However, the trade quickly turned against them, with unrealized losses amounting to $3.238 million.

          The whale, identified by the address 0x507…BeDb6 initiated the position on March 24 at an entry price of $0.00814 per 1,000 PEPE. As it stands, they are now at risk of liquidation should the price fall to $0.005219.

          To prevent forced closure, they have added 3.818 million USDC in margin (approximately $3.8 million).

          Whale’s leveraged 10X PEPE bet on Hyperliquid

          The precarious nature of the position raises concerns about the broader risks to PEPE’s market stability and the implications for leveraged trading on Hyperliquid.

          Using 10X leverage dramatically amplifies potential gains and losses, making this a highly volatile bet. Even minor price fluctuations can lead to significant swings in the whale’s account balance.

          If PEPE’s price continues to decline and reaches the liquidation threshold, Hyperliquid’s automated systems will forcibly close the position.

          This could further drive down PEPE’s price. Such liquidations often lead to cascading sell-offs as other leveraged traders get caught in a feedback loop, exacerbating market volatility.

          Meanwhile, the whale’s decision to inject more margin suggests they are committed to defending their position. However, this also signals the pressure they are under to maintain solvency.

          What Are the Perceived Risks?

          PEPE’s inherent volatility adds another layer of risk. As a meme coin, its price movements are often driven by social sentiment rather than fundamental value. This makes it particularly vulnerable to quick price swings, which could trouble the whale’s position.

          If negative market sentiment prevails due to external factors such as regulatory news or shifting trader interest, PEPE’s price could decline further.

          Given that the market has already been experiencing a downturn, the likelihood of additional price pressure remains a significant concern.

          Another critical issue is the potential for whale-induced market manipulation. Large-scale traders have the power to sway market trends, either through direct trades or by influencing sentiment.

          By continuously adding margin to avoid liquidation, the whale may attempt to prop up PEPE’s price and prevent a major sell-off.

          However, such efforts can only go so far. If the whale ultimately exits their position, it could trigger panic among smaller traders, leading to a rapid decline in PEPE’s value.

          The broader impact on retail investors closely tracking whale activity could exacerbate instability.

          The risks associated with liquidation cascades also cannot be ignored. Hyperliquid’s decentralized liquidation mechanism allows efficient order processing.

          However, a large liquidation can spark a chain reaction in highly leveraged markets.

          PEPE Price Performance

          The PEPE price has fallen by over 5% in the last 24 hours and was trading for $0.00000721 as of this writing.

          If PEPE’s price nears the whale’s liquidation point, other traders may begin preemptively selling to avoid losses, creating a snowball effect.

          This could result in PEPE experiencing sharp price declines quickly, potentially affecting other meme coins and broader crypto markets.

          KOL Opens Similar Leverage Position for Ethereum

          The risks are not limited to PEPE alone. A similar situation is unfolding with another prominent trader, CBB, a Key Opinion Leader (KOL) on X. They opened a 10X leveraged long position on Ethereum worth $2.11 million.

          Currently, they are facing an unrealized loss of $1.035 million due to an entry price of $2,730. Given current market conditions, this has proven to be too high.

          However, unlike the PEPE whale, this trader has a more comfortable margin buffer, with a liquidation price of $1,167.8.

           KOL takes a 10X leverage position on Ethereum

          While not in immediate danger, this case further reflects the precarious nature of highly leveraged trading in volatile markets.

          The unfolding drama surrounding these positions highlights the risks of excessive leverage, particularly in a declining market.

          With PEPE’s whale struggling to maintain their position and Ethereum’s long traders facing mounting losses, the broader crypto market could see increased volatility in the coming days.

          Risk Warnings and Disclaimers
          You understand and acknowledge that there is a high degree of risk involved in trading. Following any strategies or investment methods may lead to potential losses. The content on the site is provided by our contributors and analysts for information purposes only. You are solely responsible for determining whether any trading assets, securities, strategy, or any other product is suitable for investing based on your own investment objectives and financial situation.
          Add to Favorites
          Share

          Ethereum MVRV Ratio Nears 160-Day MA Crossover – Accumulation Trend Ahead?

          NewsBTC
          1inch / Tether
          -1.39%
          AAVE / Tether
          +4.16%
          Acala / Tether
          -5.42%
          Fusionist / Tether
          -7.89%
          Alchemy Pay / Tether
          +0.23%

          Ethereum is once again under heavy selling pressure after losing the critical $2,000 level — a psychological and technical zone that bulls have struggled to defend in recent weeks. With price action turning increasingly bearish, investor sentiment is weakening, and analysts are warning that a deeper correction may be on the horizon. As Ethereum slides lower, concerns are growing across the broader crypto market, which often relies on ETH’s strength to lead recovery phases.

          The current situation is both tense and delicate. Ethereum’s inability to hold key support levels has rattled short-term holders and is now testing the resolve of long-term investors. Many are now closely watching for any signs of stabilization or fresh accumulation.

          One promising on-chain signal comes from Glassnode’s MVRV (Market Value to Realized Value) metric. Historically, a crossover of the MVRV ratio above its 160-day moving average has marked the beginning of strong Ethereum accumulation zones — often preceding significant price rebounds. That signal is now approaching once again, and if confirmed, it could offer a glimmer of hope to bulls waiting for a shift in momentum. Until then, Ethereum remains in a fragile state.

          Ethereum Faces Critical Breakdown As Accumulation Signal Nears

          Ethereum is now in a critical position, with bulls continuing to lose control as key support levels break one by one. Selling pressure has intensified over the past few weeks, dragging ETH further into a prolonged downtrend that began in late December. Macroeconomic uncertainty, rising interest rates, and heightened global tensions continue to create a hostile environment for risk assets — and the crypto market has felt the impact most severely.

          Currently, Ethereum is trading 55% below its local high of $4,100, reached earlier this cycle. The sharp decline has shaken investor confidence, and the continued breakdown in price structure leaves little room for error. Without a swift recovery and strong defense of support zones, Ethereum risks further downside, with analysts warning of continued weakness if sentiment doesn’t shift soon.

          Amid the decline, some analysts are watching closely for signs of a potential bottom. Top analyst Ali Martinez shared a key insight on X, pointing to the MVRV (Market Value to Realized Value) ratio as a reliable indicator of accumulation zones. According to Martinez, when the MVRV ratio crosses above its 160-day moving average, it has historically marked strong accumulation phases — moments when long-term investors begin quietly positioning for the next leg higher.

          Ethereum MVRV Momentum | Source: Ali Martinez on X

          This crossover has not yet occurred, but it is approaching. If confirmed, it could signal that Ethereum is entering a high-value zone despite the current bearish conditions. While the market remains fragile, such on-chain metrics offer a glimmer of hope that accumulation is quietly underway — even as price action continues to look weak on the surface. Bulls will need to act quickly to reverse the trend, but for now, Ethereum’s outlook remains on edge.

          Bulls Defend Crucial $1,800 Support

          Ethereum is trading at $1,830 after suffering a sharp 14% drop since last Monday, reflecting renewed selling pressure across the crypto market. The steep decline has pushed ETH toward a critical support level at $1,800 — a zone that now stands as a must-hold for bulls. This level has historically acted as a strong pivot point, and losing it could trigger a deeper correction.

          ETH testing critical demand levels | Source: ETHUSDT chart on TradingView

          If ETH fails to hold above $1,800, the next significant support lies near the $1,500 zone, which would mark a dramatic shift in market structure and likely accelerate bearish sentiment. A breakdown to this level would erase much of the year’s gains and deal a serious blow to investor confidence.

          However, if bulls manage to defend $1,800 successfully, a rebound could follow, potentially pushing ETH back above the $2,000 mark. Reclaiming this psychological level would help restore momentum and open the door for a broader recovery.

          The next few days will be crucial for Ethereum’s short-term outlook. With macroeconomic uncertainty still looming, bulls must step in with conviction — because if $1,800 breaks, the fall could be fast and steep.

          Featured image from Dall-E, chart from TradingView

          Risk Warnings and Disclaimers
          You understand and acknowledge that there is a high degree of risk involved in trading. Following any strategies or investment methods may lead to potential losses. The content on the site is provided by our contributors and analysts for information purposes only. You are solely responsible for determining whether any trading assets, securities, strategy, or any other product is suitable for investing based on your own investment objectives and financial situation.
          Add to Favorites
          Share

          Ethereum’s Underdog Edge: Can the Largest Altcoin Roar Back in a Bitcoin-Heavy Era?

          Beincrypto
          1inch / Tether
          -1.39%
          AAVE / Tether
          +4.16%
          Acala / Tether
          -5.42%
          Fusionist / Tether
          -7.89%
          Alchemy Pay / Tether
          +0.23%

          Ethereum is still a leader in decentralized finance (DeFi) and smart contract applications, but it’s at a crossroads. The community has questioned Ethereum’s relevance in the shifting crypto industry, putting the altcoin’s future under intense scrutiny.

          Mainstream narratives paint a dark picture of Ethereum’s developer exodus and underperformance.

          Is Ethereum Getting Left Behind?

          Critics reflect how Bitcoin’s ideological and political dominance, particularly after President Donald Trump’s pro-crypto stance, overshadowed Ethereum’s early promise of a global, decentralized computer.

          Ethereum’s price downturn — down 44% in 2025 — is being driven by the exodus of developers, and network activity dropping 17% last year.

          In contrast, Solana has spiked with an 83% uptick in developer engagement, partly driven by its adoption of meme coins and fast transaction speeds.

          Standard Chartered analysts also cut their end-of-year Ether price forecast by 60%, based on what they told clients was Ethereum’s “identity crisis” and unclear direction forward.

          Standard Chartered revises Ethereum forecast

          Ethereum’s co-founder, Vitalik Buterin, acknowledged the growing criticism but rejected demands for quick fixes.

          He reiterated Ethereum’s trajectory hinges on “long-term value” and real-world utility, not short-term speculation or political power.

          “The only thing that can move Ethereum forward at this point is things that give long term value in a way where you can clearly see that the value is coming from a thing that is actually sustainable — like actual use for people,” Bloomberg reported citing Buterin.

          Grassroots Push: Ethereum’s Loyalists See Opportunity

          Despite growing critics, Ethereum’s most diehard supporters remain undeterred. They view the pessimism around the largest altcoin by market cap metrics as an inflection point for a turnaround.

          “This is a bottom signal. Mainstream media almost always get the timing wrong,” a user on X remarked.

          Ethereum Layer-2 (L2) solutions continue to dominate chain activity, while real-world asset (RWA) growth on Ethereum looks “exponential,” the user added.

          Other users also reacted to the Bloomberg article, which renewed bullishness.

          “Was starting to feel bearish but this post has me all bulled up again,” one added in a post.

          These responses, among others, speak to Ethereum’s strong community, which has tended to shine in the face of adversity and innovation.

          There is no political spectacle for Ethereum, unlike Bitcoin, with growth hinging on scalability and real-world use.

          Recently, Buterin outlined a roadmap to Ethereum’s L2 ecosystem, calling for funding of open-source development to guarantee continued progress.

          His vision is already coming to fruition as projects like Celo successfully transition to Ethereum layer-2 solutions. As BeInCrypto reported, Celo completed the migration after 20 months of testing, which aimed to improve scalability and transaction efficiency.

          Adoption of Ethereum’s L2 scaling solutions, such as Arbitrum, Optimism, and Polygon, has also increased.

          This aligns with Buterin’s perspective that sustainable blockchain growth comes from strengthened infrastructures, not hype-driven narratives.

          These moves indicate that while speculation on Ethereum may be declining, long-term technological adoption could pick up the slack.

          Can the Pectra Upgrade Flip the Narrative?

          Likewise, Ethereum managed to overcome challenges through significant upgrades. Against that backdrop, its soon-to-be-released Pectra Upgrade could be revolutionary.

          Though delays have frustrated some in the community, the upgrade is anticipated to offer improved security, transaction efficiency, and developer-friendly tools.

          Ethereum’s continued commitment to innovation and ongoing testnet trials may be the perfect catalyst for reclaiming its DeFi throne. The network’s dominance in decentralized finance (DeFi) and NFT (non-fungible tokens) ecosystems proves particularly resilient.

          Indeed, meme coins and speculative trading have shifted to faster chains such as Solana.

          That said, when it comes to high-value applications, Ethereum is still at the heart of it all — from decentralized exchanges (DEXs) to institutional-grade financial products.

          The question now, however, is whether Ethereum’s focus on real-world adoption can preserve and outlast Bitcoin’s dominance in the halls of political and financial attention.

          With the Pectra upgrade on the horizon and a community loyal to the chain’s dominance in the ecosystem, Ethereum may soon show again that its greatest strength lies not in the hype but in resilience and innovation.

          Ethereum (ETH) Price Performance

          Despite community optimism, Ethereum’s price is down by 2.22% in the last 24 hours. BeInCrypto data shows ETH was trading for $1,842 as of this writing.

          Risk Warnings and Disclaimers
          You understand and acknowledge that there is a high degree of risk involved in trading. Following any strategies or investment methods may lead to potential losses. The content on the site is provided by our contributors and analysts for information purposes only. You are solely responsible for determining whether any trading assets, securities, strategy, or any other product is suitable for investing based on your own investment objectives and financial situation.
          Add to Favorites
          Share

          Legendary Trader Brandt Warns This Bitcoin Pattern Could Be a Trap

          U.Today
          1inch / Tether
          -1.39%
          AAVE / Tether
          +4.16%
          Acala / Tether
          -5.42%
          Fusionist / Tether
          -7.89%
          Alchemy Pay / Tether
          +0.23%

          A seemingly bullish Bitcoin pattern could end up being a trap, according to recent analysis offered by prominent chartist Peter Brandt.

          The largest cryptocurrency by market capitalization has now formed the inverse head-and-shoulders pattern on the daily chart, which is typically believed to be a sign of bullish reversal. However, there is a catch: The pattern that the Bitcoin price is currently developing has a downward-sloping neckline.BINANCE:BTCUSDT " data-caption="Image by @PeterLBrandt">

          Brandt, who has more than four decades of experience as a commodity trader, says that he prefers H&S patterns with horizontal necklines since they are significantly more reliable.

          The downward-sloping neckline means that the cryptocurrency's bullish momentum is possibly waning due to the lack of aggressive buying. Hence, one should not rule out that any future breakout will end up being a fakeout, with the price plunging back below the neckline of the pattern.

          Plunging back to $60,000?

          Prominent trader Josh Olszewicz has also taken note of the bullish pattern on the one-day chart in a recent social media post. He is seemingly convinced that this could be the last opportunity for the bulls to step up. Otherwise, Bitcoin could be at risk of collapsing back to the $60,000-$70,000 range.

          #333kByJuly2025
          @CarpeNoctom

          1D $BTC

          last call for the bulls on this iH&S here, else we fall back into the prev range (60-70k)

          going into april 2nd we'll see just how much tariff news was already priced in...or not pic.twitter.com/4pqwuVA8oq

          Mar 29, 2025

          According to data provided by CoinGecko, Bitcoin is currently trading at $83,091 after losing 0.7% over the past 24 hours. Earlier this Sunday, the cryptocurrency reached an intraday low of $81,769.

          The cryptocurrency is struggling to revive its bullish momentum, with global trade tensions putting extreme pressure on risk-on assets.

          Risk Warnings and Disclaimers
          You understand and acknowledge that there is a high degree of risk involved in trading. Following any strategies or investment methods may lead to potential losses. The content on the site is provided by our contributors and analysts for information purposes only. You are solely responsible for determining whether any trading assets, securities, strategy, or any other product is suitable for investing based on your own investment objectives and financial situation.
          Add to Favorites
          Share
          FastBull
          Copyright © 2025 FastBull Ltd

          728 RM B 7/F GEE LOK IND BLDG NO 34 HUNG TO RD KWUN TONG KLN HONG KONG

          TelegramInstagramTwitterfacebooklinkedin
          App Store Google Play Google Play
          Products
          Charts

          Chats

          Q&A with Experts
          Screeners
          Economic Calendar
          Data
          Tools
          Membership
          Features
          Function
          Markets
          Copy Trading
          Latest Signals
          Contests
          News
          Analysis
          24/7
          Columns
          Education
          Company
          Careers
          About Us
          Contact Us
          Advertising
          Help Center
          Feedback
          User Agreement
          Privacy Policy
          Business

          White Label

          Data API

          Web Plug-ins

          Poster Maker

          Affiliate Program

          Risk Disclosure

          The risk of loss in trading financial instruments such as stocks, FX, commodities, futures, bonds, ETFs and crypto can be substantial. You may sustain a total loss of the funds that you deposit with your broker. Therefore, you should carefully consider whether such trading is suitable for you in light of your circumstances and financial resources.

          No decision to invest should be made without thoroughly conducting due diligence by yourself or consulting with your financial advisors. Our web content might not suit you since we don't know your financial conditions and investment needs. Our financial information might have latency or contain inaccuracy, so you should be fully responsible for any of your trading and investment decisions. The company will not be responsible for your capital loss.

          Without getting permission from the website, you are not allowed to copy the website's graphics, texts, or trademarks. Intellectual property rights in the content or data incorporated into this website belong to its providers and exchange merchants.

          Not Logged In

          Log in to access more features

          FastBull Membership

          Not yet

          Purchase

          Become a signal provider
          Help Center
          Customer Service
          Dark Mode
          Price Up/Down Colors

          Log In

          Sign Up

          Position
          Layout
          Fullscreen
          Default to Chart
          The chart page opens by default when you visit fastbull.com