


- EURUSD
- XAUUSD
- XAGUSD
- WTI
- USDX


Markets
Analysis
User
24/7
Economic Calendar
Education
Data
- Names
- Latest
- Prev


Bitcoin treasuries in 2025: A corporate reserve strategy under pressure
By 2025, the Bitcoin treasury model has reached critical mass. Over 250 organizations, including public companies, private firms, ETFs and pension funds, now hold BTC on their balance sheets.
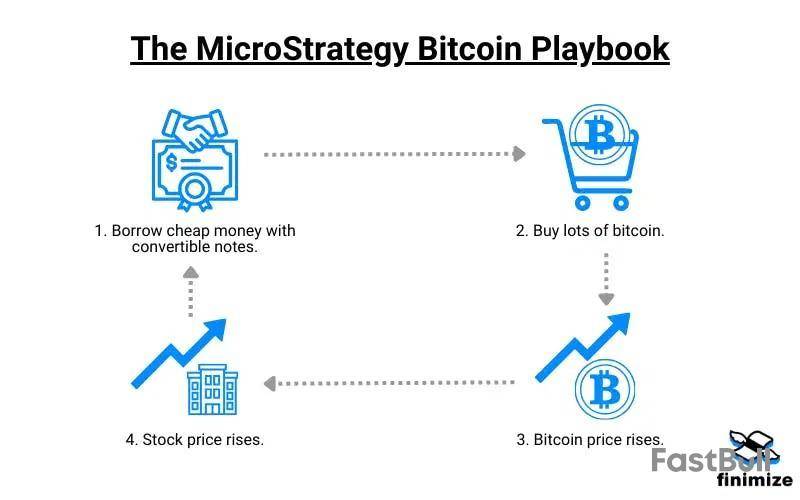
The Bitcoin treasury model trend was ignited by Michael Saylor’s Bitcoin plan, with Strategy pioneering the use of Bitcoin as a corporate reserve asset in 2020.
What began as a hedge against inflation evolved into a financial playbook adopted by a new class of Bitcoin holding companies, some structured to resemble quasi-exchange-traded funds (ETFs).
Strategy’s Bitcoin strategy remains the most high-profile, yet the wider BTC corporate treasury movement now faces growing strain. The model relies on a simple thesis: raise capital, convert it into a supply-capped crypto asset and wait for long-term appreciation.
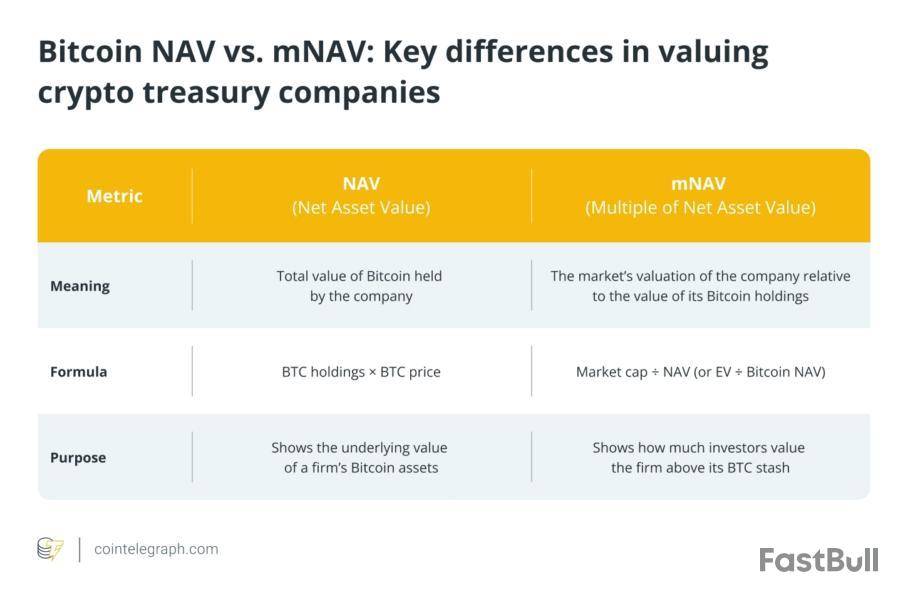
However, volatility in Bitcoin’s price exposes these companies to significant Bitcoin corporate treasury risks. Let’s suppose that a company’s stock price slips too close to (or below) the value of its underlying Bitcoin, known as its Bitcoin-per-share metric or net asset value (NAV).
Once that multiple of NAV (mNAV) premium evaporates, investor confidence collapses. MNAV measures how much the market values a Bitcoin-holding company relative to the value of its BTC reserves.
A recent Breed VC Bitcoin report outlines how this scenario can trigger a BTC NAV death spiral: declining prices erode NAV, cut off equity or debt funding and force distressed companies to sell their Bitcoin into a falling market, accelerating the downturn.
Did you know? MNAV (multiple of net asset value) shows how much more (or less) the market values a Bitcoin-holding company than its actual BTC stash. It’s calculated as: mNAV = Enterprise Value ÷ Bitcoin NAV.
BTC NAV risk: The mNAV death spiral, explained
The “death spiral” begins with a sharp drop in Bitcoin’s price. This reduces a company’s NAV premium (the valuation buffer that gives its shares lift).
As the market cap contracts, access to new capital tightens. Without equity buyers or lenders, companies can’t expand their holdings or refinance existing Bitcoin debt financing. For companies built on this BTC equity vs. debt strategy, the cracks start to show.
If loans mature or margin calls hit, forced liquidations follow. Selling BTC to meet obligations depresses the asset’s price further, dragging other companies closer to their own spiral. In this environment, even minor shocks can set off cascading failures.
The Breed VC report warns that only companies maintaining a strong mNAV premium and growing their Bitcoin-per-share holdings consistently can escape collapse. Others may be acquired or go under, prompting further industry consolidation.
Fortunately, most Bitcoin treasuries in 2025 still rely on equity financing rather than high leverage. This lowers contagion risk, as shareholder losses are more likely than systemic fallout.
Still, the situation could change. A pivot toward aggressive borrowing would raise the stakes. If heavily leveraged entities unwind, they could endanger creditors, spread damage through the market and undermine long-term faith in the Bitcoin treasury model.
Even now, tracking sites like BitcoinTreasuries.org show growing divergence: While Strategy’s BTC performance remains resilient, weaker imitators are faltering.
As ETF and pension fund BTC exposure rises, the pressure to separate disciplined execution from blind accumulation has never been greater.
Did you know? BTC buys by treasury companies barely move the market, usually. Corporate Bitcoin purchases typically affect less than 1% of daily volume (except on days when Strategy buys, when they’ve accounted for up to around 9%).
Strategy’s Bitcoin plan: Why Saylor’s treasury model still works
While the broader Bitcoin treasury model is showing cracks, Strategy’s Bitcoin strategy continues to stand out as a rare success.
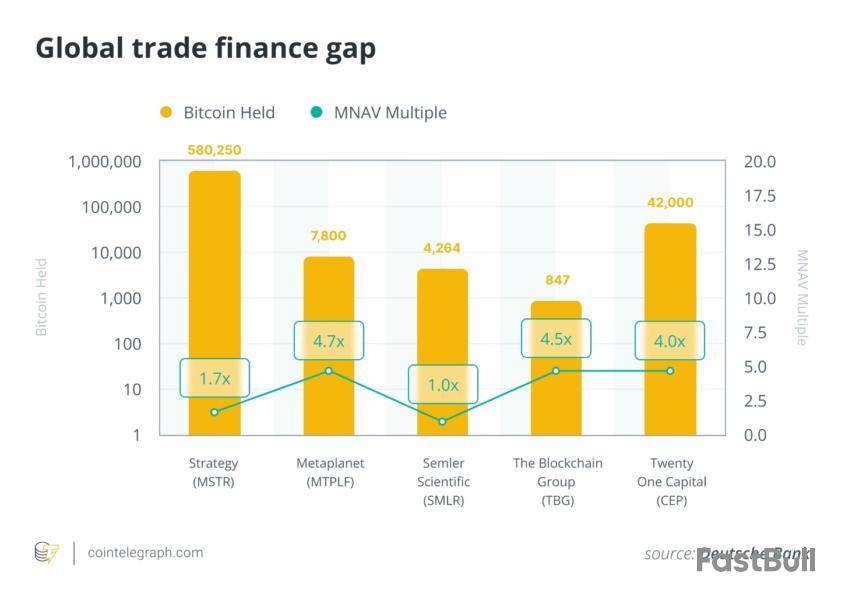
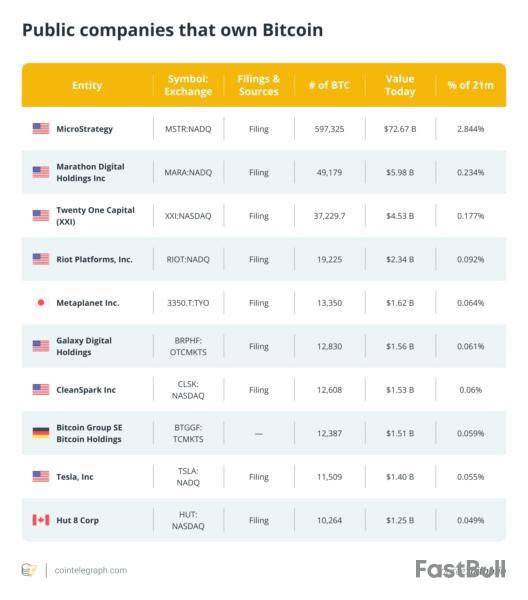
Under Michael Saylor’s Bitcoin plan, the company has methodically built a dominant position, holding over half a million BTC by mid-2025, more than half of all Bitcoin held by public companies.
Crucially, Strategy’s stock still trades at a significant premium to its Bitcoin NAV (typically 1.7-2.0x its underlying NAV). This mNAV premium signals sustained investor confidence, based not just on its BTC holdings but on the company’s ability to keep growing its Bitcoin-per-share metric through a disciplined capital strategy.
Rather than relying solely on leverage, Strategy employs a balanced BTC equity vs. debt strategy. On the equity side, it has used at-the-market offerings to sell new shares at elevated valuations, recycling proceeds into more Bitcoin without excessive dilution.
On the debt side, it issued low-interest convertible notes, which are structured to only convert into stock if Strategy’s price surges. This allows access to capital while minimizing immediate dilution. Though it did briefly use secured loans, the company exited those positions early, mitigating Bitcoin debt financing risk tied to margin calls.
This approach has enabled Strategy to nearly double its BTC holdings every 16-18 months, outperforming other Bitcoin holding companies both in accumulation and market trust.
As Adam Back on Saylor has noted, the company’s premium is a reflection of its compounding execution, steadily increasing BTC per share while maintaining solvency and optionality. In contrast to companies that simply hold BTC, Strategy actively manages its treasury as an asymmetric bet on a supply-capped crypto asset, one with long-term upside and short-term volatility.
The company has also demonstrated resilience during market downturns. Even amid price shocks and a looming BTC NAV death spiral for some peers, Strategy preserved its mNAV premium by clearly communicating with investors, maintaining debt servicing and opportunistically raising funds through equity rather than distress sales.
Did you know? Strategy’s stock has outpaced Bitcoin itself. Over the past five years, its stock soared around 3,000%, far outpacing Bitcoin (around 1,000%) and even chip giant Nvidia (around 1,500%).
Future of Bitcoin treasuries and mNAV crypto companies
Looking ahead, Bitcoin treasuries in 2025 are entering a phase of consolidation.
Only a handful of companies are likely to maintain their mNAV premiums. Weaker players (especially those overleveraged or lacking investor trust) may face acquisition, collapse or irrelevance.
Strategy’s lead and market credibility make it the benchmark. New entrants in the mNAV crypto companies category will need to differentiate themselves by offering new value, unique structures or improved capital efficiency. Simply being a corporate Bitcoin reserve vehicle may no longer be enough.
Meanwhile, plates are shifting as ETF and pension fund BTC exposure expands. With traditional finance offering new ways to access Bitcoin, from spot ETFs to institutional custodianship, the appeal of publicly traded Bitcoin proxy stocks could fade. If ETFs gain further traction, they may siphon demand away from companies like Strategy, shrinking the mNAV premium and compressing valuations.
Still, the long-term thesis remains intact: Bitcoin is a supply-capped crypto asset, and scarcity dynamics will drive value. The question is who can hold through volatility without being forced to sell. Companies with high leverage and weak governance are most at risk. Those relying on equity may dilute, but they’ll survive the next downturn.
Bitcoin corporate treasury risks are real, but not insurmountable. Strategy has set a playbook: use capital strategically, maintain investor trust and stay long-term aligned.
For others in the space, survival may depend on how well they can adapt that approach before the next BTC market downturn forecast becomes reality.
728 RM B 7/F GEE LOK IND BLDG NO 34 HUNG TO RD KWUN TONG KLN HONG KONG


The risk of loss in trading financial instruments such as stocks, FX, commodities, futures, bonds, ETFs and crypto can be substantial. You may sustain a total loss of the funds that you deposit with your broker. Therefore, you should carefully consider whether such trading is suitable for you in light of your circumstances and financial resources.
No decision to invest should be made without thoroughly conducting due diligence by yourself or consulting with your financial advisors. Our web content might not suit you since we don't know your financial conditions and investment needs. Our financial information might have latency or contain inaccuracy, so you should be fully responsible for any of your trading and investment decisions. The company will not be responsible for your capital loss.
Without getting permission from the website, you are not allowed to copy the website's graphics, texts, or trademarks. Intellectual property rights in the content or data incorporated into this website belong to its providers and exchange merchants.
Not Logged In
Log in to access more features


Log In
Sign Up


