• Trade
  • Markets
  • Copy
  • Contests
  • News
  • 24/7
  • Calendar
  • Q&A
  • Chats
Trending
Screeners
SYMBOL
LAST
BID
ASK
HIGH
LOW
NET CHG.
%CHG.
SPREAD
SPX
S&P 500 Index
6851.24
6851.24
6851.24
6878.28
6841.15
-19.16
-0.28%
--
DJI
Dow Jones Industrial Average
47815.47
47815.47
47815.47
47971.51
47709.38
-139.51
-0.29%
--
IXIC
NASDAQ Composite Index
23544.05
23544.05
23544.05
23698.93
23505.52
-34.07
-0.14%
--
USDX
US Dollar Index
99.140
99.220
99.140
99.160
98.730
+0.190
+ 0.19%
--
EURUSD
Euro / US Dollar
1.16193
1.16200
1.16193
1.16717
1.16169
-0.00233
-0.20%
--
GBPUSD
Pound Sterling / US Dollar
1.33163
1.33172
1.33163
1.33462
1.33053
-0.00149
-0.11%
--
XAUUSD
Gold / US Dollar
4192.26
4192.67
4192.26
4218.85
4175.92
-5.65
-0.13%
--
WTI
Light Sweet Crude Oil
58.930
58.960
58.930
60.084
58.837
-0.879
-1.47%
--

Community Accounts

Signal Accounts
--
Profit Accounts
--
Loss Accounts
--
View More

Become a signal provider

Sell trading signals to earn additional income

View More

Guide to Copy Trading

Get started with ease and confidence

View More

Signal Accounts for Members

All Signal Accounts

Best Return
  • Best Return
  • Best P/L
  • Best MDD
Past 1W
  • Past 1W
  • Past 1M
  • Past 1Y

All Contests

  • All
  • Trump Updates
  • Recommend
  • Stocks
  • Cryptocurrencies
  • Central Banks
  • Featured News
Top News Only
Share

Israeli Prime Minister Netanyahu: Hamas Has Violated The Ceasefire Agreement, And We Will Never Allow Its Members To Re-arm Themselves And Threaten US

Share

Israeli Prime Minister Netanyahu: We Are Working To Return The Body Of Another Detainee From The Gaza Strip

Share

Iraq's West Qurna 2 Oil Field Will Increase Oil Production Beyond Normal Levels To Compensate For The Production Stoppage Caused By The Trump Administration's Sanctions Against Russia

Share

Israeli Prime Minister Netanyahu: We Are Close To Completing The First Phase Of Trump’s Plan And Will Now Focus On Disarming Gaza And Seizing Hamas Weapons

Share

Moody's Affirmed Burberry's Long-term Rating Of Baa3 And Revised Its Outlook (from Negative) To Stable

Share

The Trump Administration Supports Iraq's Plan To Transfer Russian Oil Company Lukoil Pjsc's Assets In The West Qurna 2 Oil Field To An American Company

Share

JMA: Tsunami Of 70 Centimetres Observed In Japan's Kuji Port In Iwate Prefecture

Share

The U.S. Bureau Of Labor Statistics Plans To Release A Press Release On January 15, 2026, For November 2025, Along With Data For October

Share

Tiger Global Has Established A New Fund, Aiming To Raise $2 Billion To $3 Billion

Share

The U.S. Bureau Of Labor Statistics Announced That It Will Not Release A Press Release Regarding The U.S. Import And Export Price Index (MXP) For October 2025

Share

The U.S. Bureau Of Labor Statistics (BLS) Will Not Release U.S. October CPI Data

Share

Government Negotiator: Dutch Political Center And Center Right Parties D66,  Cda And Vvd Advised To Start Talks On Possible Government

Share

New York Fed: November Home Price Rise Expectation Steady At 3%

Share

New York Fed: US Households' Personal Finance Worries Grew In November

Share

New York Fed: November Five-Year-Ahead Expected Inflation Rate Unchanged At 3%

Share

New York Fed: Households More Pessimistic On Current, Future Financial Situations In November

Share

New York Fed Report: USA Households' Year-Ahead Expected Inflation Rate Unchanged At 3.2% In November

Share

New York Fed: November Year-Ahead Expected Rise In Medical Costs Highest Since January 2014

Share

New York Fed: Labor Market Expectations Improved In November

Share

New York Fed: November Three-Year-Ahead Expected Inflation Rate Unchanged At 3%

TIME
ACT
FCST
PREV
France Trade Balance (SA) (Oct)

A:--

F: --

P: --
Euro Zone Employment YoY (SA) (Q3)

A:--

F: --

P: --
Canada Part-Time Employment (SA) (Nov)

A:--

F: --

P: --

Canada Unemployment Rate (SA) (Nov)

A:--

F: --

P: --

Canada Full-time Employment (SA) (Nov)

A:--

F: --

P: --

Canada Labor Force Participation Rate (SA) (Nov)

A:--

F: --

P: --

Canada Employment (SA) (Nov)

A:--

F: --

P: --

U.S. PCE Price Index MoM (Sept)

A:--

F: --

P: --

U.S. Personal Income MoM (Sept)

A:--

F: --

P: --

U.S. Core PCE Price Index MoM (Sept)

A:--

F: --

P: --

U.S. PCE Price Index YoY (SA) (Sept)

A:--

F: --

P: --

U.S. Core PCE Price Index YoY (Sept)

A:--

F: --

P: --

U.S. Personal Outlays MoM (SA) (Sept)

A:--

F: --

P: --
U.S. 5-10 Year-Ahead Inflation Expectations (Dec)

A:--

F: --

P: --

U.S. Real Personal Consumption Expenditures MoM (Sept)

A:--

F: --

P: --
U.S. Weekly Total Rig Count

A:--

F: --

P: --

U.S. Weekly Total Oil Rig Count

A:--

F: --

P: --

U.S. Consumer Credit (SA) (Oct)

A:--

F: --

P: --
China, Mainland Foreign Exchange Reserves (Nov)

A:--

F: --

P: --

Japan Trade Balance (Oct)

A:--

F: --

P: --

Japan Nominal GDP Revised QoQ (Q3)

A:--

F: --

P: --

China, Mainland Imports YoY (CNH) (Nov)

A:--

F: --

P: --

China, Mainland Exports (Nov)

A:--

F: --

P: --

China, Mainland Imports (CNH) (Nov)

A:--

F: --

P: --

China, Mainland Trade Balance (CNH) (Nov)

A:--

F: --

P: --

China, Mainland Exports YoY (USD) (Nov)

A:--

F: --

P: --

China, Mainland Imports YoY (USD) (Nov)

A:--

F: --

P: --

Germany Industrial Output MoM (SA) (Oct)

A:--

F: --

P: --
Euro Zone Sentix Investor Confidence Index (Dec)

A:--

F: --

P: --

Canada National Economic Confidence Index

A:--

F: --

P: --

U.K. BRC Like-For-Like Retail Sales YoY (Nov)

--

F: --

P: --

U.K. BRC Overall Retail Sales YoY (Nov)

--

F: --

P: --

Australia Overnight (Borrowing) Key Rate

--

F: --

P: --

RBA Rate Statement
RBA Press Conference
Germany Exports MoM (SA) (Oct)

--

F: --

P: --

U.S. NFIB Small Business Optimism Index (SA) (Nov)

--

F: --

P: --

Mexico 12-Month Inflation (CPI) (Nov)

--

F: --

P: --

Mexico Core CPI YoY (Nov)

--

F: --

P: --

Mexico PPI YoY (Nov)

--

F: --

P: --

U.S. Weekly Redbook Index YoY

--

F: --

P: --

U.S. JOLTS Job Openings (SA) (Oct)

--

F: --

P: --

China, Mainland M1 Money Supply YoY (Nov)

--

F: --

P: --

China, Mainland M0 Money Supply YoY (Nov)

--

F: --

P: --

China, Mainland M2 Money Supply YoY (Nov)

--

F: --

P: --

U.S. EIA Short-Term Crude Production Forecast For The Year (Dec)

--

F: --

P: --

U.S. EIA Natural Gas Production Forecast For The Next Year (Dec)

--

F: --

P: --

U.S. EIA Short-Term Crude Production Forecast For The Next Year (Dec)

--

F: --

P: --

EIA Monthly Short-Term Energy Outlook
U.S. API Weekly Gasoline Stocks

--

F: --

P: --

U.S. API Weekly Cushing Crude Oil Stocks

--

F: --

P: --

U.S. API Weekly Crude Oil Stocks

--

F: --

P: --

U.S. API Weekly Refined Oil Stocks

--

F: --

P: --

South Korea Unemployment Rate (SA) (Nov)

--

F: --

P: --

Japan Reuters Tankan Non-Manufacturers Index (Dec)

--

F: --

P: --

Japan Reuters Tankan Manufacturers Index (Dec)

--

F: --

P: --

Japan Domestic Enterprise Commodity Price Index MoM (Nov)

--

F: --

P: --

Japan Domestic Enterprise Commodity Price Index YoY (Nov)

--

F: --

P: --

China, Mainland PPI YoY (Nov)

--

F: --

P: --

China, Mainland CPI MoM (Nov)

--

F: --

P: --

Q&A with Experts
    • All
    • Chatrooms
    • Groups
    • Friends
    Connecting
    .
    .
    .
    Type here...
    Add Symbol or Code

      No matching data

      All
      Trump Updates
      Recommend
      Stocks
      Cryptocurrencies
      Central Banks
      Featured News
      • All
      • Russia-Ukraine Conflict
      • Middle East Flashpoint
      • All
      • Russia-Ukraine Conflict
      • Middle East Flashpoint
      Search
      Products

      Charts Free Forever

      Chats Q&A with Experts
      Screeners Economic Calendar Data Tools
      Membership Features
      Data Warehouse Market Trends Institutional Data Policy Rates Macro

      Market Trends

      Market Sentiment Order Book Forex Correlations

      Top Indicators

      Charts Free Forever
      Markets

      News

      News Analysis 24/7 Columns Education
      From Institutions From Analysts
      Topics Columnists

      Latest Views

      Latest Views

      Trending Topics

      Top Columnists

      Latest Update

      Signals

      Copy Rankings Latest Signals Become a signal provider AI Rating
      Contests
      Brokers

      Overview Brokers Assessment Rankings Regulators News Claims
      Broker listing Forex Brokers Comparison Tool Live Spread Comparison Scam
      Q&A Complaint Scam Alert Videos Tips to Detect Scam
      More

      Business
      Events
      Careers About Us Advertising Help Center

      White Label

      Data API

      Web Plug-ins

      Affiliate Program

      Awards Institution Evaluation IB Seminar Salon Event Exhibition
      Vietnam Thailand Singapore Dubai
      Fans Party Investment Sharing Session
      FastBull Summit BrokersView Expo
      Recent Searches
        Top Searches
          Markets
          News
          Analysis
          User
          24/7
          Economic Calendar
          Education
          Data
          • Names
          • Latest
          • Prev

          View All

          No data

          Scan to Download

          Faster Charts, Chat Faster!

          Download App
          English
          • English
          • Español
          • العربية
          • Bahasa Indonesia
          • Bahasa Melayu
          • Tiếng Việt
          • ภาษาไทย
          • Français
          • Italiano
          • Türkçe
          • Русский язык
          • 简中
          • 繁中
          Open Account
          Search
          Products
          Charts Free Forever
          Markets
          News
          Signals

          Copy Rankings Latest Signals Become a signal provider AI Rating
          Contests
          Brokers

          Overview Brokers Assessment Rankings Regulators News Claims
          Broker listing Forex Brokers Comparison Tool Live Spread Comparison Scam
          Q&A Complaint Scam Alert Videos Tips to Detect Scam
          More

          Business
          Events
          Careers About Us Advertising Help Center

          White Label

          Data API

          Web Plug-ins

          Affiliate Program

          Awards Institution Evaluation IB Seminar Salon Event Exhibition
          Vietnam Thailand Singapore Dubai
          Fans Party Investment Sharing Session
          FastBull Summit BrokersView Expo

          Strategy won’t face Bitcoin liquidation in the next bear market: Willy Woo

          Cointelegraph
          dogwifhat / Tether
          +0.66%
          Kite AI / USD Coin
          +1.00%
          Kite AI / Tether
          +0.70%
          Virtuals Protocol / USD Coin
          0.00%
          Virtuals Protocol / Tether
          +0.27%

          Michael Saylor’s Strategy (MSTR) won’t have to sell off part of its Bitcoin stash to cover its debt in the next significant crypto market downturn, according to Bitcoin analyst Willy Woo.

          “MSTR liquidation in the next bear market? I doubt it,” Willy Woo said in an X post on Wednesday.

          Strategy’s debt consists mainly of convertible senior notes. Strategy is set to settle its conversions as they fall due by paying either cash, common stock, or a combination of both, at its election. 

          Strategy safe from liquidation in next bear market

          For the Sept. 15, 2027 holder put right date, Strategy will have around $1.01 billion in debt due. To avoid needing to sell Bitcoin (BTC) to repay it, Strategy’s stock must be trading above $183.19, Woo said.

          That price roughly corresponds to a Bitcoin price of around $91,502, and assuming a multiple net-asset-value (mNAV) of 1, he added.

          Cryptocurrencies, Bitcoin Price, MicroStrategy, Michael Saylor

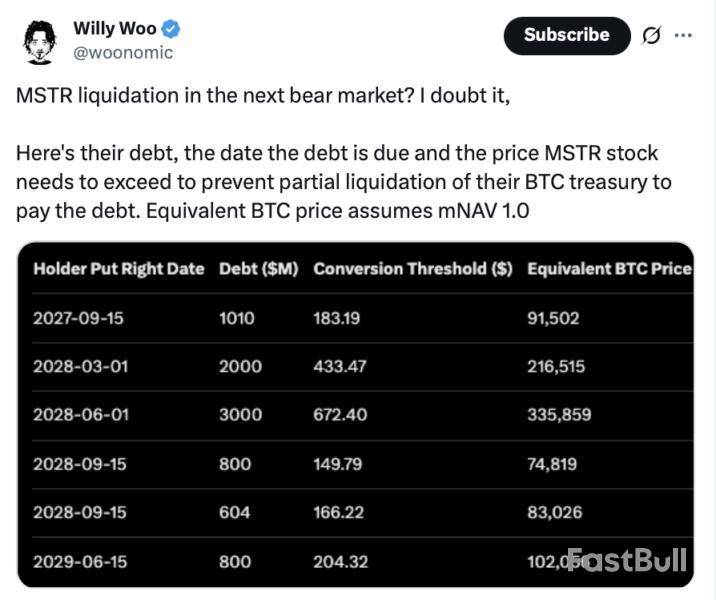
          Bitcoin analyst The Bitcoin Therapist said that “Bitcoin would have to perform horribly” in the next market downturn for Strategy to have to start selling off Bitcoin.

          “Would be one hell of a sustained bear market to see any liquidation for Strategy,” they added. Strategy holds around 641,205 Bitcoin, which is worth around $64 billion at the time of publication, according to Saylor Tracker.

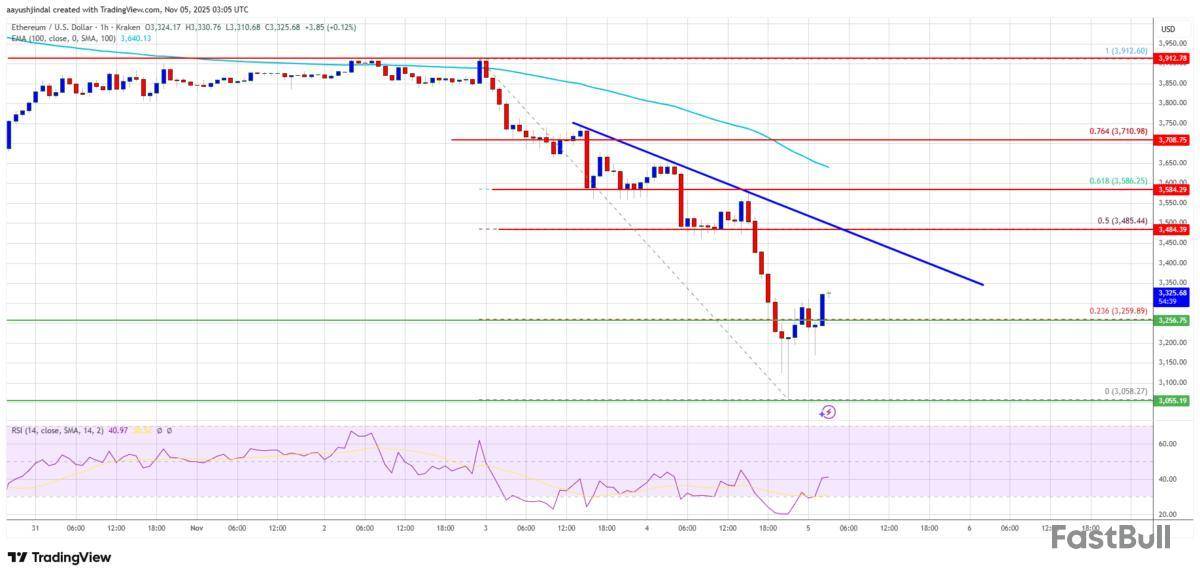
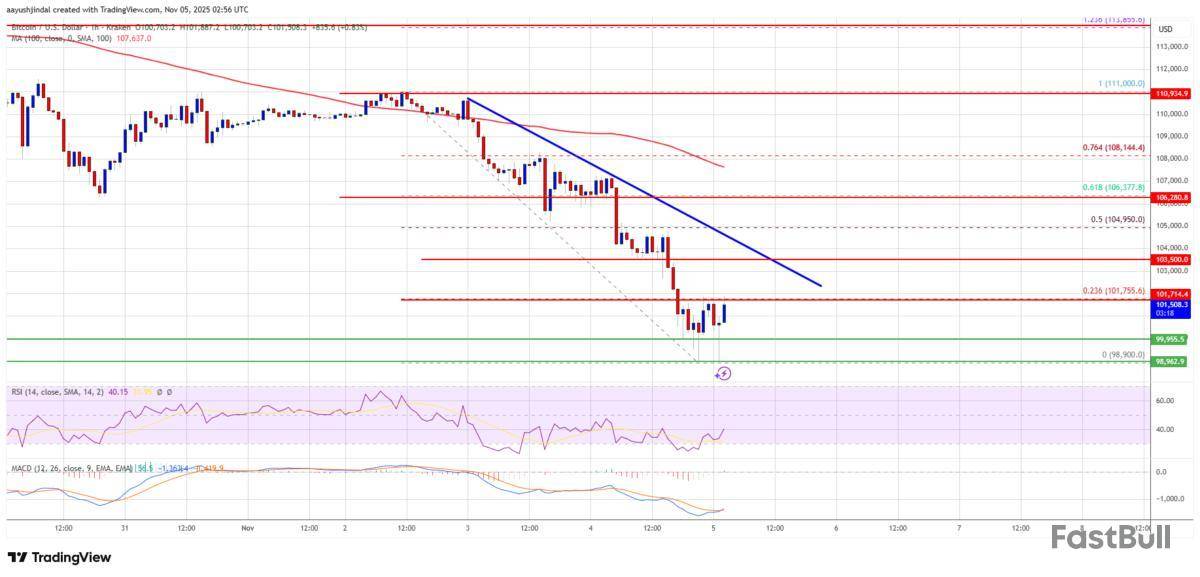
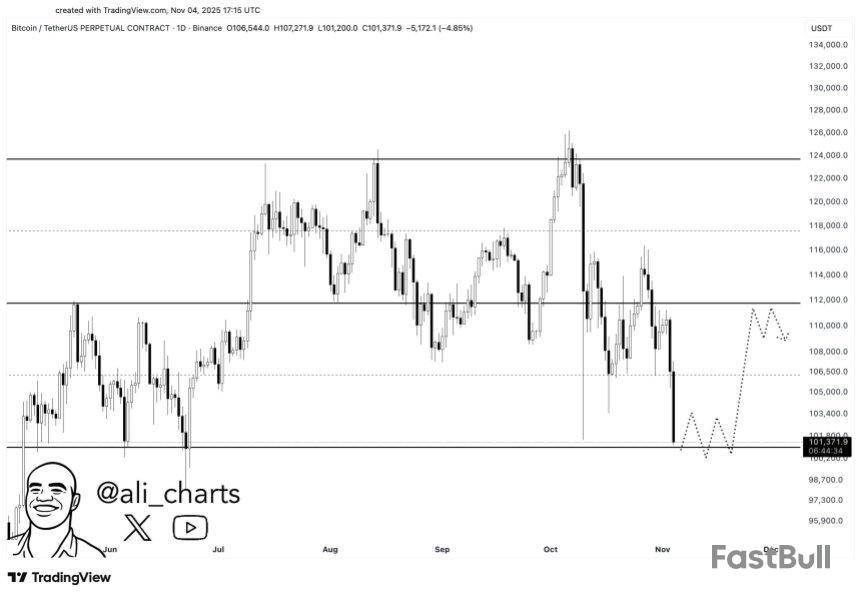
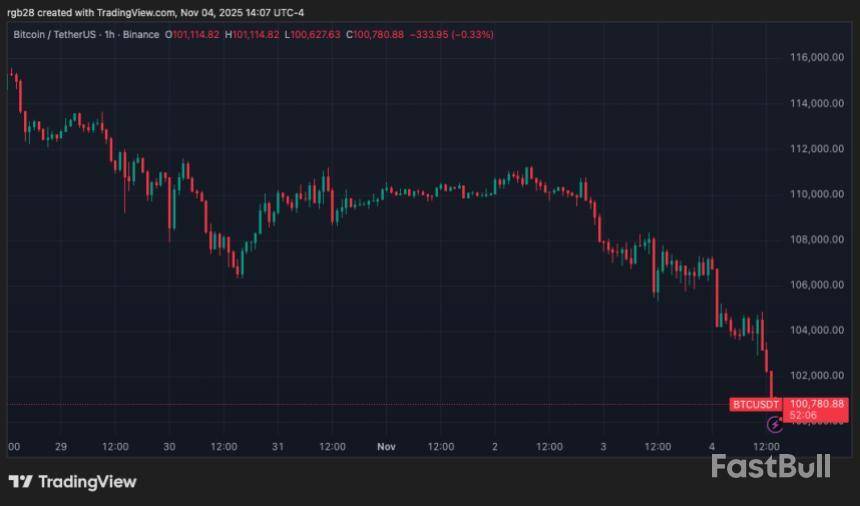
          Strategy’s stock closed trading on Tuesday at a seven-month low, down nearly 6.7% on the day to $246.99. Meanwhile, Bitcoin is trading at $101,377, down 9.92% over the past seven days, according to CoinMarketCap.

          Woo tips a chance of a “partial liquidation”

          While Woo does not expect a liquidation in the next bear market, he warned that it is possible if Bitcoin fails to rally strongly during the anticipated 2028 bull market.

          “Ironically, there’s a chance of a partial liquidation if BTC doesn’t climb in value fast enough in an assumed 2028 bull market,” Willy Woo said.

          Some crypto executives, such as ARK Invest CEO Cathie Wood and Coinbase CEO Brian Armstrong, have forecasted that Bitcoin will reach $1 million by 2030.

          Risk Warnings and Disclaimers
          You understand and acknowledge that there is a high degree of risk involved in trading. Following any strategies or investment methods may lead to potential losses. The content on the site is provided by our contributors and analysts for information purposes only. You are solely responsible for determining whether any trading assets, securities, strategy, or any other product is suitable for investing based on your own investment objectives and financial situation.
          Add to Favorites
          Share

          Altcoin Winter Here? Ethereum, Solana Activity Plunges

          NewsBTC
          dogwifhat / Tether
          +0.66%
          Kite AI / USD Coin
          +1.00%
          Kite AI / Tether
          +0.70%
          Virtuals Protocol / USD Coin
          0.00%
          Virtuals Protocol / Tether
          +0.27%

          On-chain data shows signs of an altcoin winter may be emerging as Ethereum, Solana, and other cryptocurrencies have seen a decline in activity.

          Altcoins Are Observing A Drop In On-Chain Activity

          In a new thread on X, institutional DeFi solutions provider Sentora (formerly IntoTheBlock) has talked about how interest in altcoins has been cooling off recently.

          The on-chain indicator of relevance here is the “Active Addresses,” which measures, as its name suggests, the total number of addresses that are participating in some kind of transaction activity on a given network every day.

          When the value of this metric rises, it means more users are making transfers on the blockchain. Such a trend implies trading interest in the cryptocurrency may be on the rise.

          On the other hand, the indicator witnessing a decline suggests investors may be shifting their attention elsewhere as they are reducing their transaction activity on the network.

          Now, here is a chart that shows the trend in this indicator for Ethereum, the largest of the altcoins, over the last few years:

          Ethereum Active Addresses

          As displayed in the above graph, the Ethereum Active Addresses metric was at a high of 589,000 in late July. Since then, activity on the network has gone downhill, with there now being 488,000 addresses making transactions, around 17% lower than the peak.

          “Fewer users interacting on ETH indicates weaker on-chain demand, a pattern seen in past bear-market phases,” explained Sentora. Solana, another prominent altcoin, has been showing a similar trend.

          Solana Active Addresses

          From the chart, it’s clear that the monthly version of the Active Addresses witnessed a notable decline for SOL during Q3 2025. More specifically, active users on the blockchain dropped by about 30% in this period. “Solana has been the out-performer this cycle, but momentum is cooling,” noted the analytics firm.

          Memecoins have been hit hard in the recent market downturn, and the same has held true for their on-chain activity. Dogecoin, the largest meme-based token, has only witnessed a slight decrease in Active Addresses, but Pepe has gone through a drawdown of 85%. “This drop shows how quickly speculative user bases can evaporate,” said Sentora.

          Finally, the analytics firm has also highlighted that DeFi trading volume has started to trend down as well. The metric is still relatively strong compared to other cryptocurrency-related indicators, but a change in direction is apparent.

          DeFi TVL

          With the crash in prices and downturn in on-chain activity, is the altcoin sector entering a season of winter? “It’s too early to tell but the current data echoes past cycles,” noted Sentora. “We are already 6+ months into an altcoin slowdown, with winter signs popping up.”

          Ethereum Price

          Ethereum has plunged alongside the rest of the market during the past day as its price has retraced to $3,300.

          Risk Warnings and Disclaimers
          You understand and acknowledge that there is a high degree of risk involved in trading. Following any strategies or investment methods may lead to potential losses. The content on the site is provided by our contributors and analysts for information purposes only. You are solely responsible for determining whether any trading assets, securities, strategy, or any other product is suitable for investing based on your own investment objectives and financial situation.
          Add to Favorites
          Share

          ZKsync creator floats governance token revamp to add ‘economic utility’

          Cointelegraph
          dogwifhat / Tether
          +0.66%
          Kite AI / USD Coin
          +1.00%
          Kite AI / Tether
          +0.70%
          Virtuals Protocol / USD Coin
          0.00%
          Virtuals Protocol / Tether
          +0.27%

          The co-creator of the Ethereum-scaling solution ZKsync has proposed a major overhaul of its governance token, arguing it should prioritize “economic utility.”

          In a post on Tuesday to the ZKsync forum, Alex Gluchowski argued that while its ZKsync (ZK) governance token was effective in the project’s early stages as the “architecture and adoption path were still forming,” the network has since rapidly evolved. 

          He said it now hosts an ecosystem of interconnected zero-knowledge chains and it is important that ZKsync’s token captures network value and drives further ecosystem adoption. 

          “The goal is to align usage with value, make decentralization economically sustainable, and ensure the network captures a meaningful share of the economic benefits it creates.”

          Gluchowski, who is also the co-founder and CEO of Matter Labs, the firm behind ZKsync, emphasized that funds must flow back into the “network’s economy,” as this will enable continual infrastructure upgrade, security enhancements, public goods funding and “long-term independence.”

          “The design goal is to establish a self-reinforcing economic loop where adoption increases network resources, and those resources in turn enhance the network for all participants,” he wrote.

          New tokenomics tied to revenue

          Gluchowski outlined that the revamped ZK token would derive value onchain from avenues like protocol-native fees, generated from “interoperability and other core settlement and messaging functions,” and offchain via licensing agreements for “enterprise software components.”

          In terms of the licensing deals, ZKsync’s stack is free to use as it is open-source. However, Gluchowski argued that when large enterprises adopt “community-built infrastructure” for complex uses such as treasury integrations, there should be agreements in place to provide value back to the ecosystem.

          “When such capabilities are funded by the ecosystem, it is reasonable that their use by enterprise participants returns value to the ecosystem,” he wrote. 

          From there, all of this extracted value would then flow into a “governance-controlled system” that would direct it to ZK market buybacks, staking rewards, token burning and ecosystem funding.

          “For decentralization to persist, it must be economically sustainable. The network needs a durable economic model that supports ongoing development, security, and operation by many independent participants, not by a central sponsor.”

          ZKsync has been eyeing a change-up of its governance token for months now. Back in June, Matter Labs' head of business development Omar Azhar posted a “ZKnomics Roadmap Vision” on the project’s forum. 

          “ZKnomics is designed to align ZK with the long-term health and sustainability of the protocol. It proposes a system where network usage drives protocol revenue, and that revenue is programmatically directed toward two core functions: incentivizing protocol participants and managing token supply,” Azhar wrote. 

          The proposed timeline of this token shift is unclear. Gluchowski also posted this proposal to X to encourage more feedback and review from the community, adding that more details will be provided “once there is broad support for this direction.” 

          Risk Warnings and Disclaimers
          You understand and acknowledge that there is a high degree of risk involved in trading. Following any strategies or investment methods may lead to potential losses. The content on the site is provided by our contributors and analysts for information purposes only. You are solely responsible for determining whether any trading assets, securities, strategy, or any other product is suitable for investing based on your own investment objectives and financial situation.
          Add to Favorites
          Share

          Ethereum Tanks 10% — Can Bulls Defend the Next Major Demand Zone?

          NewsBTC
          dogwifhat / Tether
          +0.66%
          Kite AI / USD Coin
          +1.00%
          Kite AI / Tether
          +0.70%
          Virtuals Protocol / USD Coin
          0.00%
          Virtuals Protocol / Tether
          +0.27%

          Ethereum price started a fresh decline below $3,550. ETH is struggling below $3,400 and might decline further if it stays below $3,500.

          • Ethereum started another bearish wave after it failed to clear $3,650.
          • The price is trading below $3,500 and the 100-hourly Simple Moving Average.
          • There is a bearish trend line forming with resistance at $3,450 on the hourly chart of ETH/USD (data feed via Kraken).
          • The pair could continue to move down if it trades below $3,200.

          Ethereum Price Dips Sharply

          Ethereum price failed to stay in a positive zone and started a fresh decline below $3,550, like Bitcoin. ETH price declined below $3,500 and $3,450 to enter a bearish zone.

          The decline gained pace below $3,350. Finally, the bulls appeared near $3,050. A low was formed at $3,058 and the price is now consolidating losses. There was a recovery wave above the 23.6% Fib retracement level of the recent decline from the $3,920 swing high to the $3,058 low.

          Ethereum price is now trading below $3,400 and the 100-hourly Simple Moving Average. If there is a decent increase, the price could face resistance near the $3,350 level. The next key resistance is near the $3,480 level and the 50% Fib retracement level of the recent decline from the $3,920 swing high to the $3,058 low. There is also a bearish trend line forming with resistance at $3,450 on the hourly chart of ETH/USD.

          The first major resistance is near the $3,500 level. A clear move above the $3,500 resistance might send the price toward the $3,550 resistance. An upside break above the $3,550 region might call for more gains in the coming days. In the stated case, Ether could rise toward the $3,750 resistance zone or even $3,800 in the near term.

          More Losses In ETH?

          If Ethereum fails to clear the $3,500 resistance, it could start a fresh decline. Initial support on the downside is near the $3,250 level. The first major support sits near the $3,200 zone.

          A clear move below the $3,200 support might push the price toward the $3,120 support. Any more losses might send the price toward the $3,050 region in the near term. The next key support sits at $3,020 and $3,000.

          Technical Indicators

          Hourly MACD – The MACD for ETH/USD is losing momentum in the bearish zone.

          Hourly RSI – The RSI for ETH/USD is now below the 50 zone.

          Major Support Level – $3,200

          Major Resistance Level – $3,500

          Risk Warnings and Disclaimers
          You understand and acknowledge that there is a high degree of risk involved in trading. Following any strategies or investment methods may lead to potential losses. The content on the site is provided by our contributors and analysts for information purposes only. You are solely responsible for determining whether any trading assets, securities, strategy, or any other product is suitable for investing based on your own investment objectives and financial situation.
          Add to Favorites
          Share

          CZ pardon was considered with ‘utmost seriousness,’ White House says

          Cointelegraph
          dogwifhat / Tether
          +0.66%
          Kite AI / USD Coin
          +1.00%
          Kite AI / Tether
          +0.70%
          Virtuals Protocol / USD Coin
          0.00%
          Virtuals Protocol / Tether
          +0.27%

          The White House carefully considered Binance founder Changpeng Zhao’s pardon and went through the standard processes before sending it to President Donald Trump for his approval, says White House press secretary Karoline Leavitt.

          Trump defended the pardon in an interview with CBS News’ 60 Minutes on Sunday, saying he had “no idea” who Zhao is and dismissed criticism of his pardon as politically motivated. 

          Leavitt said in a briefing on Tuesday that Trump’s comments on Zhao in the interview were meant to convey that “he does not know him personally” and that the president “does not have a personal relationship with this individual.”

          She added that the pardon was considered with “utmost seriousness” and went through a “thorough review process” by the Department of Justice and the White House Counsel’s office.

          “There’s a whole team of qualified lawyers who look at every single pardon request that ultimately make their way up to the President of the United States,” she added. “He’s the ultimate final decision maker.”

          It follows multiple news reports suggesting Binance and Zhao helped the Trump family’s crypto venture, World Liberty Financial, with building its stablecoin and using it in a $2 billion investment deal, which Binance CEO Richard Teng has denied.

          Trump “corrected” a wrong, Leavitt says

          Leavitt claimed that Zhao was “over prosecuted by a weaponized DOJ,” and the Biden administration sought an excessive penalty as a result.

          Zhao pleaded guilty in November 2023 to failing to maintain an effective Anti–Money Laundering program at Binance in violation of the US Bank Secrecy Act 

          US prosecutors initially asked for a three-year jail term, but the sentencing judge shot it down as “too harsh” and instead opted for a four-month prison sentence, which Zhao started in April 2024.

          “The president is correcting that wrong and he has officially ended the Biden administration’s war on the cryptocurrency industry, and I think that’s the message he sent with this pardon,” Leavitt said.

          Zhao’s lawyer, Teresa Goody Guillén, and other supporters have argued it was a harsh sentence given that it was a single charge of failure to have an effective compliance program, and Zhao was a non-violent first-time offender.

          60 Minutes cut question on crypto from show

          In a section of Trump’s 60 Minutes interview that was cut from broadcast, CBS’s Norah O’Donnell asked the president whether he was concerned “about the appearance of corruption,” regarding Zhao’s pardon.

          “I can’t say, because — I can’t say — I’m not concerned. I don’t — I’d rather not have you ask the question,” Trump replied, according to a transcript of the interview.

          He then added that the US was “number one in crypto in the whole world” because he is the president, and that he didn’t want “China or anybody else to take it away. It’s a massive industry.”

          CBS’s YouTube video of its interview with Trump notes that it was “condensed for clarity.”

          Before the cut question, Trump said his sons are more involved in crypto than he is, and he knows very “little about it, other than one thing. It’s a huge industry.”

          Risk Warnings and Disclaimers
          You understand and acknowledge that there is a high degree of risk involved in trading. Following any strategies or investment methods may lead to potential losses. The content on the site is provided by our contributors and analysts for information purposes only. You are solely responsible for determining whether any trading assets, securities, strategy, or any other product is suitable for investing based on your own investment objectives and financial situation.
          Add to Favorites
          Share

          Bitcoin Slides Back to $100K — Is the Parabolic Run Finally Cracking?

          NewsBTC
          dogwifhat / Tether
          +0.66%
          Kite AI / USD Coin
          +1.00%
          Kite AI / Tether
          +0.70%
          Virtuals Protocol / USD Coin
          0.00%
          Virtuals Protocol / Tether
          +0.27%

          Bitcoin price is gaining bearish pace below $103,500. BTC could continue to move down if it stays below the $103,500 resistance.

          • Bitcoin started a fresh decline below the $105,000 support.
          • The price is trading below $104,000 and the 100 hourly Simple moving average.
          • There is a bearish trend line forming with resistance at $103,500 on the hourly chart of the BTC/USD pair (data feed from Kraken).
          • The pair might continue to move down if it settles below the $100,000 zone.

          Bitcoin Price Dips Again

          Bitcoin price failed to stay above the $105,500 support level and started a fresh decline. BTC dipped below $104,000 and $103,500 to enter a bearish zone.

          The decline was such that the price even spiked below the $100,000 support. A low was formed at $98,900 and the price is now consolidating losses near the 23.6% Fib retracement level of the downward move from the $111,000 swing high to the $98,900 low.

          Bitcoin is now trading below $104,000 and the 100 hourly Simple moving average. If the bulls attempt a recovery wave, the price could face resistance near the $102,000 level. The first key resistance is near the $103,500 level. There is also a bearish trend line forming with resistance at $103,500 on the hourly chart of the BTC/USD pair.

          The next resistance could be $105,000 and the 50% Fib retracement level of the downward move from the $111,000 swing high to the $98,900 low. A close above the $105,000 resistance might send the price further higher. In the stated case, the price could rise and test the $106,400 resistance. Any more gains might send the price toward the $107,500 level. The next barrier for the bulls could be $108,500 and $108,800.

          More Losses In BTC?

          If Bitcoin fails to rise above the $103,500 resistance zone, it could continue to move down. Immediate support is near the $100,200 level. The first major support is near the $100,000 level.

          The next support is now near the $98,800 zone. Any more losses might send the price toward the $96,200 support in the near term. The main support sits at $95,500, below which BTC might struggle to recover in the near term.

          Technical indicators:

          Hourly MACD – The MACD is now gaining pace in the bearish zone.

          Hourly RSI (Relative Strength Index) – The RSI for BTC/USD is now below the 50 level.

          Major Support Levels – $100,200, followed by $100,000.

          Major Resistance Levels – $103,500 and $105,000.

          Risk Warnings and Disclaimers
          You understand and acknowledge that there is a high degree of risk involved in trading. Following any strategies or investment methods may lead to potential losses. The content on the site is provided by our contributors and analysts for information purposes only. You are solely responsible for determining whether any trading assets, securities, strategy, or any other product is suitable for investing based on your own investment objectives and financial situation.
          Add to Favorites
          Share

          Bitcoin Eyes ‘Moment Of Truth’ As Price Retests $100,000 Support – Is The Rally Over?

          NewsBTC
          dogwifhat / Tether
          +0.66%
          Kite AI / USD Coin
          +1.00%
          Kite AI / Tether
          +0.70%
          Virtuals Protocol / USD Coin
          0.00%
          Virtuals Protocol / Tether
          +0.27%

          After failing to close the week above a crucial level, Bitcoin (BTC) is attempting to hold $100,000 as support, leading some analysts to suggest that this is the make-or-break moment for the cryptocurrency.

          Bitcoin Plunges To Physiological Barrier

          On Tuesday, Bitcoin saw a 9% drop from its weekly opening, dropping to the $100,000 area for the first time in months. The flagship crypto has been trading above $105,000 since late June, hovering between $108,000-$120,000 over the past four months.

          During the early October correction, BTC’s price briefly deviated below these crucial levels, hitting a three-month low of $102,000 before recovering. Since then, the cryptocurrency has struggled to reclaim the mid-zone of its local range, falling to the $106,000-$108,000 area multiple times in the daily timeframe.

          As the price retested the $100,000 level, Sjuul from AltCryptoGems noted that Bitcoin has now broken below its 10th of October low, which was “the last major level before the $98K low from the Middle Eastern war fud back in June.”

          Analyst Ted Pillows highlighted that BTC has two massive liquidity clusters on the longer timeframes. Per the chart, the first cluster sits around the $90,000 level, which also coincides with an open CME Gap from Q2.

          Meanwhile, the second cluster sits around the all-time high area at $126,000. “Given that the market is looking weak now, a dump to fill the CME gap before reversal could happen,” the market watcher warned.

          However, Ali Martinez suggested that a 5%-11% rebound from the current area is possible. The chart shows that Bitcoin has been trading between $101,300-$124,000 price range since May, bouncing from the lower boundary each time it was retested. If BTC holds this area, it could surge to at least $106,500 or $112,000, the analyst asserted.

          Bitcoin

          BTC Retests 50-Week EMA

          Rekt Capital highlighted that BTC had reached the 50-week Exponential Moving Average (EMA). The analyst explained that after closing below the 21-week EMA, Bitcoin was deviating below its range lows for the fifth consecutive week.

          The 21-week EMA has served as crucial support during pullbacks since late Q2. However, it was lost amid the recent market volatility. Last week, multiple analysts warned that closing above this level was crucial to turn it back into support and prevent a larger pullback.

          Per the Tuesday post, the 50-week EMA, sitting around the $100,000 level, “would probably only get tagged on confirmed breakdown from $108k,” meaning that the flagship crypto will need to close the week above this level to maintain its current price range.

          Similarly, Crypto Bullet pointed out that the 50-week MA retest was “the moment of truth” for BTC. Notably, the cryptocurrency has retested this indicator three times this cycle, marking the bottom of each corrective phase and the start of a new rally to a new all-time high (ATH).

          The market watcher warned that losing this level would mean “it’s lights out” for the flagship cryptocurrency. However, a rebound from this area could set the stage for a price recovery and a potential bullish rally in late Q4.

          As of this writing, Bitcoin is trading at $100,356, a 6% decline in the daily timeframe.

          bitcoin, btc, btcusdt
          Risk Warnings and Disclaimers
          You understand and acknowledge that there is a high degree of risk involved in trading. Following any strategies or investment methods may lead to potential losses. The content on the site is provided by our contributors and analysts for information purposes only. You are solely responsible for determining whether any trading assets, securities, strategy, or any other product is suitable for investing based on your own investment objectives and financial situation.
          Add to Favorites
          Share
          FastBull
          Copyright © 2025 FastBull Ltd

          728 RM B 7/F GEE LOK IND BLDG NO 34 HUNG TO RD KWUN TONG KLN HONG KONG

          TelegramInstagramTwitterfacebooklinkedin
          App Store Google Play Google Play
          Products
          Charts

          Chats

          Q&A with Experts
          Screeners
          Economic Calendar
          Data
          Tools
          Membership
          Features
          Function
          Markets
          Copy Trading
          Latest Signals
          Contests
          News
          Analysis
          24/7
          Columns
          Education
          Company
          Careers
          About Us
          Contact Us
          Advertising
          Help Center
          Feedback
          User Agreement
          Privacy Policy
          Business

          White Label

          Data API

          Web Plug-ins

          Poster Maker

          Affiliate Program

          Risk Disclosure

          The risk of loss in trading financial instruments such as stocks, FX, commodities, futures, bonds, ETFs and crypto can be substantial. You may sustain a total loss of the funds that you deposit with your broker. Therefore, you should carefully consider whether such trading is suitable for you in light of your circumstances and financial resources.

          No decision to invest should be made without thoroughly conducting due diligence by yourself or consulting with your financial advisors. Our web content might not suit you since we don't know your financial conditions and investment needs. Our financial information might have latency or contain inaccuracy, so you should be fully responsible for any of your trading and investment decisions. The company will not be responsible for your capital loss.

          Without getting permission from the website, you are not allowed to copy the website's graphics, texts, or trademarks. Intellectual property rights in the content or data incorporated into this website belong to its providers and exchange merchants.

          Not Logged In

          Log in to access more features

          FastBull Membership

          Not yet

          Purchase

          Become a signal provider
          Help Center
          Customer Service
          Dark Mode
          Price Up/Down Colors

          Log In

          Sign Up

          Position
          Layout
          Fullscreen
          Default to Chart
          The chart page opens by default when you visit fastbull.com