


- GBPUSD
- XAUUSD
- XAGUSD
- WTI
- USDX


Markets
Analysis
User
24/7
Economic Calendar
Education
Data
- Names
- Latest
- Prev


Bitcoin treasury company Strategy (formerly MicroStrategy) acquired an additional 13,390 BTC for approximately $1.34 billion at an average price of $99,856 per bitcoin between May 5 and May 11, according to an 8-K filing with the Securities and Exchange Commission on Monday.
Strategy now holds a total of 568,840 BTC — worth over $59 billion — bought at an average price of $69,287 per bitcoin for a total cost of around $39.4 billion, including fees and expenses, according to the company's co-founder and executive chairman, Michael Saylor. That's the equivalent of more than 2.7% of bitcoin's total 21 million supply and implies around $20 billion of paper gains — with 303,230 BTC bought in the last six months alone.
The latest acquisitions were made using proceeds from the sale of its class A common stock, MSTR, and perpetual strike preferred stock, STRK. Last week, Strategy sold 3,222,875 MSTR shares for approximately $1.31 billion. As of May 11, $19.69 billion worth of MSTR shares remain available for issuance and sale under that program, the firm said. Strategy also sold 273,987 STRK shares for approximately $25.1 million, with $20.85 billion worth of STRK shares remaining available for issuance and sale under that program.
Strategy's STRK and STRF perpetual preferred stocks are in addition to the firm's "42/42" plan, which targets a total capital raise of $84 billion in equity offerings and convertible notes for bitcoin acquisitions through 2027 — upsized from its initial $42 billion, "21/21" plan, of which the equity side was recently depleted.
Saylor again hinted at the likelihood of another bitcoin acquisition filing ahead of time, sharing an update on Strategy's bitcoin purchase tracker on Sunday, stating, "Connect the dots."
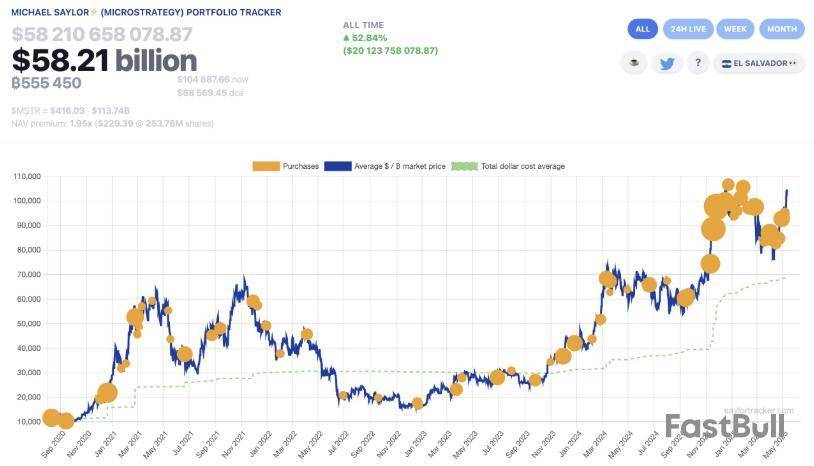
Strategy portfolio tracker. Image: Saylortracker.com.
Strategy previously acquired an additional 1,895 BTC for approximately $180 million at an average price of $95,167 per bitcoin between April 28 and May 4 — taking its total holdings to 555,450 BTC.
Corporate bitcoin accumulation race
There are now more than 70 companies that have adopted some form of bitcoin treasury. Cantor Fitzgerald, SoftBank, Bitfinex and Tether recently announced the planned launch of a $3.6 billion bitcoin venture called Twenty One, joining the likes of Semler Scientific, KULR and Metaplanet in pursuing a bitcoin acquisition model, pioneered by Strategy and Saylor.
Analysts at Bernstein predict that Strategy and its corporate copycats could add $330 billion to their bitcoin treasuries over the next five years, driven by a more pro-crypto regime in the U.S..
Earlier this month, Strategy posted a $4.2 billion net loss for Q1, driven largely by around $6 billion in unrealized losses on its bitcoin holdings during the first quarter under new fair value accounting rules.
Strategy's $113.7 billion market cap trades at a significant premium to its bitcoin net asset value, with some investors continuing to air reservations about the firm's premium to NAV valuation and its increasingly numerous bitcoin acquisition programs. However, analysts argue that with Strategy's relatively low debt levels and no payments due until 2028, the firm's leverage remains manageable.
"Remarkably, the Strategy enterprise value premium to its BTC holdings remains massive, with the company currently trading at a 2x valuation to the value of its BTC," analysts at K33 said last week. "These valuation premiums have remained elevated [since] 2024, peaking at 3.4x in late November. Since that peak, the company has raised over $15 billion via ATM issuance. Despite the considerable dilution, its shares have retained a strong premium, positioning the company to continue aggressive, ATM-funded bitcoin acquisitions in the coming months."
Strategy's class A common stock, MSTR, closed up 0.4% on Friday at $416.03, according to The Block's Strategy price page, following a week that saw bitcoin gain more than 10% to reapproach its all-time high. MSTR is currently up 1.5% in pre-market trading on Monday, per TradingView, and 38.6% year-to-date.
Benchmark recently reiterated its "buy" rating and $650 price target on MSTR, while analysts at Bernstein maintained their "outperform" rating and $600 target for the stock.
Disclaimer: The Block is an independent media outlet that delivers news, research, and data. As of November 2023, Foresight Ventures is a majority investor of The Block. Foresight Ventures invests in other companies in the crypto space. Crypto exchange Bitget is an anchor LP for Foresight Ventures. The Block continues to operate independently to deliver objective, impactful, and timely information about the crypto industry. Here are our current financial disclosures.
© 2025 The Block. All Rights Reserved. This article is provided for informational purposes only. It is not offered or intended to be used as legal, tax, investment, financial, or other advice.
728 RM B 7/F GEE LOK IND BLDG NO 34 HUNG TO RD KWUN TONG KLN HONG KONG


The risk of loss in trading financial instruments such as stocks, FX, commodities, futures, bonds, ETFs and crypto can be substantial. You may sustain a total loss of the funds that you deposit with your broker. Therefore, you should carefully consider whether such trading is suitable for you in light of your circumstances and financial resources.
No decision to invest should be made without thoroughly conducting due diligence by yourself or consulting with your financial advisors. Our web content might not suit you since we don't know your financial conditions and investment needs. Our financial information might have latency or contain inaccuracy, so you should be fully responsible for any of your trading and investment decisions. The company will not be responsible for your capital loss.
Without getting permission from the website, you are not allowed to copy the website's graphics, texts, or trademarks. Intellectual property rights in the content or data incorporated into this website belong to its providers and exchange merchants.
Not Logged In
Log in to access more features


Log In
Sign Up


