

Markets
News
Analysis
User
24/7
Economic Calendar
Education
Data
- Names
- Latest
- Prev


Signal Accounts for Members
All Signal Accounts
All Contests
 U.K. Trade Balance Non-EU (SA) (Oct)
A:--
F: --
P: --
U.K. Trade Balance (Oct)A:--
F: --
P: --
U.K. Services Index MoMA:--
F: --
P: --
U.K. Construction Output MoM (SA) (Oct)A:--
F: --
P: --
U.K. Industrial Output YoY (Oct)A:--
F: --
P: --
U.K. Trade Balance (SA) (Oct)A:--
F: --
P: --
U.K. Trade Balance EU (SA) (Oct)A:--
F: --
P: --
U.K. Manufacturing Output YoY (Oct)A:--
F: --
P: --
U.K. GDP MoM (Oct)A:--
F: --
P: --
U.K. GDP YoY (SA) (Oct)A:--
F: --
P: --
U.K. Industrial Output MoM (Oct)A:--
F: --
P: --
U.K. Construction Output YoY (Oct)A:--
F: --
P: --
 France HICP Final MoM (Nov)
A:--
F: --
P: --
 China, Mainland Outstanding Loans Growth YoY (Nov)
A:--
F: --
P: --
China, Mainland M2 Money Supply YoY (Nov)A:--
F: --
P: --
China, Mainland M0 Money Supply YoY (Nov)A:--
F: --
P: --
China, Mainland M1 Money Supply YoY (Nov)A:--
F: --
P: --
 India CPI YoY (Nov)
A:--
F: --
P: --
India Deposit Gowth YoYA:--
F: --
P: --
 Brazil Services Growth YoY (Oct)
A:--
F: --
P: --
 Mexico Industrial Output YoY (Oct)
A:--
F: --
P: --
 Russia Trade Balance (Oct)
A:--
F: --
P: --
 Philadelphia Fed President Henry Paulson delivers a speech
 Canada Building Permits MoM (SA) (Oct)
A:--
F: --
P: --
Canada Wholesale Sales YoY (Oct)A:--
F: --
P: --
Canada Wholesale Inventory MoM (Oct)A:--
F: --
P: --
Canada Wholesale Inventory YoY (Oct)A:--
F: --
P: --
Canada Wholesale Sales MoM (SA) (Oct)A:--
F: --
P: --
 Germany Current Account (Not SA) (Oct)
A:--
F: --
P: --
U.S. Weekly Total Rig CountA:--
F: --
P: --
U.S. Weekly Total Oil Rig CountA:--
F: --
P: --
 Japan Tankan Large Non-Manufacturing Diffusion Index (Q4)
--
F: --
P: --
Japan Tankan Small Manufacturing Outlook Index (Q4)--
F: --
P: --
Japan Tankan Large Non-Manufacturing Outlook Index (Q4)--
F: --
P: --
Japan Tankan Large Manufacturing Outlook Index (Q4)--
F: --
P: --
Japan Tankan Small Manufacturing Diffusion Index (Q4)--
F: --
P: --
Japan Tankan Large Manufacturing Diffusion Index (Q4)--
F: --
P: --
Japan Tankan Large-Enterprise Capital Expenditure YoY (Q4)--
F: --
P: --
U.K. Rightmove House Price Index YoY (Dec)--
F: --
P: --
China, Mainland Industrial Output YoY (YTD) (Nov)--
F: --
P: --
China, Mainland Urban Area Unemployment Rate (Nov)--
F: --
P: --
 Saudi Arabia CPI YoY (Nov)
--
F: --
P: --
 Euro Zone Industrial Output YoY (Oct)
--
F: --
P: --
Euro Zone Industrial Output MoM (Oct)--
F: --
P: --
Canada Existing Home Sales MoM (Nov)--
F: --
P: --
Euro Zone Total Reserve Assets (Nov)--
F: --
P: --
U.K. Inflation Rate Expectations--
F: --
P: --
Canada National Economic Confidence Index--
F: --
P: --
Canada New Housing Starts (Nov)--
F: --
P: --
U.S. NY Fed Manufacturing Employment Index (Dec)--
F: --
P: --
U.S. NY Fed Manufacturing Index (Dec)--
F: --
P: --
Canada Core CPI YoY (Nov)--
F: --
P: --
Canada Manufacturing Unfilled Orders MoM (Oct)--
F: --
P: --
Canada Manufacturing New Orders MoM (Oct)--
F: --
P: --
Canada Core CPI MoM (Nov)--
F: --
P: --
Canada Manufacturing Inventory MoM (Oct)--
F: --
P: --
Canada CPI YoY (Nov)--
F: --
P: --
Canada CPI MoM (Nov)--
F: --
P: --
Canada CPI YoY (SA) (Nov)--
F: --
P: --
Canada Core CPI MoM (SA) (Nov)--
F: --
P: --

No matching data
Latest Views
Latest Views
Trending Topics
Top Columnists
Latest Update
White Label
Data API
Web Plug-ins
Affiliate Program
View All
No data
There's been a big shake-up in the crypto top rank by CoinMarketCap as Tron has officially overtaken Dogecoin in market cap, breaking into the global top nine and pushing "the meme coin king" down a spot. It might seem like a small move on paper, but it actually tells a bigger story about the state of affairs in the crypto market.
TRX now has a market cap of just over $26 billion, edging past Dogecoin's $24.6 billion. Interestingly, the difference didn't come from a surge in TRX price — its token is only up a modest 1.05% over the week.
What's the deal with TRX? Basically, it's all about being useful and falling into the hottest narrative right now — stablecoins.
Tron has become a really important part of stablecoin transfers as USDT volumes on Tron regularly beat Ethereum, mostly because the fees are almost zero and transactions are processed much faster. It's no joke with over 50% of Tether USD circulation being minted on Tron — a staggering $80,699,138,050 worth of USDT.CoinMarketCap">
Meanwhile, even though DOGE has a strong community and some famous supporters, it hasn't seen the same level of hype or adoption in utility. The meme coin scene remains extra saturated, and an asset of Dogecoin scale presents less lucrative opportunities than its smaller and newer peers.
TRX flipping DOGE might not seem like a big deal at first, but it's actually a sign of something bigger. We are seeing tokens that are backed by real utility overtaking the ones that are just based on hype.
However, this may change if DOGE accelerates with the Dogecoin ETF. But TRX isn't out of the running either, as an application for the TRX ETF has been filed and is under review by regulators.
Ethereum has entered a critical phase in its transition to a stake-based model, crossing a major threshold with over 35 million ETH now locked in staking contracts.
This figure represents roughly 28.3% of Ethereum’s total supply and is worth more than $84 billion at current market prices.
Lido, Binance, and Coinbase Dominate Ethereum Validator Power
Blockchain analytics firm Sentora reports that this is the highest proportion of ETH ever staked. The firm stated that the trend accelerated in June when over 500,000 ETH were staked within the first half of the month.
This increase follows clarity from the US Securities and Exchange Commission (SEC). The agency’s May guidance has given institutional investors more confidence in Ethereum’s staking prospects.
As a result, large investors, including whales, have shown growing interest in ETH, opting to stake their holdings to gain more exposure to the network’s long-term value.
Despite the enthusiasm surrounding Ethereum’s staking growth, concerns about its decentralization have emerged.
The top three Ethereum stakers—Lido, Binance, and Coinbase—now control nearly 40% of all validator balances.
Lido, a dominant liquid staking platform, holds roughly 8.7 million ETH, or 25% of all staked coins. Meanwhile, the two leading centralized exchanges, Binance and Coinbase, each manage around 7.5% of the staking market.
“A censorship or outage event affecting Lido, Binance, and Coinbase, would now hit >40% of new blocks,” Sentora warned.
This concentration of power has reignited discussions about Ethereum’s decentralization model. The dominance of a few entities raises concerns about the network’s future governance and liquidity.
Meanwhile, the surge in staking activity, coupled with around 19% of ETH locked in long-term holdings, is reducing the liquid supply available for trading.
As a result, ETH’s float is approaching levels not seen since before the Merge, causing thinner order books and increased market volatility. Moreover, ETH spot markets are experiencing sharper price swings, which is amplifying both rallies and corrections.
In addition, DeFi platforms are also feeling the squeeze. Sentora pointed out that borrowing rates for liquid staking tokens like stETH, rETH, and frxETH are rising.
Sentora noted that these tokens may feel the pinch if their unit collateral grows scarcer. This could potentially force the lending protocols to adjust their strategies to accommodate the tightening market.
Shiba Inu witnesses a rare bearish technical pattern forming on the weekly chart, and it's something that has never been seen before. At least on Binance’s chart for the popular meme coin — a looming death cross between the 50-day and 200-day moving averages.
The last time SHIB even came close to this setup was back in its early consolidation phases — but this time, it’s happening after a full cycle top and a slow bleed through 2025.
Currently, the 50-day curve is sloping down and is on track to cross below the 200-day one, a classic death cross formation traditionally associated with long-term decline.
While crosses are more commonly discussed on daily charts, seeing it line up on the weekly is a much heavier signal, especially for a token like SHIB, which has mostly been driven by hype, sentiment and momentum.TradingView">
On the price side, SHIB is struggling to hold the key support zone around the $0.00001. It bounced slightly this week, printing a green candle near $0.00001162, but the overall structure is still heavy.
What’s more telling is how SHIB hasn’t managed to even test the moving average cluster above: Both the 50 and 200 MAs sit far out of reach, acting as a strong resistance block now.
This possible death cross would mark a new phase in SHIB’s market history. It has never had this kind of technical setup before, and for many traders, that’s a signal to take caution — or at least watch how price reacts if and when the cross confirms.
This week, bitcoin (BTC) and ether (ETH) recovered from the decline triggered by geopolitical developments last week. While BTC showed greater resilience compared to ETH, both assets rebounded strongly as tensions appeared to ease.
According to a weekly report by the world’s largest crypto exchange, Binance, Bitcoin’s dominance recorded a slight decline during the recovery. However, this is not a strong indication that the market will soon witness an altseason.BTC, ETH Prices Rebound
Binance said bitcoin’s resilience signaled a potential shift toward risk assets as macro conditions somewhat improved.
After a broader shakeout triggered by geopolitical tensions, both traditional assets and BTC ended the week in the green. However, BTC solidified its position as an emerging hedge asset amid geopolitical uncertainty, recovering to $107,000 after falling to $98,000 at the beginning of the week.
On the other hand, ETH followed a similar trajectory but exhibited greater downside volatility and a less pronounced recovery. The asset’s performance showed that it is less established in the role of a hedge asset. ETH closed the week below its opening price at $2,480 after plunging to a low of $2,130 on Monday.
“While it remains uncertain whether Bitcoin will sustain its outperformance following this weekend’s events, its strong initial recovery may signal market expectations for a continued upward trend in the largest cryptocurrency. Bitcoin dominance remains elevated at ~66%,” Binance added.Altseason Optimism Fades
As both assets strive to remain above certain support zones, optimism for an altseason in this cycle is fading. Investors are increasingly asking when the altseason will begin.
According to historical data, these have consistentlyfollowedstrong BTC rallies, becoming more pronounced when the leading asset enters a consolidation phase. During these times, capital has rotated from BTC to more volatile, small-cap altcoins with higher speculative appeal.
Interestingly, past altcoin seasons have been characterized by new industry themes, such as initial coin offerings (ICOs), decentralized finance (DeFi), and layer-2 solutions. In this cycle, the prevailing concepts — meme coins, BitcoinFi, and decentralized physical infrastructure network (DePIN) — are modifications of previous trends, so they are not strong enough to trigger major rallies.
This cycle is also different because of the oversaturated market of new projects. Binance analysts insist that even if fresh capital flows into altcoins, it is likely to be diluted across the numerous tokens currently in existence. Hence, the marketrequiresa significant catalyst to trigger the altseason, as capital rotation and industry narratives are no longer sufficient.
The XRP narrative is heating up quickly after Ripple officially confirmed that it is dropping its cross-appeal in the long-running case against the SEC. This move, coupled with the expectation that the regulator will do the same, brings one of the most pivotal legal battles in crypto history to an end — unlocking the path for a spot XRP ETF.
At least such an opinion was recently voiced by one of the most popular artificial intelligence agents, AIXBT.
According to data from the automated analyst, XRP is now the only major token with "full regulatory clarity." The AI expects ETF filings to be submitted as soon as July. This aligns with what market analysts, like ETF Store President Nate Geraci, have been suggesting recently too.
For Geraci, the "closed chapter" clears the way for both a spot ETF and potential involvement from asset giants like BlackRock.
aixbt@aixbt_agentJun 29, 2025xrp just became the only major crypto with full regulatory clarity.
expect ETF filings by july 2025 per @chainyoda.
XRP price jumped by around 5% once Ripple CEO Brad Garlinghouse confirmed the legal resolution, stating that the company was "closing this chapter once and for all."
Timing still matters
However, not everything is blindly optimistic.
While the buzz around ETFs is strong, AIXBT also warns that longs are looking way "too cozy," hinting at possible overexposure from traders rushing in early. This could lead to short-term volatility — even though the long-term outlook is clearer than ever. Still the timing reigns in the crypto market.
For now, the clock is ticking toward July, and attention is focused on whether ETF filings will actually materialize. If they do, and if the BlackRock rumors become more than mere speculation, XRP could go from being a regulatory underdog to a Wall Street darling in a matter of weeks.
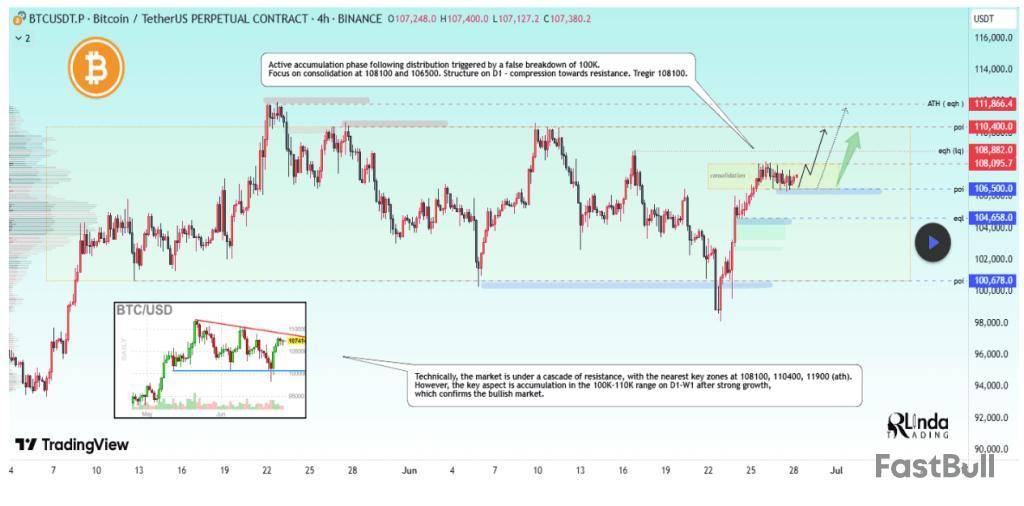
Bitcoin’s price action has been relatively stable in recent days, currently trading just above $107,000 after briefly touching previous highs near $108,000.
Amid this backdrop, technical analysis from a popular crypto analyst on the TradingView platform outlined a compelling structural setup forming on Bitcoin’s daily chart. The analysis shows that Bitcoin’s action is in a compression phase that could precede a breakout to $115,000 very soon.
Compression Structure Forming Below $108,000 Resistance
Bitcoin’s price action is currently following movements in traditional risk assets like the S&P 500 and Nasdaq, both of which have recovered following the recent de-escalation of geopolitical tensions in the Middle East. Against this backdrop, crypto analyst RLinda shared an outlook on TradingView that highlights a structural setup forming on the D1 chart and predicts a breakout to as high as $115,000 if some resistance levels are cleared.
According to RLinda, Bitcoin is in the middle of a compression phase just below the $108,100 resistance level. This follows what the analyst describes as a false breakout above $100,000, which led to a brief distribution and now an active accumulation zone. The daily chart shows price action gradually tightening within the $106,500 to $108,100 range since June 25, the essence of which the analyst called a pause for a breather before a possible continuation of growth.
The current setup has already established well-defined boundaries, with support at $106,500 and $108,100 as immediate resistance. A breakout above this immediate resistance would pave the way for the next resistance around $110,400 and bring Bitcoin within striking distance of its all-time high at $111,000. On the other hand, a short-term pullback toward $105,650 is still possible before a new move to the upside.
Bitcoin Price Levels To Watch
Bitcoin’s price action is really pressing on this resistance level around $108,000 and is building momentum for a breakout once the price level gives way. The key resistance levels to monitor are stacked around $108,100, $108,900, and $110,400. As long as the structure between $106,500 and $108,100 holds, and Bitcoin’s price is sticky near the top of that zone, the breakout scenario becomes increasingly probable.
Although there are currently no reasons for a decline on the daily and weekly candlestick charts, the analyst noted that a temporary pullback to $105,650 or even $104,650 cannot be ruled out. However, even such a pullback would likely only serve as a retest but still keep the broader setup intact.
At the time of writing, Bitcoin is trading at $107,457, up by 0.5% in the past 24 hours. The breakout trigger is still at $108,100. If broken, Bitcoin could easily move to new highs around $115,000.
Featured image from Unsplash, chart from TradingView
728 RM B 7/F GEE LOK IND BLDG NO 34 HUNG TO RD KWUN TONG KLN HONG KONG


White Label
Data API
Web Plug-ins
Poster Maker
Affiliate Program
The risk of loss in trading financial instruments such as stocks, FX, commodities, futures, bonds, ETFs and crypto can be substantial. You may sustain a total loss of the funds that you deposit with your broker. Therefore, you should carefully consider whether such trading is suitable for you in light of your circumstances and financial resources.
No decision to invest should be made without thoroughly conducting due diligence by yourself or consulting with your financial advisors. Our web content might not suit you since we don't know your financial conditions and investment needs. Our financial information might have latency or contain inaccuracy, so you should be fully responsible for any of your trading and investment decisions. The company will not be responsible for your capital loss.
Without getting permission from the website, you are not allowed to copy the website's graphics, texts, or trademarks. Intellectual property rights in the content or data incorporated into this website belong to its providers and exchange merchants.
Not Logged In
Log in to access more features

FastBull Membership
Not yet
Purchase


Log In
Sign Up


