


CONTACT: The Schall Law Firm Brian Schall, Esq.www.schallfirm.com Office: 310-301-3335info@schallfirm.com
SOURCE: The Schall Law Firm


Signal Accounts for Members
All Signal Accounts
All Contests
 Japan Tankan Small Manufacturing Outlook Index (Q4)
A:--
F: --
P: --
Japan Tankan Large Non-Manufacturing Outlook Index (Q4)A:--
F: --
P: --
Japan Tankan Large Manufacturing Outlook Index (Q4)A:--
F: --
P: --
Japan Tankan Small Manufacturing Diffusion Index (Q4)A:--
F: --
P: --
Japan Tankan Large Manufacturing Diffusion Index (Q4)A:--
F: --
P: --
Japan Tankan Large-Enterprise Capital Expenditure YoY (Q4)A:--
F: --
P: --
 U.K. Rightmove House Price Index YoY (Dec)
A:--
F: --
P: --
 China, Mainland Industrial Output YoY (YTD) (Nov)
A:--
F: --
P: --
China, Mainland Urban Area Unemployment Rate (Nov)A:--
F: --
P: --
 Saudi Arabia CPI YoY (Nov)
A:--
F: --
P: --
 Euro Zone Industrial Output YoY (Oct)
A:--
F: --
P: --
Euro Zone Industrial Output MoM (Oct)A:--
F: --
P: --
 Canada Existing Home Sales MoM (Nov)
A:--
F: --
P: --
Canada National Economic Confidence IndexA:--
F: --
P: --
Canada New Housing Starts (Nov)A:--
F: --
 U.S. NY Fed Manufacturing Employment Index (Dec)
A:--
F: --
P: --
U.S. NY Fed Manufacturing Index (Dec)A:--
F: --
P: --
Canada Core CPI YoY (Nov)A:--
F: --
P: --
Canada Manufacturing Unfilled Orders MoM (Oct)A:--
F: --
P: --
U.S. NY Fed Manufacturing Prices Received Index (Dec)A:--
F: --
P: --
U.S. NY Fed Manufacturing New Orders Index (Dec)A:--
F: --
P: --
Canada Manufacturing New Orders MoM (Oct)A:--
F: --
P: --
Canada Core CPI MoM (Nov)A:--
F: --
P: --
Canada Trimmed CPI YoY (SA) (Nov)A:--
F: --
P: --
Canada Manufacturing Inventory MoM (Oct)A:--
F: --
P: --
Canada CPI YoY (Nov)A:--
F: --
P: --
Canada CPI MoM (Nov)A:--
F: --
P: --
Canada CPI YoY (SA) (Nov)A:--
F: --
P: --
Canada Core CPI MoM (SA) (Nov)A:--
F: --
P: --
Canada CPI MoM (SA) (Nov)A:--
F: --
P: --
Federal Reserve Board Governor Milan delivered a speech U.S. NAHB Housing Market Index (Dec)--
F: --
P: --
 Australia Composite PMI Prelim (Dec)
--
F: --
P: --
Australia Services PMI Prelim (Dec)--
F: --
P: --
Australia Manufacturing PMI Prelim (Dec)--
F: --
P: --
Japan Manufacturing PMI Prelim (SA) (Dec)--
F: --
P: --
U.K. 3-Month ILO Employment Change (Oct)--
F: --
P: --
U.K. Unemployment Claimant Count (Nov)--
F: --
P: --
U.K. Unemployment Rate (Nov)--
F: --
P: --
U.K. 3-Month ILO Unemployment Rate (Oct)--
F: --
P: --
U.K. Average Weekly Earnings (3-Month Average, Including Bonuses) YoY (Oct)--
F: --
P: --
U.K. Average Weekly Earnings (3-Month Average, Excluding Bonuses) YoY (Oct)--
F: --
P: --
 France Services PMI Prelim (Dec)
--
F: --
P: --
France Composite PMI Prelim (SA) (Dec)--
F: --
P: --
France Manufacturing PMI Prelim (Dec)--
F: --
P: --
 Germany Services PMI Prelim (SA) (Dec)
--
F: --
P: --
Germany Manufacturing PMI Prelim (SA) (Dec)--
F: --
P: --
Germany Composite PMI Prelim (SA) (Dec)--
F: --
P: --
Euro Zone Composite PMI Prelim (SA) (Dec)--
F: --
P: --
Euro Zone Services PMI Prelim (SA) (Dec)--
F: --
P: --
Euro Zone Manufacturing PMI Prelim (SA) (Dec)--
F: --
P: --
U.K. Services PMI Prelim (Dec)--
F: --
P: --
U.K. Manufacturing PMI Prelim (Dec)--
F: --
P: --
U.K. Composite PMI Prelim (Dec)--
F: --
P: --
Euro Zone ZEW Economic Sentiment Index (Dec)--
F: --
P: --
Germany ZEW Current Conditions Index (Dec)--
F: --
P: --
Germany ZEW Economic Sentiment Index (Dec)--
F: --
P: --
Euro Zone Trade Balance (Not SA) (Oct)--
F: --
P: --
Euro Zone ZEW Current Conditions Index (Dec)--
F: --
P: --
Euro Zone Trade Balance (SA) (Oct)--
F: --
P: --
U.S. Retail Sales MoM (Excl. Automobile) (SA) (Oct)--
F: --
P: --

No matching data
Latest Views
Latest Views
Trending Topics
Top Columnists
Latest Update
White Label
Data API
Web Plug-ins
Affiliate Program
View All
No data
By Milana Vinn
NEW YORK, Aug 16 (Reuters) - Investment firms TA Associates and Silversmith Capital Partners are exploring options including the sale of a stake in Appfire, in a deal that could value the collaboration software maker they own at more than $2 billion, according to people familiar with the matter.
TA and Silversmith have tapped investment bankers at JPMorgan Chase JPM.N and Lazard LAZ.N as they weigh selling up to a 60% stake in Appfire, the sources said, adding that the owners could roll over a portion of their stakes as part of a potential deal.
The sources, who requested anonymity as the discussions are confidential, said potential buyers of the stake include other private-equity firms.
Appfire is hoping to command a valuation equivalent to more than 20 times its earnings before interest, taxes, depreciation and amortization of roughly $100 million, the sources said. The company is expected to generate close to $300 million in revenue for 2024, the sources said, adding it is growing revenues by 30% annually.
Silversmith, JPMorgan, and Lazard declined to comment. TA Associates and Appfire did not respond to requests for comment.
Burlington, Massachusetts-based Appfire provides workflow collaboration software to customers, including German shoe and sports apparel giant Adidas ADSGn.DE, e-signature company Docusign DOCU.O, and NASA.
Its software applications are sold through platforms of large technology corporations including Microsoft MSFT.O, Salesforce CRM.N, Atlassian TEAM.O, and monday.com.
Smartsheet SMAR.N, a U.S. maker of workplace collaboration software with a market value of $6.6 billion, has tapped investment bankers after attracting acquisition interest from buyout firms, Reuters reported in July.
TA picked up a significant stake in Appfire in 2021, a year after Silversmith made a $49-million investment in the company.
(Reporting by Milana Vinn in New York; Editing by Rod Nickel)
(( Milana.Vinn@thomsonreuters.com ; Twitter: https://twitter.com/MilanaVinn; Reuters Messaging: Signal/Telegram/WhatsApp: +1(347) 463-7957) )
Keywords: APPFIRE-M&A/
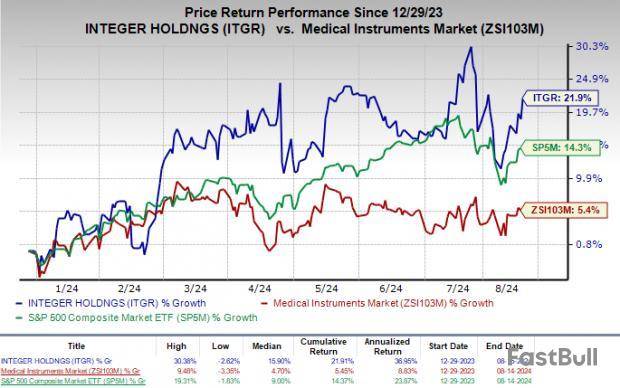
Integer Holdings ITGR witnessed strong momentum year to date. Shares of the company have gained 21.9% compared with 5.4% growth of the industryin the same time frame. The S&P 500 Composite has risen 14.3% during the same period.
With healthy fundamentals and strong growth opportunities, this Zacks Rank #3 (Hold) company appears to be a solid wealth creator for its investors at the moment.
Plano, TX-based Integer Holdings manufactures and develops medical devices and components primarily for original equipment manufacturers.
Integer Holdings operates through two segments — Medical Sales and Non-Medical Sales. Medical Sales has three sub-segments — Advanced Surgical, Orthopedics and Portable Medical (AS&O); Cardio and Vascular (C&V); and Cardiac Rhythm Management & Neuromodulation (CRM&N).
Catalysts Driving Growth
Integer Holdings is witnessing an upward trend in its stock price, prompted by its execution of manufacturing excellence initiatives, an improved supply chain, and a direct labor environment. The optimism led by a solid second-quarter 2024 performance and its strength in Medical sales are expected to contribute further.
Investors seemed to be optimistic about Integer Holdings’ stable footing in the cardiac, neuromodulation, orthopedics, vascular and advanced surgical markets. Its primary customers include large, multi-national original equipment manufacturers and their affiliated subsidiaries.
Per the management, Cardiac Rhythm Management and Neuromodulations trailing four-quarter sales have increased 12% year over year, primarily driven by double-digit CRM growth from strong customer demand and double-digit neuromodulation growth from emerging PMA customers. The Cardio and Vascular product line sales in the last four quarters increased 18% year over year. The uptick is driven by strong customer demand and sales from the InNeuroCo and Pulse acquisitions.
Integer Holdings exited the second quarter of 2024 with better-than-expected results. The strong year-over-year top-line and bottom-line performances were impressive. Robust performances by the Medical segment and strength in all the product lines of the Medical segment were encouraging. These factors must have aided in surging the stock’s price.
Integer Holdings generated a gross profit of $119.4 million in the second quarter, up 12.8% year over year. The gross margin in the second quarter expanded 92 basis points (bps) to 27.4%. Adjusted operating profit totaled $56.2 million in the second quarter, reflecting a 30.3% uptick from the prior-year quarter. Adjusted operating margin in the second quarter expanded 211 bps to 12.9%. The expansion of both margins bodes well for the stock and has contributed to raising the price of the stock.
Risk Factors
Integer Holdings’ business depends on a continuous supply of raw materials. The supply and price of raw materials may be susceptible to fluctuations due to transportation issues, government regulations and price controls, among others. Significant increases in the cost of raw materials, which cannot be recovered through increases in the prices of the company’s products, could affect its operating results.
A Look at Estimates
Integer Holdings’earnings per share (EPS) in 2024 and 2025 are expected to grow 13.7% and 14.3% to $5.31 and $6.07 on a year-over-year basis, respectively. The Zacks Consensus Estimate for 2024 EPS has increased 4 cents and remained unchanged for 2025 in the past 30 days.
Revenues for 2024 and 2025 are anticipated to rise 9.6% and 7.6% to $1.75 billion and $1.88 billion, respectively, on a year-over-year basis.
Stocks to Consider
Some better-ranked stocks in the broader medical space are Universal Health Service UHS, Quest Diagnostics DGX and ABM Industries ABM. While Universal Health Service sports a Zacks Rank #1 (Strong Buy), Quest Diagnostics and ABM Industries carry a Zacks Rank #2 (Buy). You can see the complete list of today’s Zacks #1 Rank stocks here.
Universal Health Service has an estimated long-term growth rate of 19%. UHS’ earnings surpassed estimates in each of the trailing four quarters, with the average being 14.58%.
Universal Health Service has gained 41.1% compared with the industry's 34.8% rise so far this year.
Quest Diagnostics has an estimated long-term growth rate of 6.20%. DGX’s earnings surpassed estimates in each of the trailing four quarters, with the average surprise being 3.31%.
Quest Diagnostics shares have gained 3.7% so far this year compared with the industry’s 10.2% rise.
ABM Industries’ earnings surpassed estimates in each of the trailing four quarters, delivering an average surprise of 7.34%.
ABM's shares have risen 24.1% so far this year compared with the industry’s 11.9% growth.
Zacks Investment Research
Companies are actively pursuing automation solutions to enhance productivity and streamline their operations. Therefore, investors could consider buying fundamentally sound tech stocks, DocuSign, Inc. , Box, Inc. , and RingCentral, Inc. with explosive potential.
Businesses are showing a growing interest in technology solutions that enhance business operations and boost efficiency. Services like cloud computing, cybersecurity, and artificial intelligence are among the most in-demand. Revenue in the IT services sector is expected to grow at a CAGR of 5.8% by 2029.
Additionally, the global Software as a Service (SaaS) market is propelled by the increasing dependence on SaaS solutions that provide real-time threat intelligence and monitoring, the growing need for payment gateways and inventory management in e-commerce, and the expanding use of customer relationship management (CRM) solutions.
IMARC Group expects the global SaaS market to grow at a CAGR of 15.5% by 2032.
Given these favorable industry trends, let us dive deep into the fundamentals of the top tech stocks, beginning with the third choice:
Stock #3: DocuSign, Inc. (DOCU)
DOCU offers electronic signature solutions internationally. The company provides an e-signature solution that enables the sending and signing of agreements, Contract Lifecycle Management that automates workflows, Document Generation streamlines the process of generating new, custom agreements, and more.
Over the past three years, DOCU’s revenue has grown at a CAGR of 20%. Also, the company’s total assets and levered free cash have increased at CAGRs of 8.4% and 19.9%, respectively, over the same period.
On June 4, DOCU announced the upcoming launch of its new Docusign Connector for SAP Ariba solutions, which is a new offering to automate workflows between Docusign CLM and SAP Ariba solutions to help businesses accelerate time to value and eliminate friction in source-to-pay agreement processes.
The new connector will be available globally starting from September. The launch reinforces DOCU’s commitment to its partnership with SAP and its vision to transform agreement processes across the source-to-pay workflow.
On May 31, DOCU acquired Lexion, a leading AI-powered agreement management company. The strategic acquisition strengthens DOCU’s Intelligent Agreement Management (IAM) position and introduces new AI-assisted capabilities to the Docusign IAM platform.
For the first quarter that ended April 30, 2024, DOCU’s total revenue increased 7.3% year-over-year to $709.64 million. Its non-GAAP gross profit rose 6.5% from the year-ago value to $582.17 million. The company’s non-GAAP income from operations of $202.09 million indicates growth of 15% from the prior year’s quarter.
In addition, the company’s non-GAAP net income came in at $172.84 million and $0.82 per share, up 15.1% and 13.9% from the prior year’s quarter, respectively.
As per the company’s second-quarter 2024 guidance, DOCU expects total revenue between $725 million and $729 million, and its subscription revenue is expected to range from $705 million to $709 million. For the full year, the company expects total revenue of $2.92 billion - $2.93 billion and subscription revenue of $2.84 billion to $2.85 billion.
Analysts expect DOCU’s revenue and EPS for the second quarter (ended July 2024) to increase 5.8% and 11.8% year-over-year to $727.23 million and $0.80, respectively. Moreover, the company topped the consensus revenue and EPS estimates in all four trailing quarters.
DOCU’s stock has surged 32.4% over the past nine months and 14.5% over the past year to close the last trading session at $56.46.
DOCU’s POWR Ratings reflect its promising outlook. The stock has an overall rating of A, which translates to a Strong Buy in our proprietary rating system. The POWR Ratings are calculated by considering 118 different factors, with each factor weighted to an optimal degree.
DOCU has an A grade for Growth and Quality and a B for Value. It is ranked first among 18 stocks in the A-rated Software - SAAS industry.
Box, Inc. (BOX)
BOX provides a cloud content management platform that enables organizations of various sizes to manage and share their content from anywhere on any device. It serves financial services, health care, government, and legal services industries internationally.
On June 27, 2024, BOX announced powerful enhancements to BOX AI, including unlimited queries for Enterprise Plus customers, integration with GPT-4, and support for more file types. New features are expected to improve content management and workflow efficiency using advanced AI capabilities.
BOX’s revenue grew at a CAGR of 10% over the past three years, and its EBITDA grew at a CAGR of 23% during the same period.
In terms of the trailing-12-month Return on Total Capital, BOX’s 6.99% is 146.2% higher than the 2.84% industry average. Likewise, its 11.73% trailing-12-month Return on Total Assets is 440% higher than the industry average of 2.17%. Its 0.92x trailing-12-month asset turnover ratio is 48.9% higher than the industry average of 0.62x.
BOX’s revenues for the first quarter ended April 30, 2024, increased 5.1% year-over-year to $264.66 million. Its non-GAAP gross profit increased 8.1% year-over-year to $212.18 million. The company’s non-GAAP operating income increased 22.7% year-over-year to $70.40 million.
Additionally, its non-GAAP attributable net income increased 22.9% year-over-year to $58.40 million. Its non-GAAP attributable net income per share increased 21.9% year-over-year to $0.39. Also, the company’s non-GAAP free cash flow came in at $123.24 million, representing an increase of 13.9% year-over-year.
BOX expects its revenue for the quarter ended July 31, 2024, to be between $268 million and $270 million, showing a 3% increase year-over-year. Also, its non-GAAP diluted net income per share is expected to be between $0.40 and $0.41.
Analysts expect BOX’s EPS and revenue for the quarter ended July 31, 2024, to increase 12.5% and 3% year-over-year to $0.41 and $269.20 million, respectively. It surpassed the revenue and EPS estimates in three of the trailing four quarters. Over the past nine months, the stock has gained 6.8% to close the last trading session at $28.01.
BOX’s strong fundamentals are reflected in its POWR Ratings. It has an overall rating of A, which equates to a Strong Buy in our proprietary rating system.
The stock has an A grade for Quality and Growth and a B for Value. BOX is ranked #8 in the Technology - Services industry.
Beyond what is stated above, we’ve also rated BOX for Sentiment, Stability, and Momentum. Get all BOX ratings here.
RingCentral, Inc. (RNG)
RingCentral, along with its subsidiaries, provides cloud communications, video meetings, collaboration, and contact center software-as-a-service solutions worldwide. The company’s products include RingCentral Message Video Phone, RingCentral Contact Center, RingCX, RingCentral Video, and RingCentral Professional Services, serving various industries.
Over the past three years, RNG’s revenue has grown at a CAGR of 24.2%. Also, the company’s total assets and levered free cash have increased at CAGRs of 122.6% and 41.1%, respectively, over the same period.
In terms of the trailing-12-month gross profit margin, RNG’s 70.24% is 41.4% higher than the 49.68% industry average. Likewise, its 24.68% trailing-12-month levered FCF margin is 137.3% higher than the 10.40% industry average. Furthermore, its 1.22x trailing-12-month asset turnover ratio is 96.9% higher than the 0.62x industry average.
For the second quarter that ended June 30, 2024, RNG’s total revenues increased 93.9% year-over-year to $592.91 million. Its non-GAAP income from operations rose 18.9% from the year-ago value to $124.19 million. The company’s non-GAAP net income of $86.20 million indicates growth of 7.7% from the prior year’s quarter.
In addition, the company’s non-GAAP net income per share came in at $0.91, up 9.7% from the prior year’s quarter.
Analysts expect RNG’s revenue and EPS for the third quarter (ending September 2024) to increase 7.9% and 18.2% year-over-year to $602.17 million and $0.92, respectively. Moreover, the company topped the consensus revenue and EPS estimates in all four trailing quarters.
RNG’s stock has surged 11.7% over the past nine months and 13.4% over the past year to close the last trading session at $33.96.
RNG’s POWR Ratings reflect bright prospects. The stock has an overall rating of A, which equates to a Strong Buy in our proprietary rating system.
RNG has an A grade for Growth and Value and a B for Quality. It is ranked #6 out of 39 stocks in the B-rated Software - Business industry.
In addition to the POWR Ratings highlighted above, one can access RNG’s ratings for Momentum, Stability, and Sentiment here.
What To Do Next?
Get your hands on this special report with 3 low priced companies with tremendous upside potential even in today’s volatile markets:
3 Stocks to DOUBLE This Year >
DOCU shares were trading at $56.67 per share on Friday afternoon, up $0.21 (+0.37%). Year-to-date, DOCU has declined -4.68%, versus a 17.36% rise in the benchmark S&P 500 index during the same period.
Palantir Technologies, Inc. stock is moving higher on Friday on continued strength following recent developments.
The stock spiked recently after the company reported S2 earnings and announced a new partnership with Microsoft last week. In terms of earnings, the company reported adjusted EPS of nine cents beating analysts estimate of eight cents and sales of $678.13 million beating analysts estimate of $652.10 million.
Palantir’s new partnership with Microsoft will bring enhanced data analytics and artificial intelligence services to the U.S. Defense and Intelligence Community.
How To Buy Palantir Technologies Stock
Besides going to a brokerage platform to purchase a share – or fractional share – of stock, you can also gain access to shares either by buying an exchange traded fund (ETF) that holds the stock itself, or by allocating yourself to a strategy in your 401(k) that would seek to acquire shares in a mutual fund or other instrument.
For example, in Palantir Technologies 's case, it is in the Information Technology sector. An ETF will likely hold shares in many liquid and large companies that help track that sector, allowing an investor to gain exposure to the trends within that segment.
Related Link: What’s Going On With Rocket Lab Stock Today?
PLTR Price Action: At the time of writing, Palantir shares are moving 4.18% higher at $32.53 per data from Benzinga Pro.
Image :Photo by Iljanaresvara Studio on Shutterstock
© 2024 Benzinga.com. Benzinga does not provide investment advice. All rights reserved.
It has been about a month since the last earnings report for U.S. Bancorp . Shares have lost about 3.6% in that time frame, underperforming the S&P 500.
Will the recent negative trend continue leading up to its next earnings release, or is U.S. Bancorp due for a breakout? Before we dive into how investors and analysts have reacted as of late, let's take a quick look at the most recent earnings report in order to get a better handle on the important drivers.
U.S. Bancorp's Q2 Earnings Beat on Lower Expenses
U.S. Bancorp’s second-quarter 2024 adjusted earnings per share (excluding the impact of notable items) of 98 cents beat the Zacks Consensus Estimate by 2%. However, the bottom line declined 12.5% from the prior-year quarter's level.
Results have benefited from higher deposits and lower expenses. However, a decline in net interest income (NII) was a major headwind.
Net income (GAAP basis) attributable to U.S. Bancorp was $1.60 billion, up 17.8% from the prior-year quarter's level.
Revenues & Expenses Fall
Total revenues in the reported quarter were $6.84 billion, down 4.4% year over year. The top line surpassed the Zacks Consensus Estimate by a whisker.
The tax-equivalent NII totaled $4.05 billion, down 8.9% from the year-ago quarter's level. The downside was primarily due to the impact of higher interest rates on deposit mix and pricing, partially offset by higher rates on earning assets and balance sheet optimization activities.
The net interest margin of 2.67% contracted 23 basis points year over year.
Non-interest income moved up 3.3% year over year to $2.82 billion. The uptick was driven by a higher fee revenue across most categories.
Non-interest expenses declined 7.8% year over year to $4.21 billion. The fall was due to prudent expense management, continued focus on operational efficiency and synergies from the acquisition of MUFG Union Bank , partially offset by higher marketing and business development expenses.
The efficiency ratio was 61%, lower than the year-ago quarter’s figure of 63.7%. A decline in the ratio indicates an improvement in profitability.
Average total loans declined 3.6% to $374.69 billion from the year-ago quarter. Average total deposits increased 3.3% from the previous year's quarter level to $513.90 billion.
Credit Quality: Mixed Bag
Total allowance for credit losses was $7.93 billion, up 3.1% year over year. As of Jun 30, 2024, U.S. Bancorp’s non-performing assets amounted to $1.85 billion, up 70.7% from the year-ago period's level.
The increase in nonperforming assets was chiefly due to higher commercial and commercial real estate nonperforming loans.
Net charge-offs were $538 million, down from $649 million in the year-ago quarter. The provision for credit losses in the reported quarter was $568 million, down 30.8% from the prior-year quarter's level.
Capital Ratios Improve
The Tier 1 capital ratio was 11.9% as of Jun 30, 2024, up from 10.6% in the prior-year quarter. The Common Equity Tier 1 capital ratio under the Basel III standardized approach was 10.3% as of Jun 30, 2024, up from 9.1% in the year-ago quarter.
The tangible common equity to tangible assets ratio was 5.4%, up from the prior-year quarter’s 4.8%.
Outlook
Second Quarter 2024
Management expects NII to be relatively stable compared with $4.05 billion in the second quarter of 2024.
Full Year 2024
Management expects NII to be in the range of $16.1 - $16.4 billion.
Total adjusted non-interest income is projected to grow by mid-single digit compared with $10.8 billion in 2023.
Total adjusted non-interest expense is expected to be $16.8 billion or lower.
How Have Estimates Been Moving Since Then?
In the past month, investors have witnessed an upward trend in estimates review.
VGM Scores
Currently, U.S. Bancorp has a poor Growth Score of F, however its Momentum Score is doing a lot better with a B. Following the exact same course, the stock was allocated a grade of B on the value side, putting it in the top 40% for this investment strategy.
Overall, the stock has an aggregate VGM Score of C. If you aren't focused on one strategy, this score is the one you should be interested in.
Outlook
Estimates have been broadly trending upward for the stock, and the magnitude of these revisions looks promising. Notably, U.S. Bancorp has a Zacks Rank #3 (Hold). We expect an in-line return from the stock in the next few months.
Performance of an Industry Player
U.S. Bancorp is part of the Zacks Banks - Major Regional industry. Over the past month, JPMorgan Chase & Co. , a stock from the same industry, has gained 0.8%. The company reported its results for the quarter ended June 2024 more than a month ago.
JPMorgan Chase & Co. reported revenues of $50.2 billion in the last reported quarter, representing a year-over-year change of +21.5%. EPS of $4.40 for the same period compares with $4.37 a year ago.
JPMorgan Chase & Co. is expected to post earnings of $4.06 per share for the current quarter, representing a year-over-year change of -6.2%. Over the last 30 days, the Zacks Consensus Estimate has changed +0.4%.
The overall direction and magnitude of estimate revisions translate into a Zacks Rank #2 (Buy) for JPMorgan Chase & Co. Also, the stock has a VGM Score of F.
Zacks Investment Research
LOS ANGELES, CA / ACCESSWIRE / August 16, 2024 / The Schall Law Firm, a national shareholder rights litigation firm, announces that it is investigating claims on behalf of investors of Salesforce, Inc. ("Salesforce" or "the Company") (NASDAQ:CRM) for violations of the securities laws.
The investigation focuses on whether the Company issued false and/or misleading statements and/or failed to disclose information pertinent to investors. Salesforce reported its first quarter 2025 financial results on May 29, 2024. The Company's revenue came in below the midpoint of its guidance range and its performance obligation growth rate came in below its outlook. The Company also issued second quarter guidance below consensus estimates.
If you are a shareholder who suffered a loss, click here to participate.
We also encourage you to contact Brian Schall of the Schall Law Firm, 2049 Century Park East, Suite 2460, Los Angeles, CA 90067, at 310-301-3335, to discuss your rights free of charge. You can also reach us through the firm's website at www.schallfirm.com, or by email at bschall@schallfirm.com.
The Schall Law Firm represents investors around the world and specializes in securities class action lawsuits and shareholder rights litigation.
This press release may be considered Attorney Advertising in some jurisdictions under the applicable law and rules of ethics.
CONTACT: The Schall Law Firm Brian Schall, Esq.www.schallfirm.com Office: 310-301-3335info@schallfirm.com
SOURCE: The Schall Law Firm
JPMorgan Chase & Co. (JPM) is currently at $212.73, up $1.18 or 0.56%
--
All data as of 10:10:17 AM ET
Source: Dow Jones Market Data, FactSet
728 RM B 7/F GEE LOK IND BLDG NO 34 HUNG TO RD KWUN TONG KLN HONG KONG


White Label
Data API
Web Plug-ins
Poster Maker
Affiliate Program
The risk of loss in trading financial instruments such as stocks, FX, commodities, futures, bonds, ETFs and crypto can be substantial. You may sustain a total loss of the funds that you deposit with your broker. Therefore, you should carefully consider whether such trading is suitable for you in light of your circumstances and financial resources.
No decision to invest should be made without thoroughly conducting due diligence by yourself or consulting with your financial advisors. Our web content might not suit you since we don't know your financial conditions and investment needs. Our financial information might have latency or contain inaccuracy, so you should be fully responsible for any of your trading and investment decisions. The company will not be responsible for your capital loss.
Without getting permission from the website, you are not allowed to copy the website's graphics, texts, or trademarks. Intellectual property rights in the content or data incorporated into this website belong to its providers and exchange merchants.
Not Logged In
Log in to access more features

FastBull Membership
Not yet
Purchase


Log In
Sign Up