Markets
News
Analysis
User
24/7
Economic Calendar
Education
Data
- Names
- Latest
- Prev


Signal Accounts for Members
All Signal Accounts
All Contests


U.K. Trade Balance Non-EU (SA) (Oct)A:--
F: --
P: --
U.K. Trade Balance (Oct)A:--
F: --
P: --
U.K. Services Index MoMA:--
F: --
P: --
U.K. Construction Output MoM (SA) (Oct)A:--
F: --
P: --
U.K. Industrial Output YoY (Oct)A:--
F: --
P: --
U.K. Trade Balance (SA) (Oct)A:--
F: --
P: --
U.K. Trade Balance EU (SA) (Oct)A:--
F: --
P: --
U.K. Manufacturing Output YoY (Oct)A:--
F: --
P: --
U.K. GDP MoM (Oct)A:--
F: --
P: --
U.K. GDP YoY (SA) (Oct)A:--
F: --
P: --
U.K. Industrial Output MoM (Oct)A:--
F: --
P: --
U.K. Construction Output YoY (Oct)A:--
F: --
P: --
France HICP Final MoM (Nov)A:--
F: --
P: --
China, Mainland Outstanding Loans Growth YoY (Nov)A:--
F: --
P: --
China, Mainland M2 Money Supply YoY (Nov)A:--
F: --
P: --
China, Mainland M0 Money Supply YoY (Nov)A:--
F: --
P: --
China, Mainland M1 Money Supply YoY (Nov)A:--
F: --
P: --
India CPI YoY (Nov)A:--
F: --
P: --
India Deposit Gowth YoYA:--
F: --
P: --
Brazil Services Growth YoY (Oct)A:--
F: --
P: --
Mexico Industrial Output YoY (Oct)A:--
F: --
P: --
Russia Trade Balance (Oct)A:--
F: --
P: --
Philadelphia Fed President Henry Paulson delivers a speech
Canada Building Permits MoM (SA) (Oct)A:--
F: --
P: --
Canada Wholesale Sales YoY (Oct)A:--
F: --
P: --
Canada Wholesale Inventory MoM (Oct)A:--
F: --
P: --
Canada Wholesale Inventory YoY (Oct)A:--
F: --
P: --
Canada Wholesale Sales MoM (SA) (Oct)A:--
F: --
P: --
Germany Current Account (Not SA) (Oct)A:--
F: --
P: --
U.S. Weekly Total Rig CountA:--
F: --
P: --
U.S. Weekly Total Oil Rig CountA:--
F: --
P: --
Japan Tankan Large Non-Manufacturing Diffusion Index (Q4)--
F: --
P: --
Japan Tankan Small Manufacturing Outlook Index (Q4)--
F: --
P: --
Japan Tankan Large Non-Manufacturing Outlook Index (Q4)--
F: --
P: --
Japan Tankan Large Manufacturing Outlook Index (Q4)--
F: --
P: --
Japan Tankan Small Manufacturing Diffusion Index (Q4)--
F: --
P: --
Japan Tankan Large Manufacturing Diffusion Index (Q4)--
F: --
P: --
Japan Tankan Large-Enterprise Capital Expenditure YoY (Q4)--
F: --
P: --
U.K. Rightmove House Price Index YoY (Dec)--
F: --
P: --
China, Mainland Industrial Output YoY (YTD) (Nov)--
F: --
P: --
China, Mainland Urban Area Unemployment Rate (Nov)--
F: --
P: --
Saudi Arabia CPI YoY (Nov)--
F: --
P: --
Euro Zone Industrial Output YoY (Oct)--
F: --
P: --
Euro Zone Industrial Output MoM (Oct)--
F: --
P: --
Canada Existing Home Sales MoM (Nov)--
F: --
P: --
Euro Zone Total Reserve Assets (Nov)--
F: --
P: --
U.K. Inflation Rate Expectations--
F: --
P: --
Canada National Economic Confidence Index--
F: --
P: --
Canada New Housing Starts (Nov)--
F: --
P: --
U.S. NY Fed Manufacturing Employment Index (Dec)--
F: --
P: --
U.S. NY Fed Manufacturing Index (Dec)--
F: --
P: --
Canada Core CPI YoY (Nov)--
F: --
P: --
Canada Manufacturing Unfilled Orders MoM (Oct)--
F: --
P: --
Canada Manufacturing New Orders MoM (Oct)--
F: --
P: --
Canada Core CPI MoM (Nov)--
F: --
P: --
Canada Manufacturing Inventory MoM (Oct)--
F: --
P: --
Canada CPI YoY (Nov)--
F: --
P: --
Canada CPI MoM (Nov)--
F: --
P: --
Canada CPI YoY (SA) (Nov)--
F: --
P: --
Canada Core CPI MoM (SA) (Nov)--
F: --
P: --


No matching data
Latest Views
Latest Views
Trending Topics
Top Columnists
Latest Update
White Label
Data API
Web Plug-ins
Affiliate Program
View All

No data
Solana is trading at critical levels after a volatile week that saw major surges across the crypto market. While the rally has sparked optimism, analysts remain sharply divided. Some believe this is just a healthy correction within a broader bull cycle, while others warn that the crypto market may have already entered a new bear phase.
For Solana, the next few weeks are expected to be decisive. Top analyst Inmortal shared insights on X, highlighting that within the next 30 days, the market will likely reveal whether Solana’s latest recovery attempt is a simple bear market bounce or the beginning of a bull market dip and new expansion.
As Solana holds above key technical levels, price action will be critical to determine sentiment. The stakes are high, especially as macroeconomic uncertainty, driven by global trade tensions and monetary policy shifts, continues to cloud the broader financial landscape.
Investors should stay cautious, but alert. Solana’s next move could set the tone not just for its own trajectory, but for the altcoin sector as a whole heading into the summer months. The clock is ticking on this crucial phase.
Solana Approaches Critical Level Amid Sharp Recovery
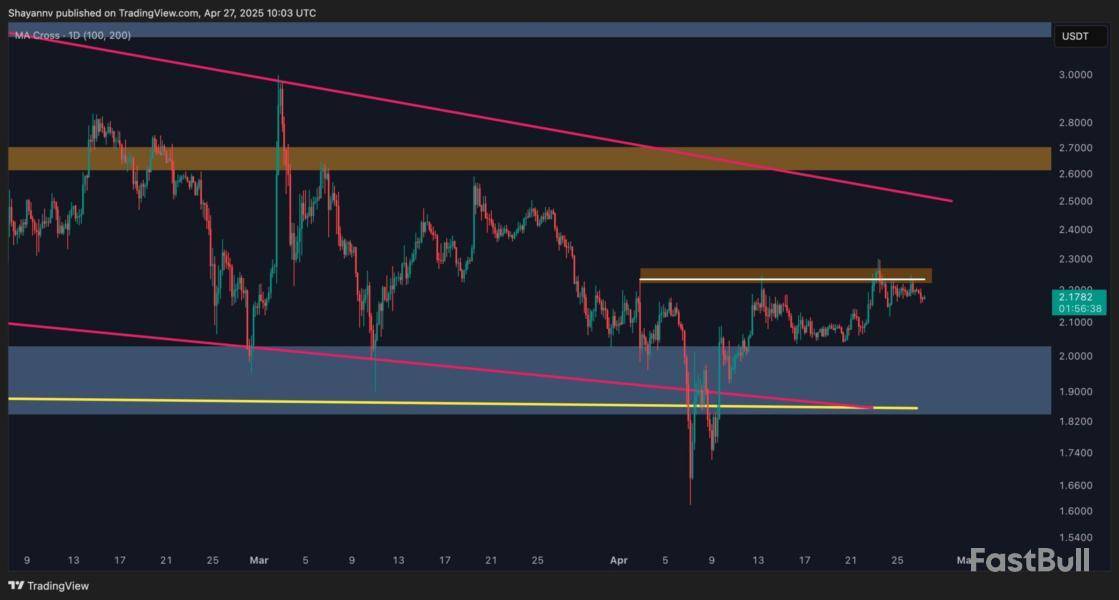
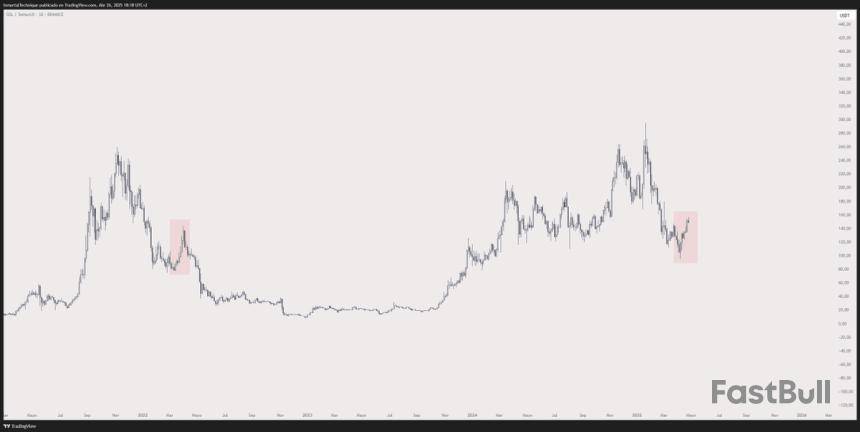
Solana has rebounded sharply from its April 7 local low around $95, gaining an impressive 54% in just a few weeks. Bulls have regained momentum as Solana trades near critical resistance levels, with analysts calling for a potential push above $160 in the short term. However, despite this strong recovery, risks of a downside reversal remain high.
Since January, Solana has been one of the hardest-hit major cryptocurrencies. It lost over 65% of its value during the most recent downtrend, highlighting the intense selling pressure and increased speculation across the broader market. While the recent rally is encouraging, many are questioning whether it marks the start of a new bullish phase or just a temporary rebound within a larger bearish trend.
Inmortal’s insights emphasize that May will be a decisive month for Solana. According to him, “you can’t imagine how vital May is.” Over the next 30 days, the market is expected to reveal whether Solana’s recent strength represents a simple bear-market bounce or the beginning of a true bull-market dip that could lead to further gains.
The coming weeks will be critical, and Solana’s price action will likely set the tone for the entire altcoin market this summer.
Price Action Details: Key Levels To Watch
Solana (SOL) is trading at $146 after losing around 6% of its value since Friday. Despite the strong rally earlier this month, bulls are now facing increasing pressure to defend current levels. SOL must reclaim the $180 level, which aligns closely with the 200-day moving average (MA), to resume the bullish trend and regain market confidence.
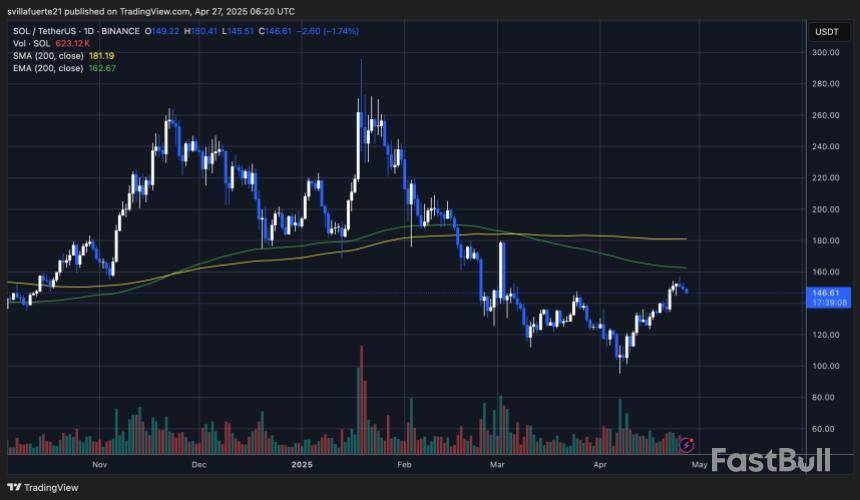
The $180 mark is critical because a decisive move above it would signal strength and open the door for a push toward higher resistance zones. Without this breakout, however, the current rally risks fading into another lower high, further weakening Solana’s structure.
On the downside, losing the $140 level would be a major red flag for bulls. A sustained breakdown below this support could trigger a deeper correction, with price potentially dropping below the psychological $100 mark. Such a move would likely accelerate bearish sentiment and invite further selling pressure, especially as macroeconomic risks and global uncertainty continue to weigh on the crypto market.
The next few days will be key for SOL. Bulls must act quickly to defend, support, and attempt a recovery, or risk opening the door to another major leg down.
Featured image from Dall-E, chart from TradingView
Ripple remains trapped within a tight range between its 100-day and 200-day moving averages, signaling an imminent breakout. The direction of this breakout will be crucial in determining the cryptocurrency’s next major trend.XRP Analysis
By ShayanThe Daily Chart
Following a rebound from the crucial 200-day moving average at $1.7, Ripple (XRP) has entered a low-volatility consolidation phase, trading within a very tight range. This range is defined by the dynamic 100-day and 200-day moving averages, currently positioned at $2.4 and $1.9, respectively, reflecting market indecision.
Notably, the 100-day MA at $2.4 aligns with the upper boundary of a prolonged descending wedge pattern. A confirmed breakout above this level could mark a significant bullish shift, potentially initiating a fresh upward leg toward higher resistance zones.
On the lower timeframe, XRP has recently invalidated a breakout attempt above its prior swing high at $2.2, forming what appears to be a bull trap. This has led to continued sideways price action, signaling an ongoing equilibrium between buyers and sellers.
A decisive breakout above the $2.2 line would establish a new higher high and likely confirm a bullish market structure shift. This would set the stage for a rally toward the $2.5 resistance, which corresponds with the upper boundary of the descending wedge.
Conversely, if Ripple fails to overcome this key boundary, a retracement toward the critical $1.7 support zone becomes increasingly probable.
Bitcoin has signaled notable bullish strength by breaking above both the 100 and 200-day moving averages at $90K. However, as the price approaches the critical $100K psychological threshold, a temporary consolidation phase is expected before any further breakout.Technical Analysis
By ShayanThe Daily Chart
Bitcoin has recently notched a strong bullish signal, staging a major market shift driven by substantial buying pressure. This rally has propelled the price above a critical resistance zone, reclaiming both the 100 and 200-day moving averages at $90K — a key indication of buyers’ dominance.
Currently, BTC is approaching the psychological $100K threshold, a major resistance likely filled with significant supply. As a result, a temporary consolidation around this level is expected before any potential breakout occurs. A decisive move above $100K would likely pave the way toward retesting the all-time high (ATH).
On the lower timeframe, Bitcoin confirmed its bullish momentum after breaking above the descending channel’s upper boundary at $84K. This breakout triggered an impulsive surge, pushing the price past the critical $90K resistance level, highlighting strong buyer commitment.
Now, the asset is nearing the crucial $100K psychological resistance, which also aligns with a major previous swing high. If buyers succeed in breaching this barrier, the road to Bitcoin’s ATH could reopen. Conversely, failure to break above may lead to a short-term consolidation below $100K before the next significant move.
By Shayan
After Bitcoin completed its corrections and initiated recoveries in October 2023 and September 2024, Binance Futures funding rates notably turned deeply negative during the early stages of each rally. This recurring pattern highlights a persistent lack of investor confidence during sharp declines or prolonged consolidations.
In contrast, during strong Bitcoin rallies, FOMO-driven traders aggressively deployed leverage to open long positions, causing funding rates to spike sharply. This often signaled overheated conditions and triggered subsequent corrective pullbacks.
Currently, Bitcoin has surged more than 28% off its recent low. Following this rally, the funding rates have, with a delay, experienced a significant upward shift, signaling a renewed influx of leveraged long positioning.
Considering the historical behavior during the previous two major recoveries, current sentiment dynamics, and price structure strongly suggest that Bitcoin is well-positioned to break through its previous all-time highs in the near term.
Crypto exchange Bitget said it will legally pursue eight accounts suspected of manipulating the platform's VOXEL market, profiting $20 million as a result, as the platform continues to investigate the "abnormal trading activity" from last Sunday.
On April 20, Bitget's market for a little-known token called VOXEL, the native token of Polygon-based RPG game Voxie Tactics, suddenly surged with volume as the token's price increased by more than 500% of its value two days prior. Bitget quickly announced it would be rolling back trades made in the market during a certain time frame while investigating the "abnormal trading" activity.
While Bitget has yet to release a comprehensive post-mortem covering the incident, Bitget's Head of Asia Xie Jiayin said on X that the exchange will issue lawyer's letters to the owners of eight accounts suspected of acting as a "professional arbitrage" group to manipulate the market and profit over $20 million as a result. Typically, lawyer's letters are a prelude to more formal legal action.
"All funds that are recovered will be returned to platform users 100 percent, via an airdrop," a translation of Xie's post states. "We will release a full incident report on the VOXEL matter as soon as possible to present the complete facts."
The $20 million exploit joins a growing number of hacks and exploits in recent weeks, including the $5.8 million exploit that hit Solana DeFi platform Loopscale two weeks after launch and a $49 million loss from stablecoin neoback Infini.
Disclaimer: The Block is an independent media outlet that delivers news, research, and data. As of November 2023, Foresight Ventures is a majority investor of The Block. Foresight Ventures invests in other companies in the crypto space. Crypto exchange Bitget is an anchor LP for Foresight Ventures. The Block continues to operate independently to deliver objective, impactful, and timely information about the crypto industry. Here are our current financial disclosures.
© 2025 The Block. All Rights Reserved. This article is provided for informational purposes only. It is not offered or intended to be used as legal, tax, investment, financial, or other advice.
Bitcoin has entered an important zone in recent days, with the $94,500 price area standing out as an increasingly important battleground for its short-term trajectory. Although the leading cryptocurrency has made several attempts to clear this region during its latest rally, it has faced repeated rejections, highlighting the presence of strong resistance.
Despite these setbacks, on-chain data indicates significant whale accumulation noted on crypto exchanges, hinting that the bullish undercurrent is still strong as Bitcoin looks to end April 2025 on a postive close.
Heavy Resistance Cluster Between $94,125 And $99,150
According to crypto analyst Ali Martinez, who shared insights from on-chain analytics platform IntoTheBlock, Bitcoin is encountering heavy resistance between the $94,125 and $99,150 price range.
Notably, his post on social media platform X shows that approximately 2.61 million wallet addresses have accumulated about 1.76 million BTC within this zone, making it one of the densest supply barriers Bitcoin has faced in its current market cycle.
As shown in the chart below, about 1.26 million addresses hold close to 843,000 BTC between $94,125 and $96,582, while another 1.35 million addresses are clustered between $96,582 and $99,146, holding roughly 917,000 BTC. This concentration of holders creates a formidable wall that Bitcoin must breach decisively if it is to continue its upward march into the next month.
A strong and decisive daily or weekly close above $96,600 could invalidate the overhead resistance here, placing the next target zone at $99,150. Ultimately, the buying momentum here would clear the path for the Bitcoin price to finally target $100,000 and beyond again.
Conversely, repeated failures at this zone could cause a retest of lower support levels around $93,000 and $84,000, which also have significant volumes of 678,000 BTC and 759,150 BTC, respectively.
Image From X: ali_charts
Bitcoin’s Bullish Structure Still Intact
Even as the $94,000 to $99,000 resistance zone poses a near-term challenge, technical patterns suggest that Bitcoin’s rally is just beginning. Another prominent crypto analyst, known as Titan of Crypto, reaffirmed that Bitcoin’s long-term price target of around $125,000 is still valid.
This target is derived from a massive Inverse Head and Shoulders (H&S) pattern identified on the Bitcoin monthly candlestick chart.
Image From X: Titan of Crypto
The chart shows a clear breakout above the neckline of the Inverse H&S formation earlier this year when Bitcoin pushed to its current all-time high around $108,790. Since then, the price action has been followed by a retest that is holding firm above a support trendline on the monthly timeframe.
According to the analyst, this technical structure shows that Bitcoin is well-positioned to rebound and reach a new all-time high of $125,000 very soon. Of course, this timeline will also depend on whether the current support zone around $85,000 to $87,000 holds steady.
At the time of writing, Bitcoin is trading at $94,147
Featured image from Unsplash, chart from TradingView
What is crypto price manipulation?
When a coin moons out of nowhere and then crashes just as fast — it is rarely pure market magic.
Cryptocurrency price manipulation is the dark art of bending the market to your will. It is when insiders or coordinated groups inflate or crash a coin’s price, not through real demand, but through smoke and mirrors. They might fake volume, spread hype, trigger fear, or pull sudden sell-offs — all to trap unsuspecting traders and walk away with the profits.
In traditional finance, this kind of behavior gets you fined or jailed. But what about in the world of crypto? It often flies under the radar. With light regulations and heavy emotions in play, the digital asset market has become a playground for manipulators, especially where liquidity is low and oversight is weaker.
Here’s the classic playbook:
The most common crypto market manipulation tactics
Scammers don’t need magic — they just need market psychology and a few tricks.
As the digital asset landscape expands, criminals have honed various crypto price manipulation tactics. Each tactic capitalizes on the market’s volatility and traders’ fear of missing out (FOMO). Let’s break down the most used:
Behind the scenes: Advanced crypto price manipulation tactics
Not all crypto price manipulation is obvious. Some of it is deeply technical — or done in silence.
Beyond basic scams, cybercriminals use more complex tactics to manipulate and sway the market.
Why manipulation works: Psychology over logic
In crypto, emotion moves faster than reason — and scammers know it.
Even experienced traders fall for manipulation because it plays on powerful instincts. Because the market moves fast, decisions are often made in the heat of the moment — on gut feeling, not deep analysis. And manipulators are experts at pressing the right emotional buttons.
Greed is the oldest trick in the book. Everyone wants to catch the next 100x gem, and scammers know how to dress up trash as treasure. A few flashy tweets, a celebrity shoutout and, suddenly, a random coin looks like the ticket to financial freedom.
Fear is just as powerful. One big red candle can trigger a chain reaction of panic selling. Manipulators use this to buy back cheap, while everyone else scrambles to exit.
FOMO is the final piece. When traders see others making big gains, logic goes out the window. Instead of researching, they ape in, hoping not to be left behind.
These emotions are hardwired. They’re faster than logic, and in crypto, speed is everything. Manipulators don’t need to hack wallets or break code — they just hack human behavior. Stir up just the right storm of excitement or dread, and the market plays right into their hands.
Did you know? The infamous Squid Game Token soared tens of thousands of percent before crashing to zero. It was a textbook rug pull — but the hype was too loud for many to resist.
What crypto price manipulation does to the market
One scam doesn’t just hurt victims — it damages the entire ecosystem.
Crypto price manipulation doesn’t happen in a vacuum. Every fake pump, every engineered crash, every orchestrated scam chips away at the foundation of the entire crypto ecosystem: trust.
When retail traders — especially newcomers — get caught in a pump-and-dump or a whale-induced panic, the damage runs deeper than a single bad trade. Many walk away for good, disillusioned and angry, taking their money and optimism with them. The promise of open, decentralized finance starts to look like just another casino — rigged and unforgiving.
And it doesn’t stop there. High-profile cryptocurrency frauds and price manipulation scandals light up the radar of regulators worldwide. Each incident becomes a case study in why crypto “needs to be tamed.” That means stricter rules, more compliance hoops and an overall slowdown in innovation. The free-spirited, experimental energy that drives crypto forward starts to feel boxed in.
Meanwhile, legit projects — those building real utility, transparency and long-term value — struggle to rise above the noise. Scam tokens dominate the charts. Shady influencers flood timelines. The signal gets buried under waves of hype and deception.
In the end, crypto price manipulation doesn’t just hurt individual investors. It poisons the well for everyone — developers, communities and the future of the space itself.
Did you know? The memecoin craze has pulled in not just investors — but celebrities, too. From hyped tokens to sudden rug pulls, in 2024, several celeb-backed crypto projects have gone off the rails, blurring the line between fame and fraud.
How to protect yourself from crypto manipulation
You can’t control the market — but you can avoid its traps.
Here are practical steps to avoid falling for crypto scams and manipulation:
The push for safer crypto markets
The good news? The crypto world is fighting back.
The crypto universe might still feel like the digital frontier, but it is no longer a lawless land. Across the ecosystem, the good guys — builders, platforms and policymakers — are stepping in to make the space more transparent, resilient and secure for users.
Crypto exchanges are starting to unleash AI-powered surveillance tools designed to spot shady behavior in real time. Wash trading? Spoofing? Pump-and-dump groups? These algorithms are already trained to catch the tricks before they catch you.
On the DeFi side, protocols are stepping up with on-chain governance and transparency upgrades. Communities can now vote on key actions, track wallet movements, and call out suspicious patterns — all out in the open.
And regulators? They are finally moving from the sidelines to the rulebook. New legislation is targeting insider trading, fake promotions and market abuse, bringing long-overdue accountability to crypto’s fast lanes.
Is the system foolproof yet? Far from it. But every smart contract, policy update and AI model pushing back against manipulation is a win for the space.
So, if crypto scams thrive in the dark, knowledge is your flashlight. If a token’s mooning with no clear reason, pause. If something does not feel right, it probably is not. Trust your gut, not the hype. Because in the end, staying informed is your best defense — and your smartest investment.
United States President Donald Trump recently said that federal income taxes would be "substantially reduced" or potentially eliminated once the tariff regime fully sets in.
In an April 27 Truth Social post, Trump added that the focus of the purported tax cuts would be on individuals making less than $200,000 per year.
The US President also said that the "External Revenue Service" — a reference to funding the federal government exclusively through import tariffs instead of the current model of collecting taxes through the Internal Revenue Service (IRS) — is materializing.
Eliminating the federal income tax would likely be a positive catalyst for asset prices, including cryptocurrencies, as the increase in disposable income should partially flow back into productive investments. However, this stimulative effect is not guaranteed.
Trump’s plan leaves analysts and markets doubting
Trump previously floated the idea of eliminating the federal income tax in an October 2024 appearance on the Joe Rogan Experience, although Trump, who was on the campaign trail at the time, provided scant concrete details on the proposal.
The US President suggested that replacing the federal income tax with revenue from import duties would return the US to a time of prosperity seen during the Gilded Age, in the 19th century, when the US did not have a permanent federal income tax.
Research conducted by accounting automation company Dancing Numbers found that Trump's proposal could save the average American $134,809 in lifetime tax payments.
Dancing Numbers added that the tax savings could be as much as $325,561 per American if other wage-based income taxes are also eliminated.
On April 2, Trump signed an executive order imposing sweeping tariffs on all US trading partners, which included a 10% baseline tariff on all countries and different "reciprocal" tariff rates on countries with import duties on US goods.
However, since that time, the Trump administration walked back its tariff policies several times, flip-flopping on tariff rates and when the tariff regime would fully take effect.
The Trump administration's ever-changing rhetoric surrounding trade policies has heightened volatility in the US stock market, caused a rise in US bond yields, and has drawn widespread criticism from financial analysts who say the protectionist trade policies hurt capital markets while achieving little else.
White Label
Data API
Web Plug-ins
Poster Maker
Affiliate Program
The risk of loss in trading financial instruments such as stocks, FX, commodities, futures, bonds, ETFs and crypto can be substantial. You may sustain a total loss of the funds that you deposit with your broker. Therefore, you should carefully consider whether such trading is suitable for you in light of your circumstances and financial resources.
No decision to invest should be made without thoroughly conducting due diligence by yourself or consulting with your financial advisors. Our web content might not suit you since we don't know your financial conditions and investment needs. Our financial information might have latency or contain inaccuracy, so you should be fully responsible for any of your trading and investment decisions. The company will not be responsible for your capital loss.
Without getting permission from the website, you are not allowed to copy the website's graphics, texts, or trademarks. Intellectual property rights in the content or data incorporated into this website belong to its providers and exchange merchants.
Not Logged In
Log in to access more features

FastBull Membership
Not yet
Purchase
Log In
Sign Up