• Trade
  • Markets
  • Copy
  • Contests
  • News
  • 24/7
  • Calendar
  • Q&A
  • Chats
Trending
Screeners
SYMBOL
LAST
BID
ASK
HIGH
LOW
NET CHG.
%CHG.
SPREAD
SPX
S&P 500 Index
6827.42
6827.42
6827.42
6899.86
6801.80
-73.58
-1.07%
--
DJI
Dow Jones Industrial Average
48458.04
48458.04
48458.04
48886.86
48334.10
-245.98
-0.51%
--
IXIC
NASDAQ Composite Index
23195.16
23195.16
23195.16
23554.89
23094.51
-398.69
-1.69%
--
USDX
US Dollar Index
97.950
98.030
97.950
98.500
97.950
-0.370
-0.38%
--
EURUSD
Euro / US Dollar
1.17394
1.17409
1.17394
1.17496
1.17192
+0.00011
+ 0.01%
--
GBPUSD
Pound Sterling / US Dollar
1.33707
1.33732
1.33707
1.33997
1.33419
-0.00148
-0.11%
--
XAUUSD
Gold / US Dollar
4299.39
4299.39
4299.39
4353.41
4257.10
+20.10
+ 0.47%
--
WTI
Light Sweet Crude Oil
57.233
57.485
57.233
58.011
56.969
-0.408
-0.71%
--

Community Accounts

Signal Accounts
--
Profit Accounts
--
Loss Accounts
--
View More

Become a signal provider

Sell trading signals to earn additional income

View More

Guide to Copy Trading

Get started with ease and confidence

View More

Signal Accounts for Members

All Signal Accounts

Best Return
  • Best Return
  • Best P/L
  • Best MDD
Past 1W
  • Past 1W
  • Past 1M
  • Past 1Y

All Contests

  • All
  • Trump Updates
  • Recommend
  • Stocks
  • Cryptocurrencies
  • Central Banks
  • Featured News
Top News Only
Share

The United States And Mexico Have Reached An Agreement On How To Resolve The Water Dispute In The Rio Grande Basin (which Borders Texas). Starting December 15, Mexico Will Supply The U.S. With An Additional 20.2 Acre-feet (a Unit Of Volume For Irrigation). The Agreement Seeks To “strengthen Water Management In The Rio Grande Basin” Within The Framework Of The 1944 Water Treaty

Share

U.S. Transportation Secretary Duffy: The Engine Of United Airlines Flight 803 That Malfunctioned Caught Fire

Share

Ukraine President Zelenskiy: He Will Meet US, European Representatives About Peace

Share

UK Prime Minister Office: Prime Minister Starmer Spoke To The President Of The European Commission Ursula Von Der Leyen This Evening - Downing Street Spokesperson

Share

Trump: We Will Retaliate Against ISIS

Share

Trump Says We Mourn The Loss Of Three Great Patriots In Syria In An Ambush

Share

Syrian Interior Ministry Spokesperson Confirms Attacker Was Member Of Security Forces With Extremist Ideology

Share

Syrian Interior Ministry Says Attacker Did Not Have Leadership Role In Security Forces, Did Not Say If He Was Junior Member

Share

Man Who Attacked Syrian, US Military Was Member Of Syrian Security Forces -Three Local Syrian Officials

Share

US Envoy Coale Says Belarus President Lukashenko Agreed To Do All He Can To Stop Weather Balloons Flying Into Lithuania

Share

Ukraine Says Russian Drone Attack Hit Civilian Turkish Vessel

Share

Islamic State Attacker In Syria Was Lone Gunman, Who Was Killed -USA Central Command

Share

US Envoy John Coale Says Around 1000 Remaining Political Prisoners In Belarus Could Be Released In Coming Months

Share

US Defense Secretary Hegseth: Attacker Was Killed By Partner Forces

Share

Pentagon Says Two USA Army Soldiers And One Civilian USA Interpreter Were Killed, And Three Were Wounded In Syria

Share

Israel Says It Kills Senior Hamas Commander Raed Saed In Gaza

Share

Ukraine's Navy Says Russian Drone Attack Hit Civilian Turkish Vessel Carrying Sunflower Oil To Egypt On Saturday

Share

Israeli Military Says It Put Planned Strike On South Lebanon Site On Hold After Lebanese Army Requested Access

Share

Norwegian Nobel Committee: Calls On The Belarusian Authorities To Release All Political Prisoners

Share

Norwegian Nobel Committee: His Freedom Is A Deeply Welcome And Long-Awaited Moment

TIME
ACT
FCST
PREV
U.K. Trade Balance (Oct)

A:--

F: --

P: --

U.K. Services Index MoM

A:--

F: --

P: --

U.K. Construction Output MoM (SA) (Oct)

A:--

F: --

P: --

U.K. Industrial Output YoY (Oct)

A:--

F: --

P: --

U.K. Trade Balance (SA) (Oct)

A:--

F: --

P: --

U.K. Trade Balance EU (SA) (Oct)

A:--

F: --

P: --

U.K. Manufacturing Output YoY (Oct)

A:--

F: --

P: --

U.K. GDP MoM (Oct)

A:--

F: --

P: --

U.K. GDP YoY (SA) (Oct)

A:--

F: --

P: --

U.K. Industrial Output MoM (Oct)

A:--

F: --

P: --

U.K. Construction Output YoY (Oct)

A:--

F: --

P: --

France HICP Final MoM (Nov)

A:--

F: --

P: --

China, Mainland Outstanding Loans Growth YoY (Nov)

A:--

F: --

P: --

China, Mainland M2 Money Supply YoY (Nov)

A:--

F: --

P: --

China, Mainland M0 Money Supply YoY (Nov)

A:--

F: --

P: --

China, Mainland M1 Money Supply YoY (Nov)

A:--

F: --

P: --

India CPI YoY (Nov)

A:--

F: --

P: --

India Deposit Gowth YoY

A:--

F: --

P: --

Brazil Services Growth YoY (Oct)

A:--

F: --

P: --

Mexico Industrial Output YoY (Oct)

A:--

F: --

P: --

Russia Trade Balance (Oct)

A:--

F: --

P: --

Philadelphia Fed President Henry Paulson delivers a speech
Canada Building Permits MoM (SA) (Oct)

A:--

F: --

P: --

Canada Wholesale Sales YoY (Oct)

A:--

F: --

P: --

Canada Wholesale Inventory MoM (Oct)

A:--

F: --

P: --

Canada Wholesale Inventory YoY (Oct)

A:--

F: --

P: --

Canada Wholesale Sales MoM (SA) (Oct)

A:--

F: --

P: --

Germany Current Account (Not SA) (Oct)

A:--

F: --

P: --

U.S. Weekly Total Rig Count

A:--

F: --

P: --

U.S. Weekly Total Oil Rig Count

A:--

F: --

P: --

Japan Tankan Large Non-Manufacturing Diffusion Index (Q4)

--

F: --

P: --

Japan Tankan Small Manufacturing Outlook Index (Q4)

--

F: --

P: --

Japan Tankan Large Non-Manufacturing Outlook Index (Q4)

--

F: --

P: --

Japan Tankan Large Manufacturing Outlook Index (Q4)

--

F: --

P: --

Japan Tankan Small Manufacturing Diffusion Index (Q4)

--

F: --

P: --

Japan Tankan Large Manufacturing Diffusion Index (Q4)

--

F: --

P: --

Japan Tankan Large-Enterprise Capital Expenditure YoY (Q4)

--

F: --

P: --

U.K. Rightmove House Price Index YoY (Dec)

--

F: --

P: --

China, Mainland Industrial Output YoY (YTD) (Nov)

--

F: --

P: --

China, Mainland Urban Area Unemployment Rate (Nov)

--

F: --

P: --

Saudi Arabia CPI YoY (Nov)

--

F: --

P: --

Euro Zone Industrial Output YoY (Oct)

--

F: --

P: --

Euro Zone Industrial Output MoM (Oct)

--

F: --

P: --

Canada Existing Home Sales MoM (Nov)

--

F: --

P: --

Euro Zone Total Reserve Assets (Nov)

--

F: --

P: --

U.K. Inflation Rate Expectations

--

F: --

P: --

Canada National Economic Confidence Index

--

F: --

P: --

Canada New Housing Starts (Nov)

--

F: --

P: --

U.S. NY Fed Manufacturing Employment Index (Dec)

--

F: --

P: --

U.S. NY Fed Manufacturing Index (Dec)

--

F: --

P: --

Canada Core CPI YoY (Nov)

--

F: --

P: --

Canada Manufacturing Unfilled Orders MoM (Oct)

--

F: --

P: --

Canada Manufacturing New Orders MoM (Oct)

--

F: --

P: --

Canada Core CPI MoM (Nov)

--

F: --

P: --

Canada Manufacturing Inventory MoM (Oct)

--

F: --

P: --

Canada CPI YoY (Nov)

--

F: --

P: --

Canada CPI MoM (Nov)

--

F: --

P: --

Canada CPI YoY (SA) (Nov)

--

F: --

P: --

Canada Core CPI MoM (SA) (Nov)

--

F: --

P: --

Canada CPI MoM (SA) (Nov)

--

F: --

P: --

Q&A with Experts
    • All
    • Chatrooms
    • Groups
    • Friends
    Connecting
    .
    .
    .
    Type here...
    Add Symbol or Code

      No matching data

      All
      Trump Updates
      Recommend
      Stocks
      Cryptocurrencies
      Central Banks
      Featured News
      • All
      • Russia-Ukraine Conflict
      • Middle East Flashpoint
      • All
      • Russia-Ukraine Conflict
      • Middle East Flashpoint
      Search
      Products

      Charts Free Forever

      Chats Q&A with Experts
      Screeners Economic Calendar Data Tools
      Membership Features
      Data Warehouse Market Trends Institutional Data Policy Rates Macro

      Market Trends

      Market Sentiment Order Book Forex Correlations

      Top Indicators

      Charts Free Forever
      Markets

      News

      News Analysis 24/7 Columns Education
      From Institutions From Analysts
      Topics Columnists

      Latest Views

      Latest Views

      Trending Topics

      Top Columnists

      Latest Update

      Signals

      Copy Rankings Latest Signals Become a signal provider AI Rating
      Contests
      Brokers

      Overview Brokers Assessment Rankings Regulators News Claims
      Broker listing Forex Brokers Comparison Tool Live Spread Comparison Scam
      Q&A Complaint Scam Alert Videos Tips to Detect Scam
      More

      Business
      Events
      Careers About Us Advertising Help Center

      White Label

      Data API

      Web Plug-ins

      Affiliate Program

      Awards Institution Evaluation IB Seminar Salon Event Exhibition
      Vietnam Thailand Singapore Dubai
      Fans Party Investment Sharing Session
      FastBull Summit BrokersView Expo
      Recent Searches
        Top Searches
          Markets
          News
          Analysis
          User
          24/7
          Economic Calendar
          Education
          Data
          • Names
          • Latest
          • Prev

          View All

          No data

          Scan to Download

          Faster Charts, Chat Faster!

          Download App
          English
          • English
          • Español
          • العربية
          • Bahasa Indonesia
          • Bahasa Melayu
          • Tiếng Việt
          • ภาษาไทย
          • Français
          • Italiano
          • Türkçe
          • Русский язык
          • 简中
          • 繁中
          Open Account
          Search
          Products
          Charts Free Forever
          Markets
          News
          Signals

          Copy Rankings Latest Signals Become a signal provider AI Rating
          Contests
          Brokers

          Overview Brokers Assessment Rankings Regulators News Claims
          Broker listing Forex Brokers Comparison Tool Live Spread Comparison Scam
          Q&A Complaint Scam Alert Videos Tips to Detect Scam
          More

          Business
          Events
          Careers About Us Advertising Help Center

          White Label

          Data API

          Web Plug-ins

          Affiliate Program

          Awards Institution Evaluation IB Seminar Salon Event Exhibition
          Vietnam Thailand Singapore Dubai
          Fans Party Investment Sharing Session
          FastBull Summit BrokersView Expo

          Solana rallies 20% against Ethereum, but is $300 SOL price within reach?

          Cointelegraph
          Prompt / Tether
          -4.73%
          1inch / Tether
          -1.74%
          AAVE / Tether
          -0.58%
          Fusionist / Tether
          -2.12%

          Solana’s SOL has rallied more than 20% against Ether over the last seven days, and a trader is eyeing a potential breakout to $300, which would mark new all-time highs.

          SOL/ETH ratio hits highest weekly close

          The SOL/ETH ratio, which reflects the value of Solana in Ether, rose to 0.080 on April 13, marking the highest weekly close ever, according to data from Cointelegraph Markets Pro and Binance.

          The SOL/ETH trading pair has been forming higher highs on the daily chart since April 4, suggesting an uptrend is underway.

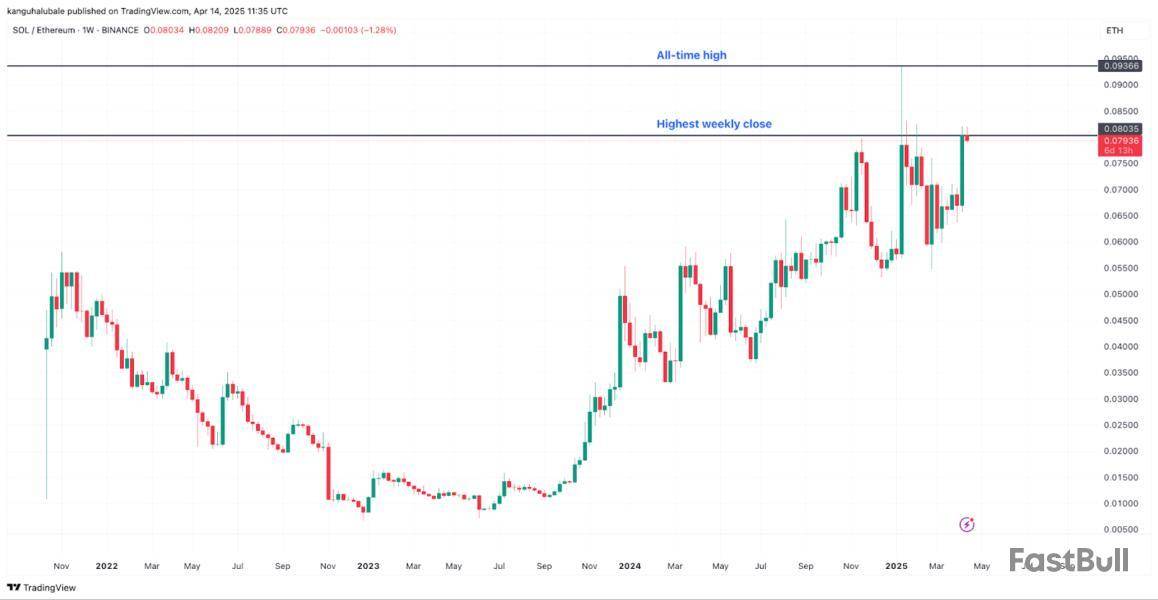
          The SOL/ETH pair gains follow a bullish week for Solana, which has increased by 35% over the last seven days, against a 13% increase in ETH price over the same timeframe.

          “The SOL/ETH chart has just flashed a sign of strength,” said pseudonymous trader Bitcoinsensus in an April 14 post on X, adding:

          “Solana has closed its highest weekly close against Ethereum in history, reflecting that we could see continued outperformance of the Solana Ecosystem.”

          Previously, the SOL/ETH ratio reached as high as 0.093 in January during a rally in crypto prices fueled by US President Donald Trump’s inauguration, which saw the price briefly notch a new all-time high of $295.

          Can Solana price reach $300 in April?

          Popular crypto trader BitBull shared a CME futures chart on X that suggests SOL price could break out toward the $300 mark next.

          The trader cited Ether’s price consolidation around $2,000 on the CME chart before breaking out to all-time highs in 2021.

          “SOL is now showing a similar structure on the CME futures chart” as it trades with the $120 and $130 range, BitBull pointed out, adding that SOL could follow a similar breakout to all-time highs above $300.

          “Just like Ethereum's run in 2021, Solana is setting up for a massive move in 2025.”

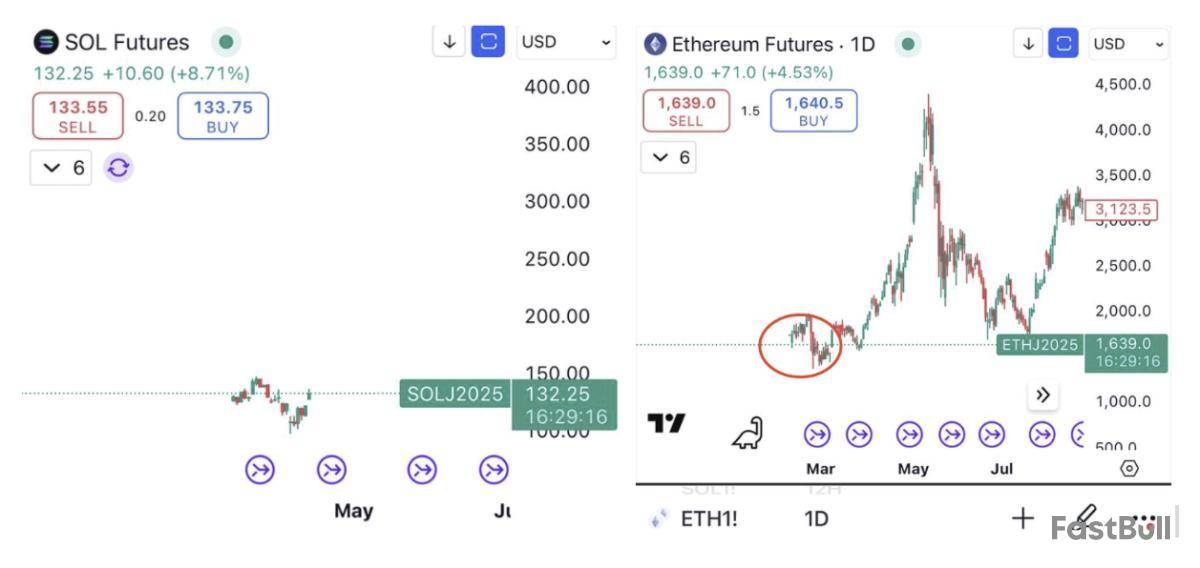
          Chart technicals aside, several onchain metrics suggest that SOL’s path to new all-time highs faces significant hurdles.

          For example, Solana’s network fees dropped more than 97% to $898,235 million on April 14, compared to $35.5 million on Jan. 20.

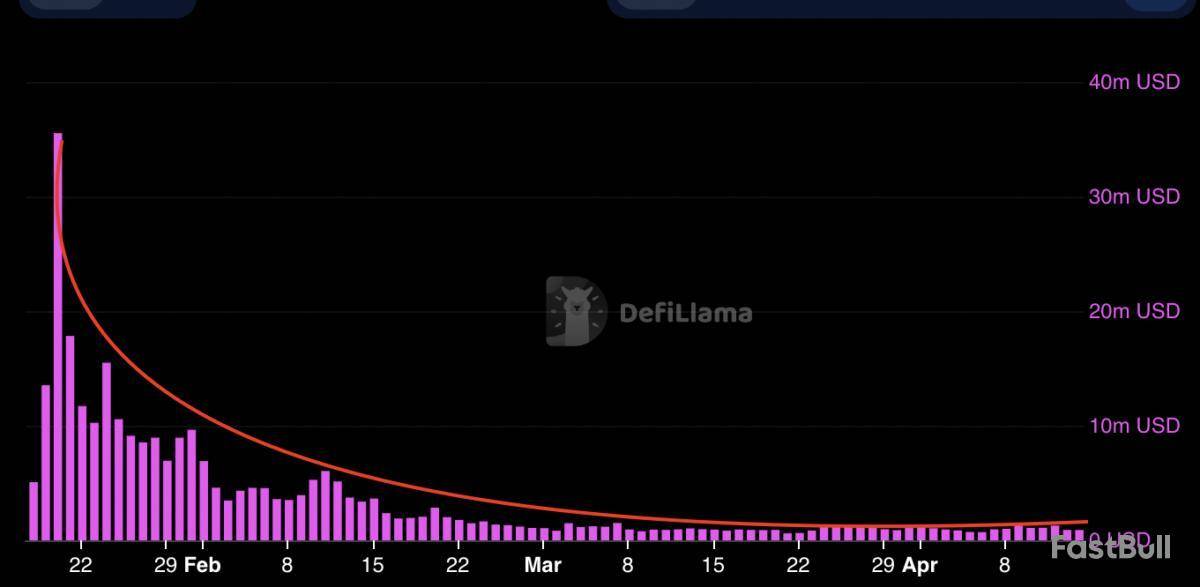
          The decline in Solana fees aligns with reduced trading activity on Raydium, Pump.fun, and Orca. At the same time, fees have stayed unchanged since mid-February on other decentralized applications, such as Jito, Moonshot.money, Meteora and Photon.

          Similarly, the daily DEX volumes on Solana plummeted to $2.17 billion on April 14, 93% below its Jan. 20 peak of $35.9 billion.

          Therefore, SOL’s journey toward new all-time highs will be a tough challenge unless there is a notable rise in network activity.

          SOL’s price is up 3% during the past 24 hours to $133 and 54.5% below its Jan. 19 all-time record.

          This article does not contain investment advice or recommendations. Every investment and trading move involves risk, and readers should conduct their own research when making a decision.

          Risk Warnings and Disclaimers
          You understand and acknowledge that there is a high degree of risk involved in trading. Following any strategies or investment methods may lead to potential losses. The content on the site is provided by our contributors and analysts for information purposes only. You are solely responsible for determining whether any trading assets, securities, strategy, or any other product is suitable for investing based on your own investment objectives and financial situation.
          Add to Favorites
          Share

          Circle’s EURC grows as trade war pushes euro higher — Analyst

          Cointelegraph
          Prompt / Tether
          -4.73%
          1inch / Tether
          -1.74%
          AAVE / Tether
          -0.58%
          Fusionist / Tether
          -2.12%

          The market cap of Circle’s Euro Coin (EURC), a euro-pegged stablecoin, is growing quickly as the ongoing trade war pushes the US dollar price lower.

          “In recent weeks, interest in the euro has grown tremendously” and “this interest has not escaped the Circle EURC stablecoin,” Obchakevich Research founder Alex Obchakevich wrote in a recent X post.

          The euro has risen by 2.2%, reaching its highest price since February 2022 at its current price of $1.13.

          Obchakevich said that amid this happening, decentralized finance (DeFi) protocol Aave saw €2.3 million of Euro Coin inflows in April alone. He further highlighted that EURC’s capitalization is growing at a rapid pace.

          CoinMarketCap data shows EURC’s market cap rose from under $84 million at the end of 2024 to more than $198 million as of mid-April — a 136% increase year to date.

          The euro grows amid an increasingly harsh trade war

          The euro’s recent rally comes as the US dollar weakens on the back of escalating trade tensions. Since Dec. 31, 2024, the dollar has dropped from 0.97 euro to 0.88 euro, a 9.3% decline against the euro.

          The US and European Union “are likely to reach an agreement on a trade deal that will stabilize the euro at $1.11 to the dollar,” Obchakevich said. Still, he expects the Euro Coin to keep growing:

          “EURC will continue to grow through integration with various payment systems and blockchains.“

          The analyst said that after launching on Ethereum, Euro Coin was also deployed on Avalanche, Base, Stellar, Sonic and Solana, leading to a growing supply. He shared his outlook on future market developments:

          “I predict EURC to grow to 400 million euros by the end of this year. This will be further impacted by MiCa regulatory support and economic challenges.“

          MiCA works in Circle’s favor

          Euro Coin and USDC (USDC) issuer Circle is reaping the rewards of its regulatory-friendly strategy. The firm’s products are the top euro and US dollar-pegged stablecoins that comply with the European Union’s Markets in Crypto-Assets (MiCA) regulation.

          The current stablecoin market leader is Tether, with its USDt (USDT) stablecoin currently having a market cap of $144 billion according to CoinMarketCap data. This is significantly higher than leading stablecoin USDC’s $60 billion market cap.

          Still, many expect this gap to shrink as the USDt keeps being pushed from the European Union’s market due to a lack of MiCA compliance. This trend culminated in the world’s leading crypto exchange, Binance, delisting USDt for its European Economic Area-based users to comply with the rules in March.

          Risk Warnings and Disclaimers
          You understand and acknowledge that there is a high degree of risk involved in trading. Following any strategies or investment methods may lead to potential losses. The content on the site is provided by our contributors and analysts for information purposes only. You are solely responsible for determining whether any trading assets, securities, strategy, or any other product is suitable for investing based on your own investment objectives and financial situation.
          Add to Favorites
          Share

          $3,000 for Ethereum (ETH) If This Critical Condition Is Fulfilled (Analyst)

          CryptoPotato
          Prompt / Tether
          -4.73%
          1inch / Tether
          -1.74%
          AAVE / Tether
          -0.58%
          Fusionist / Tether
          -2.12%

          TL;DR

          Is It Finally Showtime?

          Ethereum (ETH) experienced a devastating first quarter of 2025, with its pricecrashingby almost 50%. While some assumed that the worst was over, the beginning of April brought even more pain.

          The global trade war, which escalated this month, took its toll on ETH. The asset brieflydippedto $1,400, the lowest point seen in more than two years.

          Over the last week, though, the second-largest cryptocurrency witnessed some solid resurgence, rising by 13%. Currently, it trades at around $1,670, a 4.5% increase on a daily scale.

          According to some well-known analysts and market observers, the asset has yet to chart substantial gains. The X user Carl Moon told his almost 1.5 million followers that ETH is trying to break out from a descending channel. He thinks the valuation could skyrocket by a whopping 80% to $3,000 “in the coming days,” assuming “there’s enough volume.”

          Sheldon Тhe Sniper, another prominent analyst, also spotted that ETH attempts to move above the upper boundary of a falling wedge pattern, assuming this could be a precursor to a rally.

          For their part, X user Crypto King argued that the asset is currently in a “great accumulation zone.” They reminded that whales have been on a buying spree lately, acquiring millions of dollars worth of ETH.

          “Longer run, ETH at 4500$ should justify,” the analyst concluded.

          Earlier today (April 14), CryptoGoos revealed that a mysterious whale spent almost $7 million to purchase 4,208 ETH. Furthermore, Lookonchain disclosed that another large investor accumulated 15,953 ETH for over $26 million.

          Moves like this are typically seen as bullish, as they reflect strong confidence in the asset from big players. This could encourage other investors to follow suit and inject fresh capital into the ecosystem.Still Not Out of The Woods

          Contrary to the optimism from the aforementioned analysts, some technical indicators suggest that another correction could be on the way.

          ETH’s exchange netflow, for instance, has been positive in the past week, signaling a shift from self-custody toward centralized platforms. This could be interpreted as a bearish factor since it increases the immediate selling pressure.

          ETH’s Relative Strength Index (RSI) is also worth observing. The metric varies from 0 to 100 and helps traders spot potential trend reversals. Readings above 70 suggest the asset has entered overbought territory and could be headed for a pullback. Currently, the RSI stands just south of the bearish zone.

          Risk Warnings and Disclaimers
          You understand and acknowledge that there is a high degree of risk involved in trading. Following any strategies or investment methods may lead to potential losses. The content on the site is provided by our contributors and analysts for information purposes only. You are solely responsible for determining whether any trading assets, securities, strategy, or any other product is suitable for investing based on your own investment objectives and financial situation.
          Add to Favorites
          Share

          Bitcoin Price Forms This Bullish Pennant On Daily Chart That Could Trigger Rise To $137,000

          NewsBTC
          Prompt / Tether
          -4.73%
          1inch / Tether
          -1.74%
          AAVE / Tether
          -0.58%
          Fusionist / Tether
          -2.12%

          Crypto analyst Titan of Crypto has raised the possibility of the Bitcoin price rallying to as high as $137,000. The analyst highlighted a bullish pattern that shows the flagship crypto can reach this ambitious price target. 

          Bitcoin Price Could Rally To $137,000 As Bullish Pennant Forms

          In an X post, Titan of Crypto suggested that the Bitcoin price could reach $137,000 at some point. This came as he revealed that BTC has formed a bullish pennant on the daily chart. The analyst remarked that if this plays out, a new all-time high (ATH) could be reached, regardless of the current market sentiment. 

          His accompanying chart showed that $137,129 was the target for the Bitcoin price as it eyes a rally to new highs. The analyst indicated the key was to see if the flagship crypto could break to the upside in the coming weeks. In the meantime, BTC looks to be facing a lot of resistance and bearish pressure.

          In his Ichimoku cloud analysis of the Bitcoin price action, the analyst stated that BTC is now facing resistance with a fair gap value and entry into the Kumo cloud. He outlined two scenarios that could play out for the flagship crypto. The first is a continuation through the cloud, while the second is a retest of the Kijun and the trendline before continuation. 

          His accompanying chart indicated that the key was to break above the range of around $84,000. A successful breakout from this range could lead to a rally to as high as $92,000. This could eventually pave the way for the Bitcoin price to rally to new highs, especially with the psychological $100,000 level in sight once BTC reclaims $92,000. 

          Key Resistance At $86,000

          In an X post, crypto analyst Ali Martinez revealed that $86,000 is a key resistance zone for the Bitcoin price. He stated that a rejection from this zone could send BTC back to $79,000. However, a breakout might open the path for the flagship crypto to rally to as high as $97,000. 

          Crypto whales are still actively accumulating BTC, which is positive for the Bitcoin price. Martinez revealed that 37,000 BTC have been withdrawn from exchanges in the past 24 hours, which the analyst noted is a strong signal of accumulation.

          Crypto analyst Kevin Capital believes that the Bitcoin price structure is still bearish for now. In an X post, he stated that a break above $89,000 would mean BTC is back in action. Until then, he asserted that there is no real reason to get overly hyped at the current level. 

          At the time of writing, the Bitcoin price is trading at around $84,600, up in the last 24 hours, according to data from CoinMarketCap.

          Risk Warnings and Disclaimers
          You understand and acknowledge that there is a high degree of risk involved in trading. Following any strategies or investment methods may lead to potential losses. The content on the site is provided by our contributors and analysts for information purposes only. You are solely responsible for determining whether any trading assets, securities, strategy, or any other product is suitable for investing based on your own investment objectives and financial situation.
          Add to Favorites
          Share

          Bitcoin, Fed Reserve, Strategy – Vinny Lingham Shares Hot Take

          U.Today
          Prompt / Tether
          -4.73%
          1inch / Tether
          -1.74%
          AAVE / Tether
          -0.58%
          Fusionist / Tether
          -2.12%

          Prominent internet entrepreneur Vinny Lingham has taken to his account on X to share his thoughts on the large Bitcoin purchase that was made just recently by Michael Saylor’s company Strategy but announced only today.

          Vinny Lingham and his X followers seem critical of Michael Saylor’s Strategy since it is slowly but surely becoming one of the largest Bitcoin holders and perhaps pushing BTC to becoming a centralized asset managed by financial elites.

          "Strategy is now the Federal Reserve for Bitcoin"

          The Bitcoin-focused firm has purchased a $285.8 million worth of BTC, which comprises 3,459 Bitcoins. Now, the renowned firm that switched its main business from producing business intelligence software to investing in Bitcoin long-term has increased its bag to more than 530,000 Bitcoins. That is 2.5% of the total Bitcoin supply of 21 million coins.

          As Saylor’s company continues to swell with Bitcoin, boosting its BTC bag, Lingam has likened it to the “Bitcoin Federal Reserve”: “Strategy is now the Federal Reserve for Bitcoin.”

          However, this seems to be a rather critical take on Saylor and his firm's continuous Bitcoin accumulation, highlighting the strengthening centralization of the world’s largest cryptocurrency.

          Vinny Lingham
          @VinnyLingham

          Strategy is now the Federal Reserve for Bitcoin https://t.co/q0HT3HO6gz

          Apr 14, 2025

          The Federal Reserve is considered a negative force in the world of finance, harshly criticized by many financial experts since it controls the U.S. dollar and prints additional money supply whenever it sees fit.

          Many commentators also shared their negative reactions to Strategy's constant Bitcoin purchases, as it concentrates more and more BTC on its balance sheet.

          Top VC investor accuses Saylor of hijacking Bitcoin

          Roughly a month ago, prominent venture investor and entrepreneur Jackson Calacanis stated in a comment to Anothony Pompliano’s tweet that Bitcoin has been “hijacked.” He also said that Michael Saylor and guys like him are likely to “break the Bitcoin game,” indicating that Saylor’s constant accumulation of BTC is likely to make Wall Street companies follow in his footsteps and gain control over large amounts of Bitcoin.

          In the fall of 2024, Saylor briefly mentioned that he believes those who do not trust corporate entities to hold Bitcoin are crazy crypto anarchists. That statement triggered a massive backlash from the community, and eventually Saylor made what looked like an apology — he said that everyone is free to hold Bitcoin the way that suits them best.

          Risk Warnings and Disclaimers
          You understand and acknowledge that there is a high degree of risk involved in trading. Following any strategies or investment methods may lead to potential losses. The content on the site is provided by our contributors and analysts for information purposes only. You are solely responsible for determining whether any trading assets, securities, strategy, or any other product is suitable for investing based on your own investment objectives and financial situation.
          Add to Favorites
          Share

          MicroStrategy Stock Rises. It Expands Bitcoin Holdings With $286 Million Purchase.

          Dow Jones Newswires
          Prompt / Tether
          -4.73%
          1inch / Tether
          -1.74%
          AAVE / Tether
          -0.58%
          Fusionist / Tether
          -2.12%

          By Mackenzie Tatananni

          MicroStrategy stock rose Monday after the world's largest corporate holder of Bitcoin said it had snapped up even more of the digital currency.

          The company, which does business as Strategy, revealed in a Form 8-K that it had acquired 3,459 Bitcoins for roughly $285.8 million, or around $82,618 per Bitcoin, in the period between April 7 and April 14.

          The latest purchase brought MicroStrategy's total holdings to 531,664 units of the digital currency, with an aggregate purchase price of $35.92 billion.

          Shares were up 2.4% to $307.26 on Monday while the S&P 500 and tech-heavy Nasdaq Composite rose 1.2% and 1.4%, respectively. The stock closed up 10% on Friday.

          In its most recent filing with the Securities and Exchange Commission, MicroStrategy reported that it had sold 959,712 Class A shares through its common stock at-the-market program for around $285.7 million.

          The company uses proceeds from its common stock ATM and STRK ATM to fund its Bitcoin purchases. As of April 13, $2.08 billion of common shares and $20.97 billion of STRK shares were available for issuance and sale.

          While MicroStrategy focused on enterprise software at the time of its inception nearly four decades ago, it has increasingly leaned into its reputation as a leveraged play on Bitcoin. The rebranding to Strategy was unveiled in early February, complete with a new logo featuring a small Bitcoin symbol.

          MicroStrategy has outperformed the broader market this year, rising 6.1% as the S&P declined 7.8%. Its performance is closely tied to fluctuations in the price of Bitcoin, which was up 0.9% over the past 24 hours to $84,682, according to CoinDesk data.

          The company has also outpaced funds that offer exposure to Bitcoin, such as the iShares Bitcoin Trust ETF. As of April 11, the BlackRock-owned ETF had lost nearly 11% this year.

          Write to Mackenzie Tatananni at mackenzie.tatananni@barrons.com

          This content was created by Barron's, which is operated by Dow Jones & Co. Barron's is published independently from Dow Jones Newswires and The Wall Street Journal.

          Risk Warnings and Disclaimers
          You understand and acknowledge that there is a high degree of risk involved in trading. Following any strategies or investment methods may lead to potential losses. The content on the site is provided by our contributors and analysts for information purposes only. You are solely responsible for determining whether any trading assets, securities, strategy, or any other product is suitable for investing based on your own investment objectives and financial situation.
          Add to Favorites
          Share

          Just 964,247 SHIB: Shiba Inu Burn Rate Crashes to Rare Lows

          U.Today
          Prompt / Tether
          -4.73%
          1inch / Tether
          -1.74%
          AAVE / Tether
          -0.58%
          Fusionist / Tether
          -2.12%

          Dog-themed cryptocurrency Shiba Inu saw significantly low burns in the last 24 hours, raising eyebrows on the market. According to data from Shibburn, only 964,247 SHIB tokens were burned in the last 24 hours, a 95% drop in the daily burn rate.

          Shibburn
          @shibburn

          HOURLY SHIB UPDATE$SHIB Price: $0.00001235 (1hr 1.58% ▲ | 24hr -0.80% ▼ )

          Market Cap: $7,283,773,312 (-0.65% ▼)

          Total Supply: 589,252,222,601,242

          TOKENS BURNT

          Past 24Hrs: 964,247 (-95.08% ▼)

          Past 7 Days: 78,157,631 (-58.93% ▼)

          Apr 14, 2025

          For a token that has seen millions or even billions of SHIB burned daily, this significant drop marks a slowdown in community-led burn activity. The sub-one million figure represents one of the lowest 24-hour totals recorded in recent memory.

          While there is no specific explanation yet, various factors could be contributing to the drop, including broader market cooling. It is also possible that holders might be opting to HODL rather than burn, waiting for a price surge amid the ongoing rebound attempt.

          However, a single day of low burn activity may not be a long-term concern, as the smallest of burns still contribute to the bigger picture over time, especially when combined with other initiatives across the Shiba Inu ecosystem.

          SHIB's price awaits major breakout

          At press time, SHIB was up 0.81% in the last 24 hours to $0.00001236 and up nearly 14% weekly.

          Shiba Inu is on breakout watch as the broader crypto market returns to green, sparking expectations of a bullish surge in altcoins.

          The recent uptick in the SHIB price has brought it closer to a much-watched resistance level, with bulls attempting to push the price above the daily SMA 50 at $0.00001279. A strong close above this level, paired with increasing volume, could signal a breakout toward the next targets at $0.0000156 and the daily SMA 200 at $0.000019, where bulls are expected to mount resistance.

          Meanwhile, cautious sentiment remains on the market; support is envisaged in the $0.00001 range if bearish pressure returns. 

          Risk Warnings and Disclaimers
          You understand and acknowledge that there is a high degree of risk involved in trading. Following any strategies or investment methods may lead to potential losses. The content on the site is provided by our contributors and analysts for information purposes only. You are solely responsible for determining whether any trading assets, securities, strategy, or any other product is suitable for investing based on your own investment objectives and financial situation.
          Add to Favorites
          Share
          FastBull
          Copyright © 2025 FastBull Ltd

          728 RM B 7/F GEE LOK IND BLDG NO 34 HUNG TO RD KWUN TONG KLN HONG KONG

          TelegramInstagramTwitterfacebooklinkedin
          App Store Google Play Google Play
          Products
          Charts

          Chats

          Q&A with Experts
          Screeners
          Economic Calendar
          Data
          Tools
          Membership
          Features
          Function
          Markets
          Copy Trading
          Latest Signals
          Contests
          News
          Analysis
          24/7
          Columns
          Education
          Company
          Careers
          About Us
          Contact Us
          Advertising
          Help Center
          Feedback
          User Agreement
          Privacy Policy
          Business

          White Label

          Data API

          Web Plug-ins

          Poster Maker

          Affiliate Program

          Risk Disclosure

          The risk of loss in trading financial instruments such as stocks, FX, commodities, futures, bonds, ETFs and crypto can be substantial. You may sustain a total loss of the funds that you deposit with your broker. Therefore, you should carefully consider whether such trading is suitable for you in light of your circumstances and financial resources.

          No decision to invest should be made without thoroughly conducting due diligence by yourself or consulting with your financial advisors. Our web content might not suit you since we don't know your financial conditions and investment needs. Our financial information might have latency or contain inaccuracy, so you should be fully responsible for any of your trading and investment decisions. The company will not be responsible for your capital loss.

          Without getting permission from the website, you are not allowed to copy the website's graphics, texts, or trademarks. Intellectual property rights in the content or data incorporated into this website belong to its providers and exchange merchants.

          Not Logged In

          Log in to access more features

          FastBull Membership

          Not yet

          Purchase

          Become a signal provider
          Help Center
          Customer Service
          Dark Mode
          Price Up/Down Colors

          Log In

          Sign Up

          Position
          Layout
          Fullscreen
          Default to Chart
          The chart page opens by default when you visit fastbull.com