


- XAUUSD
- XAGUSD
- WTI
- USDX



Markets
Analysis
User
24/7
Economic Calendar
Education
Data
- Names
- Latest
- Prev









Compare the best short oil ETFs and inverse oil products, including SCO, SOIL, WTIS, and WTOS. Learn their leverage, underlying exposure, risks, and US availability.
Short oil ETFs let investors seek profits when crude oil prices decline. However, not all inverse oil products track crude oil directly. Some follow WTI futures, while others bet against energy stocks. Understanding these differences helps investors choose a product that matches their market outlook and trading strategy.
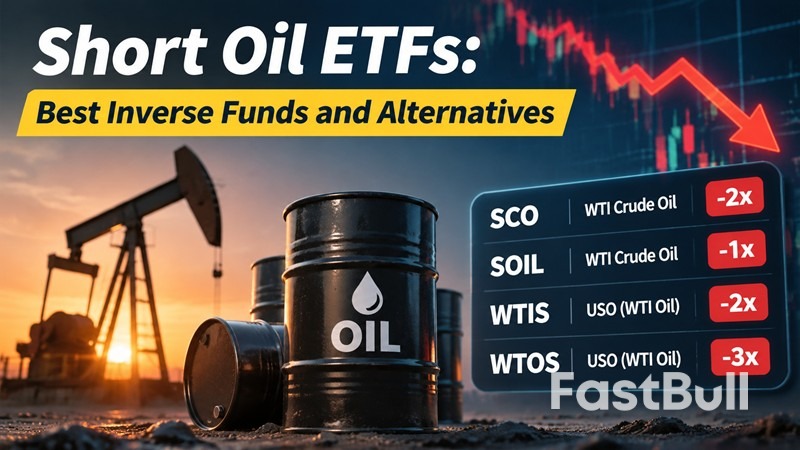
The best short oil product depends on the underlying exposure, leverage and trading market. Some products directly target falling WTI crude oil prices, while others provide inverse exposure to oil and gas companies. The table below compares the main options.
| Product | Ticker | Underlying Exposure | Daily Target | Market / Structure |
|---|---|---|---|---|
| ProShares UltraShort Bloomberg Crude Oil | SCO | WTI crude oil index | -2x | US ETF |
| WisdomTree WTI Crude Oil 1x Daily Short | SOIL | WTI crude oil index | -1x | Europe ETC |
| Leverage Shares -2x Short WTI Oil | WTIS | United States Oil Fund (USO) | -2x | Europe ETP |
| Leverage Shares -3x Short WTI Oil | WTOS | United States Oil Fund (USO) | -3x | Europe ETC |
| ProShares UltraShort Energy | DUG | Energy sector stocks | -2x | US ETF |
| Direxion Daily Energy Bear 2X ETF | ERY | Energy sector stocks | -2x | US ETF |
| Direxion Daily S&P Oil & Gas Exp. & Prod. Bear 2X ETF | DRIP | Oil and gas exploration and production stocks | -2x | US ETF |
Note: WTIS and WTOS are European-listed exchange-traded products, not US-listed ETFs. Their trading codes vary by exchange and currency. For example, WTIS trades as WTIS in USD and SWTI in GBP on the London Stock Exchange, while WTOS trades as WTOS in USD and SWTO in GBP. SOIL also trades under different codes, including SOIL in USD and 1OIS in GBP on the London Stock Exchange. Always check the exchange and currency before placing an order. All leverage targets refer to daily performance before fees and expenses.
Investors who expect crude oil prices to fall should focus on products linked to WTI oil benchmarks or oil-related instruments rather than energy company stocks.
ProShares UltraShort Bloomberg Crude Oil (SCO) is a major choice for US investors. It seeks to deliver twice the inverse (-2x) of the daily performance of the Bloomberg Commodity Balanced WTI Crude Oil Index. SCO uses futures contracts and swaps to obtain exposure rather than holding physical crude oil. If its benchmark falls 1% in a day, SCO aims to gain approximately 2% before fees and expenses.
WisdomTree WTI Crude Oil 1x Daily Short (SOIL) provides -1x daily exposure to WTI crude oil. It is a fully collateralized Exchange Traded Commodity (ETC) designed to track the inverse daily performance of the Bloomberg WTI Crude Oil SL Excess Return Index. Unlike SCO, it does not use a -2x leverage target.
Leverage Shares -2x and -3x Short WTI Oil (WTIS and WTOS) provide higher inverse exposure through United States Oil Fund (USO) shares. WTIS targets -2x, while WTOS targets -3x the daily return of USO, before fees and costs. Both are European-listed products. Because their reference asset is USO rather than the same WTI futures index tracked by SCO or SOIL, their returns may differ from those of other inverse oil products.
Not every short oil ETF is designed to profit directly from falling crude oil prices. Some products instead short publicly traded energy companies, whose share prices can respond to oil prices, operating costs, production levels, debt and broader stock market conditions.
DUG (ProShares UltraShort Energy) seeks -2x the daily performance of the S&P Energy Select Sector Index. It provides inverse exposure to the broader US energy sector rather than crude oil futures alone.
ERY (Direxion Daily Energy Bear 2X ETF) also targets -2x the daily performance of the Energy Select Sector Index. It is another option for investors who expect energy stocks to decline, although its returns will not necessarily match changes in WTI crude prices.
DRIP (Direxion Daily S&P Oil & Gas Exp. & Prod. Bear 2X ETF) targets -2x the daily performance of the S&P Oil & Gas Exploration & Production Select Industry Index. Its exposure is more concentrated in companies involved in finding and producing oil and natural gas.
The key distinction is what each product tracks. SCO and SOIL provide inverse exposure to crude oil benchmarks, while WTIS and WTOS use USO as their reference asset. DUG, ERY and DRIP provide bearish exposure to energy-related equities. Choosing between them depends on whether the investment thesis concerns falling oil prices or declining energy company shares.
US investors have fewer choices when looking for an exchange-traded product that directly targets falling crude oil prices. Among the products listed above, SCO is the main US-listed ETF providing direct inverse exposure to WTI crude oil futures, with a daily target of -2x its benchmark.
Other US-listed products, including DUG, ERY and DRIP, provide inverse exposure to energy stocks rather than crude oil futures. They may benefit from falling oil prices when lower commodity prices pressure energy companies, but this relationship is not guaranteed. Company earnings, production costs and stock market sentiment can cause their returns to diverge from oil prices.
Investors looking for -1x or -3x direct oil exposure may encounter SOIL and WTOS, respectively, but these are European-listed ETCs rather than US-listed ETFs. WTIS is another European-listed product offering -2x exposure to USO. Access depends on the investor's brokerage account, available exchanges and eligibility requirements. These European products are not available for sale to US persons.
Therefore, US investors should first decide whether they want to short crude oil itself or energy company stocks. The distinction is more important than simply choosing the highest available leverage.
Short oil products aim to deliver a specified multiple of the opposite daily return of an underlying benchmark. The leverage factor determines how much the product moves relative to its benchmark in a single trading day, before fees and expenses.
A 1x inverse product aims to gain approximately 1% when its benchmark falls 1%. A 2x product targets a 2% gain, while a 3x product targets a 3% gain. The same relationship works in reverse when the benchmark rises.
| Daily Benchmark Return | -1x Product | -2x Product | -3x Product |
|---|---|---|---|
| -1% | +1% | +2% | +3% |
| +1% | -1% | -2% | -3% |
These are approximate daily targets, not guaranteed returns. Actual results can differ because of management fees, financing costs, derivative pricing and tracking differences. Each product also follows its own benchmark, which may not be the spot price of crude oil.
Most leveraged and inverse products reset their exposure every trading day. Returns therefore compound based on the product's value at the beginning of each new trading day, rather than simply multiplying the benchmark's total return by the leverage factor.
For example, suppose an oil benchmark starts at 100, falls 10% to 90, and then rises approximately 11.1% back to 100. The benchmark has returned to its starting level. However, a hypothetical -2x daily inverse product would rise from 100 to 120 on the first day, then lose approximately 22.2% on the second day, ending at about 93.33.
The product would lose approximately 6.7% even though the benchmark finished unchanged. This is why a short oil ETF can lose money during a volatile period even when its underlying benchmark eventually returns to its starting price.
Short oil ETFs can amplify losses as well as gains. Their performance depends not only on the direction of oil prices but also on daily volatility, futures market conditions and the structure of the product.
Daily resetting is one of the biggest risks of leveraged inverse products. When oil prices move up and down repeatedly, daily returns compound in a way that can reduce the product's value over time.
This effect is particularly important for 2x and 3x products because their exposure is larger. A short oil ETF may perform well during a sustained decline in its benchmark but struggle when prices fluctuate sharply without a clear direction.
Many oil-linked products use futures contracts rather than holding physical crude oil. Since futures contracts expire, the underlying index may need to replace expiring contracts with contracts for later delivery. This process is known as rolling.
The price difference between futures contracts can affect returns. In a contango market, later-dated contracts trade above near-term contracts. In backwardation, near-term contracts trade above later-dated contracts. These conditions influence futures-based index performance, so an inverse oil product may not move exactly opposite to the spot price of WTI crude oil.
The impact depends on the product's benchmark, futures exposure and roll methodology. Investors should check the index methodology and product documents rather than assume that every short oil ETF responds identically to changes in spot oil prices.
Higher leverage increases both potential gains and potential losses. A 3x inverse product can lose approximately 3% in one day when its benchmark rises 1%, before fees and tracking differences. A larger adverse move can quickly produce substantial losses.
Other risks include derivative counterparty exposure, liquidity constraints, bid-ask spreads, management fees and differences between market prices and net asset value. These costs can reduce returns, particularly for products with lower trading volume.
The SEC's investor bulletin on leveraged and inverse ETFs also warns that these products can behave very differently from their stated daily objectives over longer holding periods.
The right product depends on what you expect to decline, how much leverage you want and where you can trade. Consider these factors before choosing:
For investors who want direct exposure to falling WTI prices, the underlying benchmark should be the first consideration. Choosing a higher leverage factor does not automatically make a product a better choice.
Short oil ETFs provide a way to trade bearish oil market expectations without directly opening a futures position. However, their daily leverage, futures exposure and compounding effects can make longer-term returns unpredictable. Understanding the underlying benchmark is essential before choosing a product.

728 RM B 7/F GEE LOK IND BLDG NO 34 HUNG TO RD KWUN TONG KLN HONG KONG


The risk of loss in trading financial instruments such as stocks, FX, commodities, futures, bonds, ETFs and crypto can be substantial. You may sustain a total loss of the funds that you deposit with your broker. Therefore, you should carefully consider whether such trading is suitable for you in light of your circumstances and financial resources.
No decision to invest should be made without thoroughly conducting due diligence by yourself or consulting with your financial advisors. Our web content might not suit you since we don't know your financial conditions and investment needs. Our financial information might have latency or contain inaccuracy, so you should be fully responsible for any of your trading and investment decisions. The company will not be responsible for your capital loss.
Without getting permission from the website, you are not allowed to copy the website's graphics, texts, or trademarks. Intellectual property rights in the content or data incorporated into this website belong to its providers and exchange merchants.
Not Logged In
Log in to access more features


Log In
Sign Up