


Markets
News
Analysis
User
24/7
Economic Calendar
Education
Data
- Names
- Latest
- Prev


The end of an earnings season can be a great time to discover new stocks and assess how companies are handling the current business environment. Let’s take a look at how 1st Source and the rest of the regional banks stocks fared in Q2.
Regional banks, financial institutions operating within specific geographic areas, serve as intermediaries between local depositors and borrowers. They benefit from rising interest rates that improve net interest margins (the difference between loan yields and deposit costs), digital transformation reducing operational expenses, and local economic growth driving loan demand. However, these banks face headwinds from fintech competition, deposit outflows to higher-yielding alternatives, credit deterioration (increasing loan defaults) during economic slowdowns, and regulatory compliance costs. Recent concerns about regional bank stability following high-profile failures and significant commercial real estate exposure present additional challenges.
The 98 regional banks stocks we track reported a satisfactory Q2. As a group, revenues were in line with analysts’ consensus estimates.
While some regional banks stocks have fared somewhat better than others, they have collectively declined. On average, share prices are down 5% since the latest earnings results.
Tracing its roots back to 1863 during the Civil War era, 1st Source Corporation is a regional bank holding company that provides commercial, consumer, specialty finance, and wealth management services across Indiana, Michigan, and Florida.
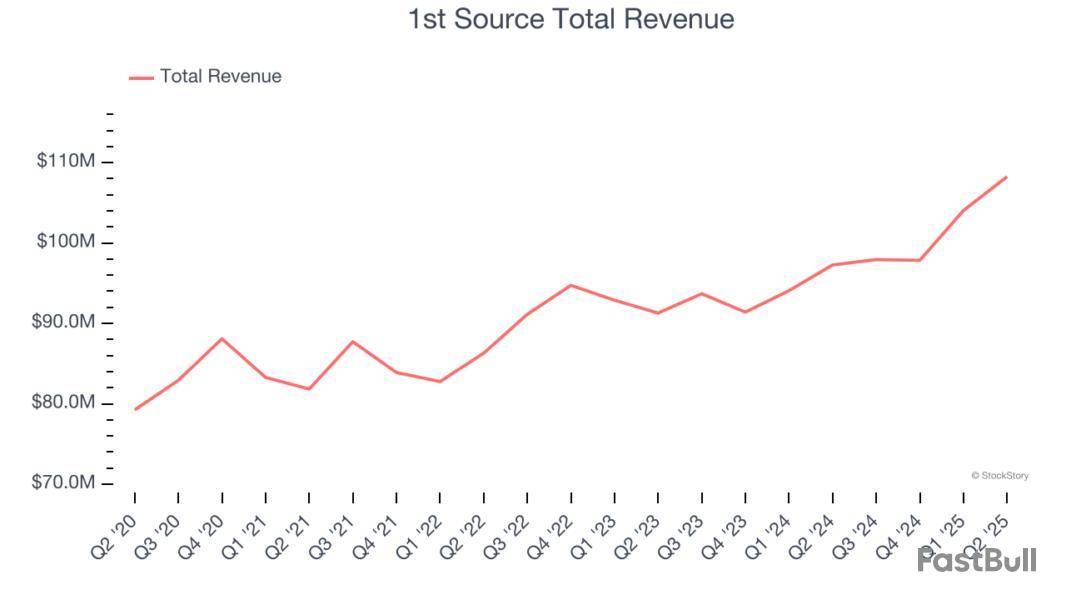
1st Source reported revenues of $108.2 million, up 11.3% year on year. This print exceeded analysts’ expectations by 3.4%. Overall, it was a strong quarter for the company with a solid beat of analysts’ net interest income estimates and a decent beat of analysts’ EPS estimates.
Christopher J. Murphy III, Chairman and Chief Executive Officer, commented, "We are pleased that the strong start in 2025 continued through the second quarter. In spite of the noise in the economy and the uncertainty in the market, we are proud to have achieved a sixth consecutive quarter of margin expansion resulting from higher rates on investment securities, increased average loan and lease balances, and lower deposit costs.
Unsurprisingly, the stock is down 4.8% since reporting and currently trades at $59.01.
We think 1st Source is a good business, but is it a buy today? Read our full report here, it’s free.
With roots dating back to 1913 and a name derived from "United Missouri Bank," UMB Financial is a financial holding company that provides banking, asset management, and fund services to commercial, institutional, and individual customers.
UMB Financial reported revenues of $689.2 million, up 76.7% year on year, outperforming analysts’ expectations by 8.6%. The business had a stunning quarter with a solid beat of analysts’ EPS estimates and an impressive beat of analysts’ tangible book value per share estimates.
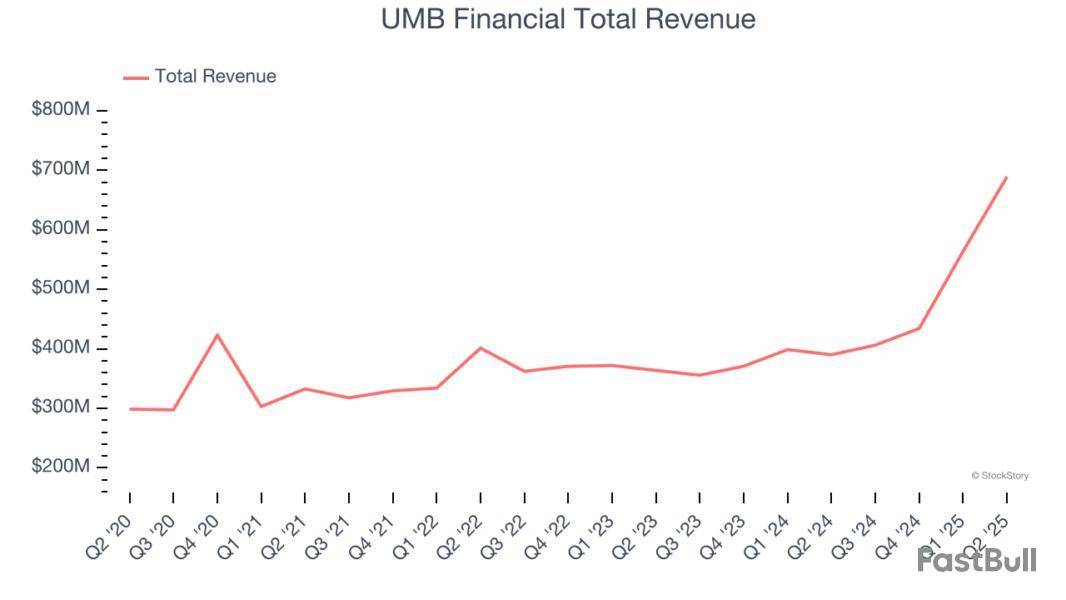
Although it had a fine quarter compared its peers, the market seems unhappy with the results as the stock is down 1.8% since reporting. It currently trades at $107.81.
Is now the time to buy UMB Financial? Access our full analysis of the earnings results here, it’s free.
Pioneering the intersection of traditional banking and financial technology in the Pacific Northwest, Coastal Financial operates as a bank holding company that provides traditional banking services and Banking-as-a-Service (BaaS) solutions to consumers and businesses.
Coastal Financial reported revenues of $119.4 million, down 11.7% year on year, falling short of analysts’ expectations by 21.5%. It was a disappointing quarter as it posted a significant miss of analysts’ net interest income estimates and a significant miss of analysts’ EPS estimates.
As expected, the stock is down 6.1% since the results and currently trades at $95.23.
Read our full analysis of Coastal Financial’s results here.
Created through strategic mergers to serve the growing Texas business community, Stellar Bancorp is a Texas bank holding company that provides commercial banking services primarily to small and medium-sized businesses and professionals.
Stellar Bancorp reported revenues of $104.1 million, down 2.5% year on year. This result lagged analysts' expectations by 0.8%. Aside from that, it was a mixed quarter as it also logged an impressive beat of analysts’ EPS estimates but a slight miss of analysts’ net interest income estimates.
The stock is down 9% since reporting and currently trades at $28.74.
Read our full, actionable report on Stellar Bancorp here, it’s free.
Founded during the Texas banking renaissance of the 1990s with an entrepreneurial spirit, Texas Capital Bancshares is a financial services firm that provides banking, wealth management, and investment banking services to businesses and individuals across Texas and beyond.
Texas Capital Bank reported revenues of $307.5 million, up 15.2% year on year. This number beat analysts’ expectations by 2.7%. Overall, it was an exceptional quarter as it also produced a solid beat of analysts’ EPS estimates and a solid beat of analysts’ net interest income estimates.
The stock is down 5.9% since reporting and currently trades at $80.57.
Read our full, actionable report on Texas Capital Bank here, it’s free.
Market Update
Thanks to the Fed’s rate hikes in 2022 and 2023, inflation has been on a steady path downward, easing back toward that 2% sweet spot. Fortunately (miraculously to some), all this tightening didn’t send the economy tumbling into a recession, so here we are, cautiously celebrating a soft landing. The cherry on top? Recent rate cuts (half a point in September 2024, a quarter in November) have propped up markets, especially after Trump’s November win lit a fire under major indices and sent them to all-time highs. However, there’s still plenty to ponder — tariffs, corporate tax cuts, and what 2025 might hold for the economy.
728 RM B 7/F GEE LOK IND BLDG NO 34 HUNG TO RD KWUN TONG KLN HONG KONG


The risk of loss in trading financial instruments such as stocks, FX, commodities, futures, bonds, ETFs and crypto can be substantial. You may sustain a total loss of the funds that you deposit with your broker. Therefore, you should carefully consider whether such trading is suitable for you in light of your circumstances and financial resources.
No decision to invest should be made without thoroughly conducting due diligence by yourself or consulting with your financial advisors. Our web content might not suit you since we don't know your financial conditions and investment needs. Our financial information might have latency or contain inaccuracy, so you should be fully responsible for any of your trading and investment decisions. The company will not be responsible for your capital loss.
Without getting permission from the website, you are not allowed to copy the website's graphics, texts, or trademarks. Intellectual property rights in the content or data incorporated into this website belong to its providers and exchange merchants.
Not Logged In
Log in to access more features

FastBull Membership
Not yet
Purchase


Log In
Sign Up


