• Trade
  • Markets
  • Copy
  • Contests
  • News
  • 24/7
  • Calendar
  • Q&A
  • Chats
Trending
Screeners
SYMBOL
LAST
BID
ASK
HIGH
LOW
NET CHG.
%CHG.
SPREAD
SPX
S&P 500 Index
6827.42
6827.42
6827.42
6899.86
6801.80
-73.58
-1.07%
--
DJI
Dow Jones Industrial Average
48458.04
48458.04
48458.04
48886.86
48334.10
-245.98
-0.51%
--
IXIC
NASDAQ Composite Index
23195.16
23195.16
23195.16
23554.89
23094.51
-398.69
-1.69%
--
USDX
US Dollar Index
97.910
97.990
97.910
98.070
97.810
-0.040
-0.04%
--
EURUSD
Euro / US Dollar
1.17474
1.17481
1.17474
1.17596
1.17262
+0.00080
+ 0.07%
--
GBPUSD
Pound Sterling / US Dollar
1.33868
1.33875
1.33868
1.33961
1.33546
+0.00161
+ 0.12%
--
XAUUSD
Gold / US Dollar
4330.30
4330.64
4330.30
4350.16
4294.68
+30.91
+ 0.72%
--
WTI
Light Sweet Crude Oil
56.939
56.969
56.939
57.601
56.789
-0.294
-0.51%
--

Community Accounts

Signal Accounts
--
Profit Accounts
--
Loss Accounts
--
View More

Become a signal provider

Sell trading signals to earn additional income

View More

Guide to Copy Trading

Get started with ease and confidence

View More

Signal Accounts for Members

All Signal Accounts

Best Return
  • Best Return
  • Best P/L
  • Best MDD
Past 1W
  • Past 1W
  • Past 1M
  • Past 1Y

All Contests

  • All
  • Trump Updates
  • Recommend
  • Stocks
  • Cryptocurrencies
  • Central Banks
  • Featured News
Top News Only
Share

Portugal Treasury Puts 2026 Net Financing Needs At 13 Billion Euros, Up From 10.8 Billion In 2025

Share

Portugal Treasury Expects 2026 Net Financing Needs At 29.4 Billion Euros, Up From 25.8 Billion In 2025

Share

Bank Of America Says With Indonesia's Smelter Now Ramping Up, It Expects Aluminium Supply Growth To Accelerate To 2.6% Year On Year In 2026

Share

Bank Of America Expects A Deficit In Aluminium Next Year And Sees Prices Pushing Above $3000/T

Share

Fed Data - USA Effective Federal Funds Rate At 3.64 Percent On 12 December On $102 Billion In Trades Versus 3.64 Percent On $99 Billion On 11 December

Share

Brazil's Petrobras Says No Impact Seen On Oil, Petroleum Products Output As Workers Start Planned Strike

Share

Statement: US Travel Group Warns New Proposed Trump Administration Requirements For Foreign Tourists To Provide Social Media Histories Could Mean Millions Of People Opting Not To Visit

Share

Blackrock: Kerry White Will Become Head Of Citi Investment Management At Citi Wealth

Share

Blackrock: Rob Jasminski, Head Of Citi Investment Management, Has Joined With Team

Share

Blackrock: Effective Dec 15, Citi Investment Management Employees Will Join Blackrock

Share

Blackrock: Formally Launch Citi Portfolio Solutions Powered By Blackrock

Share

According To Data From The Federal Reserve Bank Of New York, The Secured Overnight Funding Rate (Sofr) Was 3.67% On The Previous Trading Day (December 15), Compared To 3.66% The Day Before

Share

Peru Energy And Mines Ministry: Copper Production Up 4.8% Year-On-Year In October To 248192 Metric Tons

Share

Security Source: Ukrainian Drones Hits Russian Oil Infrastructure In Caspian Sea For Third Time

Share

Spot Palladium Extends Gains, Last Up 5% To $1562.7/Oz

Share

Mexico's Economy Ministry Announces Start Of Anti-Dumping Investigation And Anti-Subsidy Investigations Into USA Pork Imports

Share

Canada Nov CPI Common +2.8%, CPI Median +2.8%, CPI Trim +2.8% On Year

Share

NY Fed's Empire State Prices Paid Index +37.6 In December Versus+49.0 In November

Share

Canada Nov Consumer Prices +0.1% On Month, +2.2% On Year

Share

Canada Nov CPI Core -0.1% On Month, +2.9% On Year

TIME
ACT
FCST
PREV
Japan Tankan Small Manufacturing Outlook Index (Q4)

A:--

F: --

P: --

Japan Tankan Large Non-Manufacturing Outlook Index (Q4)

A:--

F: --

P: --

Japan Tankan Large Manufacturing Outlook Index (Q4)

A:--

F: --

P: --

Japan Tankan Small Manufacturing Diffusion Index (Q4)

A:--

F: --

P: --

Japan Tankan Large Manufacturing Diffusion Index (Q4)

A:--

F: --

P: --

Japan Tankan Large-Enterprise Capital Expenditure YoY (Q4)

A:--

F: --

P: --

U.K. Rightmove House Price Index YoY (Dec)

A:--

F: --

P: --

China, Mainland Industrial Output YoY (YTD) (Nov)

A:--

F: --

P: --

China, Mainland Urban Area Unemployment Rate (Nov)

A:--

F: --

P: --

Saudi Arabia CPI YoY (Nov)

A:--

F: --

P: --

Euro Zone Industrial Output YoY (Oct)

A:--

F: --

P: --

Euro Zone Industrial Output MoM (Oct)

A:--

F: --

P: --

Canada Existing Home Sales MoM (Nov)

A:--

F: --

P: --

Canada National Economic Confidence Index

A:--

F: --

P: --

Canada New Housing Starts (Nov)

A:--

F: --

P: --
U.S. NY Fed Manufacturing Employment Index (Dec)

A:--

F: --

P: --

U.S. NY Fed Manufacturing Index (Dec)

A:--

F: --

P: --

Canada Core CPI YoY (Nov)

A:--

F: --

P: --

Canada Manufacturing Unfilled Orders MoM (Oct)

A:--

F: --

P: --

U.S. NY Fed Manufacturing Prices Received Index (Dec)

A:--

F: --

P: --

U.S. NY Fed Manufacturing New Orders Index (Dec)

A:--

F: --

P: --

Canada Manufacturing New Orders MoM (Oct)

A:--

F: --

P: --

Canada Core CPI MoM (Nov)

A:--

F: --

P: --

Canada Trimmed CPI YoY (SA) (Nov)

A:--

F: --

P: --

Canada Manufacturing Inventory MoM (Oct)

A:--

F: --

P: --

Canada CPI YoY (Nov)

A:--

F: --

P: --

Canada CPI MoM (Nov)

A:--

F: --

P: --

Canada CPI YoY (SA) (Nov)

A:--

F: --

P: --

Canada Core CPI MoM (SA) (Nov)

A:--

F: --

P: --

Canada CPI MoM (SA) (Nov)

A:--

F: --

P: --

Federal Reserve Board Governor Milan delivered a speech
U.S. NAHB Housing Market Index (Dec)

--

F: --

P: --

Australia Composite PMI Prelim (Dec)

--

F: --

P: --

Australia Services PMI Prelim (Dec)

--

F: --

P: --

Australia Manufacturing PMI Prelim (Dec)

--

F: --

P: --

Japan Manufacturing PMI Prelim (SA) (Dec)

--

F: --

P: --

U.K. 3-Month ILO Employment Change (Oct)

--

F: --

P: --

U.K. Unemployment Claimant Count (Nov)

--

F: --

P: --

U.K. Unemployment Rate (Nov)

--

F: --

P: --

U.K. 3-Month ILO Unemployment Rate (Oct)

--

F: --

P: --

U.K. Average Weekly Earnings (3-Month Average, Including Bonuses) YoY (Oct)

--

F: --

P: --

U.K. Average Weekly Earnings (3-Month Average, Excluding Bonuses) YoY (Oct)

--

F: --

P: --

France Services PMI Prelim (Dec)

--

F: --

P: --

France Composite PMI Prelim (SA) (Dec)

--

F: --

P: --

France Manufacturing PMI Prelim (Dec)

--

F: --

P: --

Germany Services PMI Prelim (SA) (Dec)

--

F: --

P: --

Germany Manufacturing PMI Prelim (SA) (Dec)

--

F: --

P: --

Germany Composite PMI Prelim (SA) (Dec)

--

F: --

P: --

Euro Zone Composite PMI Prelim (SA) (Dec)

--

F: --

P: --

Euro Zone Services PMI Prelim (SA) (Dec)

--

F: --

P: --

Euro Zone Manufacturing PMI Prelim (SA) (Dec)

--

F: --

P: --

U.K. Services PMI Prelim (Dec)

--

F: --

P: --

U.K. Manufacturing PMI Prelim (Dec)

--

F: --

P: --

U.K. Composite PMI Prelim (Dec)

--

F: --

P: --

Euro Zone ZEW Economic Sentiment Index (Dec)

--

F: --

P: --

Germany ZEW Current Conditions Index (Dec)

--

F: --

P: --

Germany ZEW Economic Sentiment Index (Dec)

--

F: --

P: --

Euro Zone Trade Balance (Not SA) (Oct)

--

F: --

P: --

Euro Zone ZEW Current Conditions Index (Dec)

--

F: --

P: --

Euro Zone Trade Balance (SA) (Oct)

--

F: --

P: --

U.S. Retail Sales MoM (Excl. Automobile) (SA) (Oct)

--

F: --

P: --

Q&A with Experts
    • All
    • Chatrooms
    • Groups
    • Friends
    Connecting
    .
    .
    .
    Type here...
    Add Symbol or Code

      No matching data

      All
      Trump Updates
      Recommend
      Stocks
      Cryptocurrencies
      Central Banks
      Featured News
      • All
      • Russia-Ukraine Conflict
      • Middle East Flashpoint
      • All
      • Russia-Ukraine Conflict
      • Middle East Flashpoint
      Search
      Products

      Charts Free Forever

      Chats Q&A with Experts
      Screeners Economic Calendar Data Tools
      Membership Features
      Data Warehouse Market Trends Institutional Data Policy Rates Macro

      Market Trends

      Market Sentiment Order Book Forex Correlations

      Top Indicators

      Charts Free Forever
      Markets

      News

      News Analysis 24/7 Columns Education
      From Institutions From Analysts
      Topics Columnists

      Latest Views

      Latest Views

      Trending Topics

      Top Columnists

      Latest Update

      Signals

      Copy Rankings Latest Signals Become a signal provider AI Rating
      Contests
      Brokers

      Overview Brokers Assessment Rankings Regulators News Claims
      Broker listing Forex Brokers Comparison Tool Live Spread Comparison Scam
      Q&A Complaint Scam Alert Videos Tips to Detect Scam
      More

      Business
      Events
      Careers About Us Advertising Help Center

      White Label

      Data API

      Web Plug-ins

      Affiliate Program

      Awards Institution Evaluation IB Seminar Salon Event Exhibition
      Vietnam Thailand Singapore Dubai
      Fans Party Investment Sharing Session
      FastBull Summit BrokersView Expo
      Recent Searches
        Top Searches
          Markets
          News
          Analysis
          User
          24/7
          Economic Calendar
          Education
          Data
          • Names
          • Latest
          • Prev

          View All

          No data

          Scan to Download

          Faster Charts, Chat Faster!

          Download App
          English
          • English
          • Español
          • العربية
          • Bahasa Indonesia
          • Bahasa Melayu
          • Tiếng Việt
          • ภาษาไทย
          • Français
          • Italiano
          • Türkçe
          • Русский язык
          • 简中
          • 繁中
          Open Account
          Search
          Products
          Charts Free Forever
          Markets
          News
          Signals

          Copy Rankings Latest Signals Become a signal provider AI Rating
          Contests
          Brokers

          Overview Brokers Assessment Rankings Regulators News Claims
          Broker listing Forex Brokers Comparison Tool Live Spread Comparison Scam
          Q&A Complaint Scam Alert Videos Tips to Detect Scam
          More

          Business
          Events
          Careers About Us Advertising Help Center

          White Label

          Data API

          Web Plug-ins

          Affiliate Program

          Awards Institution Evaluation IB Seminar Salon Event Exhibition
          Vietnam Thailand Singapore Dubai
          Fans Party Investment Sharing Session
          FastBull Summit BrokersView Expo

          Ready To Rocket? Dogecoin Chart Hints At Major Gains Ahead

          NewsBTC
          OKX Liquid Staked Solana / Tether
          +2.98%
          1inch / Tether
          -1.72%
          AAVE / Tether
          +1.96%
          Fusionist / Tether
          -2.47%

          Crypto analyst Ali Martinez (@ali_charts) has spotlighted a potential trend reversal for Dogecoin, revealing that the popular memecoin has flashed a bullish technical signal on its daily chart. According to Martinez, the TD Sequential indicator has presented a “buy signal,” suggesting a price rebound could be on the horizon.

          Dogecoin Prints TD9 Buy Signal

          The shared chart—spanning daily candlesticks of the DOGE/USDT pair—illustrates 10 days of downward price action. Dogecoin has retreated from previous highs near $0.4843 to trade at approximately $0.32, shedding around -35% over the past few days. The most recent candle on the chart is a long black (bearish) bar, reflecting notable selling pressure that pushed prices towards $0.3200.

          Dogecoin price analysis

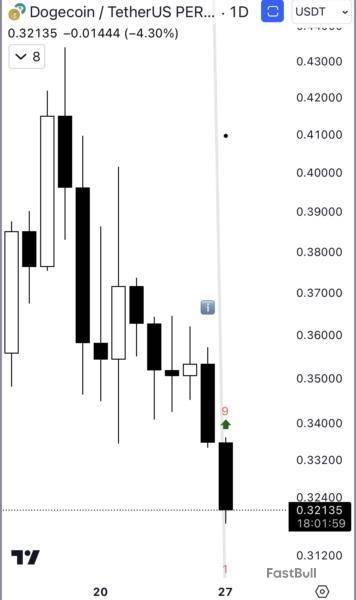
          “The TD Sequential presents a buy signal on the Dogecoin daily chart, anticipating a price rebound!” Martinez posted via X. At the core of Martinez’s observation is the TD Sequential, a widely respected technical tool among seasoned traders. Developed by market technician Tom DeMark, the TD Sequential aims to identify price exhaustion points and potential reversals in ongoing trends. It works by counting a series of consecutive candles in one direction.

          The indicator typically monitors up to nine consecutive bearish or bullish candles. When a count of nine is reached during a persistent downtrend, it often flags a possible bullish turning point—referred to as a “TD9 Buy Signal.” Conversely, nine consecutive higher closes in an uptrend can signal a potential bearish reversal.

          In more extended setups, the indicator can continue counting to 13, offering further confirmation, but the “9” signal itself often draws the most immediate attention from traders. On this Dogecoin chart, the TD9 number has just appeared, signifying that the daily downtrend might be reaching a point of buyer interest. Following a “9” candle, the sequence restarts at “1,” which can hint at the beginning of a new bullish setup, should the upcoming candles confirm the reversal.

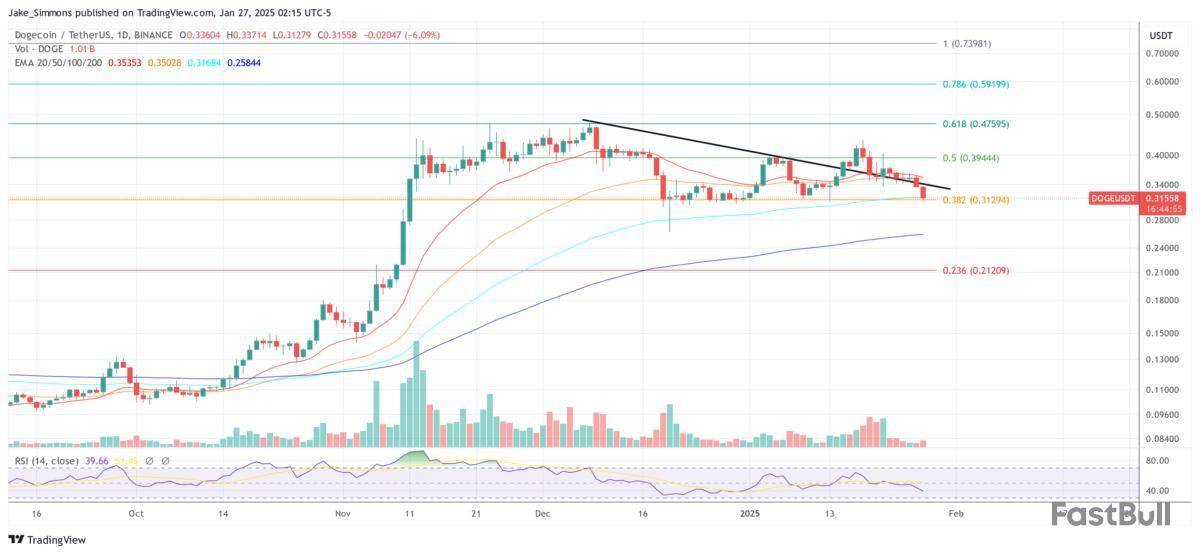
          Price Levels to Watch

          The most crucial support zone lies at $0.313, the 0.382 Fibonacci retracement level on the daily chart. Maintaining a daily close above this level could reinforce bullish momentum if buyers respond to the TD9 signal. Any attempt at a rebound will likely confront initial resistance around $0.3400, where the downtrend line is located. A decisive break above this (black) line may validate the anticipated trend reversal.

          While further out of reach, regaining ground in the $0.4000 region (0.5 Fibonacci level at $0.395) would be a stronger sign that Dogecoin has recovered from its downward spiral. Overall, Dogecoin is at a crucial spot. The TD Sequential’s “buy” setup does not guarantee instant upside, but it does historically serve as a reliable early warning of trend fatigue.

          If bullish traders capitalize on this signal, Dogecoin could stage a price recovery toward mid-range resistances. In contrast, failure to hold the $0.3100 area might prolong the current downward cycle.

          Dogecoin price
          Risk Warnings and Disclaimers
          You understand and acknowledge that there is a high degree of risk involved in trading. Following any strategies or investment methods may lead to potential losses. The content on the site is provided by our contributors and analysts for information purposes only. You are solely responsible for determining whether any trading assets, securities, strategy, or any other product is suitable for investing based on your own investment objectives and financial situation.
          Add to Favorites
          Share

          Major Bitcoin Correction Predicted by Arthur Hayes

          U.Today
          OKX Liquid Staked Solana / Tether
          +2.98%
          1inch / Tether
          -1.72%
          AAVE / Tether
          +1.96%
          Fusionist / Tether
          -2.47%

          Former BitMEX CEO Arthur Hayes has predicted that the price of Bitcoin of Bitcoin could collapse to the $70,000 level. 

          The entrepreneur believes that the possible crash will be caused by a "mini financial crisis" in the U.S. 

          With that being said, the BitMEX boss is convinced that the leading cryptocurrency could eventually surge to the $250,000 level by the end of the year. 

          The DeekSeek rout 

          Earlier today, the leading cryptocurrency crashed to an intraday low of $98,440, nosediving by nearly 7% over the past 24 hours. 

          This coincided with major chip stocks experiencing a severe rout in pre-market trading. E-mini Nasdaq-100 Futures are down 2.62%, according to the latest data. 

          The market turmoil came after the Chinese artificial intelligence (AI) startup DeepSeek released a new large language model called DeepSeek-R1, which was able to outperform some of the popular models, including OpenAI o1, on some key benchmarks. This is despite the fact that the startup was struggling to get advanced chips due to expert controls. Notably, the startup spent a puny $6 million to train the model compared to the billions of dollars required by OpenAI. 

          The model made waves shortly after OpenAI announced Startgaste, a $500 billion AI infrastructure project created in collaboration with SoftBank and some other participants. 

          The success of DeepSeek, which has emerged as the most popular app on the App Store, might put a dent in demand for chips and data centers considering that the startup spent mere peanuts on raw computing power while still outperforming the leading US tech giants. 

          Risk Warnings and Disclaimers
          You understand and acknowledge that there is a high degree of risk involved in trading. Following any strategies or investment methods may lead to potential losses. The content on the site is provided by our contributors and analysts for information purposes only. You are solely responsible for determining whether any trading assets, securities, strategy, or any other product is suitable for investing based on your own investment objectives and financial situation.
          Add to Favorites
          Share

          Solana, Dogecoin, XRP Plunge 10% as Bloody Start to Week Sees $770M Long Liquidations

          CoinDesk
          OKX Liquid Staked Solana / Tether
          +2.98%
          1inch / Tether
          -1.72%
          AAVE / Tether
          +1.96%
          Fusionist / Tether
          -2.47%

          Bullish bets on higher crypto prices lost $770 million in the past 24 hours as bitcoin fell under $100,000, leading to some majors rapidly losing momentum in a bloody start to the week.

          Solana’s SOL and dogecoin dropped more than 10% to lead losses among majors, while ether , BNB Chain’s bnb, xrp and Cardano’s ADA fell as much as 9%. Overall market cap fell 8.5% as of Asian afternoon hours Monday.

          Tokens outside of the top twenty and across different sectors showed similar woes, with memecoin pepe , layer 1 upstart Aptos (APT), Gate.io’s GATE and AI Agent creation platform Virtuals (VIRTUALS) losing as much as 18%.

          Jupiter’s JUP was the only token in green with a 3.5% gain over the past 24 hours on the back of a decision to buy back tokens from the open market from the fees generated on its trading platform — which may equate to hundreds of millions in net buying volumes in a year.

          Bitcoin slumped under $99,000 early Monday as traders took profits ahead of the first U.S. FOMC meeting this year. It tracked losses in U.S. stock futures, which fell as traders digested information about the cost and capabilities of China-based DeepSeek, threatening an otherwise costly narrative spearheaded by OpenAI.

          Futures markets reflected these losses, with traders of BTC-tracked products losing $238 million in the past 24 hours, majorly in early European and Asian afternoon hours. SOL and DOGE bets lost a cumulative $50 million, altcoin-tracked products lost $138 million and ether-tracked futures lost $84 million.

          The largest single liquidation order happened on HTX, a tether-margined BTC trade valued at $98.4 million.

          Liquidation happens when a trader has insufficient funds to keep a leveraged trade open. The crypto market's high volatility means liquidations are a common occurrence, although major events such as Monday’s can provide actionable cues for further market sentiment or positioning.

          The liquidation can signal an overstretched market, indicating that a price correction has occurred, while price-chart areas with high liquidation volumes can act as support or resistance levels where price might reverse due to the absence of further selling pressure from liquidated positions.

          However, if the market continues declining, those with short positions might see this as validation, potentially increasing their bets. Conversely, contrarian traders might view heavy liquidation as a buying opportunity, expecting a price recovery once the sell-off momentum wanes.

          Risk Warnings and Disclaimers
          You understand and acknowledge that there is a high degree of risk involved in trading. Following any strategies or investment methods may lead to potential losses. The content on the site is provided by our contributors and analysts for information purposes only. You are solely responsible for determining whether any trading assets, securities, strategy, or any other product is suitable for investing based on your own investment objectives and financial situation.
          Add to Favorites
          Share

          Key Indicator Signals Another Major Move for Ripple as XRP Price Dumps 15% Daily

          CryptoPotato
          OKX Liquid Staked Solana / Tether
          +2.98%
          1inch / Tether
          -1.72%
          AAVE / Tether
          +1.96%
          Fusionist / Tether
          -2.47%

          TL:DR;

          • Ripple’s cross-border token has slumped hard with the rest of the market today, dumping to a two-week low of under $2.7.
          • While that’s a big move on its own, the squeezing Bollinger Bands suggest that XRP could face another one soon.

          XRP Dumps 15%

          It’s safe to say that Ripple’s native token became one of the best performers throughout the entire crypto market following the US elections. The recentspeculationsthat it will be included in the potential US digital asset reserve also benefited the asset, which went from under $0.6 in early November to $3.4 in January.

          This cycle’s peakcoincidedwith the all-time high from 2018, but XRP failed to breach it. It started to lose traction in the next few weeks and retraced to $3.15 during the weekend. However, this is where the situation worsened for the entire crypto market.

          Bitcoin’s price tumbled below $100,000 for the first time in a week, and XRP was not spared. The third-largest crypto asset plunged from $3.15 to a multi-week low of $2.66 (on Bitstamp) before it recovered some ground to $2.8 as of now.

          Thus, its intraday low came after a 15% drop. While this sounds like a significant move, Ali Martinez warned that the Bollinger Bands are squeezing on XRP’s daily chart, which could lead to another “significant price move.”

          The Bollinger Bands are squeezing on the $XRP daily chart, signaling that a significant price move could be on the horizon. pic.twitter.com/Sv7miRidTb

          — Ali (@ali_charts) January 27, 2025

          What’s Next?

          Weighing in on XRP’s upcoming potential moves, macro trader Jason Pizzino noted that the next support lines are at $2.3-$2.5. The asset could avoid a price drop to those levels if its daily close is above “the previous swing top at $2.9,” which is not the case right now.

          $XRP failing at the 50% extension. Lower volume into the $3.40 top and closes under $3.16 suggest buyers didn’t have enough conviction on the next move higher. The hope for the bulls is closing above the previous swing top at $2.90. Support under here is approx $2.30-$2.50. pic.twitter.com/I7L78vthNV

          — Jason Pizzino (@jasonpizzino) January 27, 2025

          Nevertheless, most analysts remain bullish on XRP’s long-term potential. Rob Art said XRP broke out of a 7-year-long triangle recently and will soon resume its rally, but only after it shakes out all the emotional buyers and sellers. After that, it will “turbo-send” XRP higher.

          Crypto Bitlord shared a similar opinion, indicating that XRP will “experience a vertical style black swan.”

          I’m convinced that $XRP will experience a vertical style black swan.

          The price will go straight upwards with no warning.

          It will go so high nobody could have ever predicted it.

          All shorts will cease to exist from that day.

          The world will change and bitcoin will be flipped.

          — Crypto Bitlord (@crypto_bitlord7) January 26, 2025

          Risk Warnings and Disclaimers
          You understand and acknowledge that there is a high degree of risk involved in trading. Following any strategies or investment methods may lead to potential losses. The content on the site is provided by our contributors and analysts for information purposes only. You are solely responsible for determining whether any trading assets, securities, strategy, or any other product is suitable for investing based on your own investment objectives and financial situation.
          Add to Favorites
          Share

          Shiba Inu (SHIB) Slumps Below Crucial Support to a 3-Month Low: What’s Next?

          CryptoPotato
          OKX Liquid Staked Solana / Tether
          +2.98%
          1inch / Tether
          -1.72%
          AAVE / Tether
          +1.96%
          Fusionist / Tether
          -2.47%

          TL:DR;

          • The entire cryptocurrency market has turned red on a daily scale, but as usual, most meme coins have slumped a lot harder.
          • Shiba Inu is among the poorest performers, having dumped by 11% within the past 24 hours to a multi-month low. What’s even more worrying is that SHIB is currently below a crucial support line.

          The second-largest meme coin rode the post-election bull cycle in an impressive manner, going from around $0.000016 to a multi-month high of well over $0,000033. Thus, it doubled its valuation within a month, as its peak came on December 8.

          However, it failed to maintain its momentum, even though assets like BTC, XRP, ADA, XLM, and DOGE kept climbing and started to lose value gradually.

          In fact, its 2025 peak, which came on January 18, was at $0.000025 – 25% lower than the high reached in late 2024. The following week was also turbulent and adverse for SHIB, perhaps due to the TRUMP token mania, as its price slumped further to $0.0002. At one point, it evenlostits spot as the second-biggest in its field to the meme coin launched by the US president.

          Despite the recentbullish predictions, the past 24 hours brought even more pain for SHIB. Alongside the rest of the market, the self-proclaimed Dogecoin killer dumped by 11% to its lowest levels since early November of under $0.000018.

          This decline could carry even more significance as it drove SHIB below a ‘critical’ support line. According to popular crypto analyst Ali Martinez, that crucial level for SHIB’s price momentum stands between $0.0000185 and $0.0000212.

          The asset has slumped below both now, and it will be key to see whether it will close the day in such an unfavorable spot, which could trigger even more pain for the SHIB bulls.

          The $0.0000185 to $0.0000212 range stands as the most critical support zone for #ShibaInu $SHIB! pic.twitter.com/mKXcYtvqS1

          — Ali (@ali_charts) January 27, 2025

          Risk Warnings and Disclaimers
          You understand and acknowledge that there is a high degree of risk involved in trading. Following any strategies or investment methods may lead to potential losses. The content on the site is provided by our contributors and analysts for information purposes only. You are solely responsible for determining whether any trading assets, securities, strategy, or any other product is suitable for investing based on your own investment objectives and financial situation.
          Add to Favorites
          Share

          5 US Economic Events Driving Bitcoin Sentiment This Week

          Beincrypto
          OKX Liquid Staked Solana / Tether
          +2.98%
          1inch / Tether
          -1.72%
          AAVE / Tether
          +1.96%
          Fusionist / Tether
          -2.47%

          Crypto market participants have a lot to look forward to this week, with 5 US economic data due for release starting Tuesday. The market is already abuzz, anticipating the implication of these events on Bitcoin and crypto markets in general.

          The influence of US macro data on Bitcoin continues to remain apparent after a period of dissipated or dried-up effect in 2023.

          Consumer Confidence

          The first US economic event with crypto implications this week is the consumer confidence survey on Tuesday, January 28. This survey reflects likely spending trends, showcasing consumer attitudes, buying intentions, and vacation plans, among other things.

          There is a median forecast of 106.3 after the previous 104.7. Enhanced consumer confidence would suggest that people are open to spending more money, hence increasing economic activity. This would potentially drive more investments into cryptocurrencies like Bitcoin.

          Conversely, a pullback in consumer confidence could lead to decreased spending and investment. It would support a more dovish path for the Federal Reserve (Fed), leading to increased liquidity in the financial system.

          This may be favorable for Bitcoin as investors seek alternative stores of value and hedges against inflation. Therefore, the Tuesday data will be important for crypto markets, measuring how optimistic or pessimistic consumers are about the overall state of the economy.

          FOMC and Fed Chair’s Speech

          Beyond consumer confidence, crypto markets are also watching the Federal Open Market Committee (FOMC) interest rate decision on Wednesday, January 29. It marks the first FOMC decision after President Donald Trump took office, making it an interesting watch.

          “Trump is demanding rate cuts, but Powell’s signaling no change. This showdown could rock the markets,” crypto trader Roger Smith quipped.

          Policymakers recently expressed concerns about inflationary pressures, particularly tied to Trump’s proposed fiscal policies. During their last meeting, FOMC minutes provided little indication of a potential rate cut in the near term, further solidifying the Fed’s hawkish stance. As BeInCrypto reported, this stance exerted downward pressure on risk assets, including cryptocurrencies.

          Interest Rate Probabilities

          Against this backdrop, the CME FedWatch tool shows a 99.5% probability of a 25-basis-point (0.5% bps) rate cut. As this would signify a no rate change, the focus will be on the press conference with Fed Chair Jerome Powell. With these, traders and investors are expecting higher volatility amid market-moving insights from the Fed chair.

          “I’ll decide that after Wednesday, January 29, 2024, FOMC interest-rate decision 2:00 pm ET – Fed Chair Powell press conference 2:30 pm ET. No position at the moment but I see a small chance for positive,” one trader said.

          Noteworthy, the Fed has a dual mandate — to keep the Consumer Price Index (CPI), a measure of inflation, increasing by 2% per year and to maintain full employment in the economy.

          GDP

          The US GDP (Gross Domestic Data) report will be out on Thursday, January 30, adding to the list of US economic data to watch this week. The median forecast is 2.5% after the previous reading of 3.1%. This data measures the total value of goods and services produced in a country.

          A positive GDP revision could signal a strong and growing economy. This would prompt investors to allocate more capital towards riskier assets such as Bitcoin and cryptocurrencies. Conversely, a downward revision may lead to a shift in investor sentiment, resulting in a temporary decline in crypto prices.

          Initial Jobless Claims

          Crypto markets will also be keen on the initial jobless claims report on Thursday, which will provide insight into the health of the US labor market. Notably, the number of Americans filing new applications for unemployment benefits recently ticked up. However, it appeared to be steadying near a level consistent with a gradual cooling of the labor market. This is what set the stage for the Fed’s openness to rate cuts.

          The previous data came in at 223,000, with a current middle projection of 225,000. A higher-than-expected number of jobless claims could indicate economic instability and uncertainty. In turn, this would lead investors to seek alternative assets like Bitcoin as a form of hedging against traditional markets.

          On the other hand, a decrease in jobless claims could boost investor confidence in traditional markets, potentially diverting funds away from cryptocurrencies. Fed officials are also keen on the labor market, cognizant of the risks that come with waiting too long to cut rates.

          Personal Income and PCE Index

          The US Bureau of Economic Analysis (BEA) will release the personal income, spending, PCE index, and core PCE on Friday. Weaker personal income and spending, coupled with softer inflation figures, could signal a slowdown in economic activity.

          In response to this, the Federal Reserve may consider pausing interest rates to stimulate borrowing and spending and boost economic growth.

          Meanwhile, the Personal Consumption Expenditures (PCE) index, excluding volatile food and energy prices, will be a key indicator of inflation. A higher-than-expected core PCE index could indicate rising inflationary pressures.

          This would prompt investors to diversify their portfolios by investing in assets like Bitcoin, which is seen as a hedge against inflation. Conversely, a lower core PCE index could lead to a decrease in demand for cryptocurrencies as investors flock to more stable investment options.

          BTC Price Performance

          Ahead of these US economic events, BeInCrypto data shows BTC was trading for $100,355, down almost 5% since Monday’s session opened.

          Risk Warnings and Disclaimers
          You understand and acknowledge that there is a high degree of risk involved in trading. Following any strategies or investment methods may lead to potential losses. The content on the site is provided by our contributors and analysts for information purposes only. You are solely responsible for determining whether any trading assets, securities, strategy, or any other product is suitable for investing based on your own investment objectives and financial situation.
          Add to Favorites
          Share

          Bitcoin May Be 'Double Topping' for a Price Slide to $75K

          CoinDesk
          OKX Liquid Staked Solana / Tether
          +2.98%
          1inch / Tether
          -1.72%
          AAVE / Tether
          +1.96%
          Fusionist / Tether
          -2.47%

          Bitcoin may drop to $75,000 should it trigger a so-called 'double top' bearish reversal pattern.

          A double top comprises two consecutive peaks at approximately the same price, with a trendline drawn through the low point between these peaks. The failure to break above the previous peak, followed by a subsequent decline, suggests that the uptrend is losing momentum.

          So, an eventual breakdown of the horizontal trendline support, the double top neckline, is said to confirm a bullish-to-bearish trend change.

          BTC has pulled back to $100,000 at the time of writing, having failed to maintain a foothold above the December high last week. In other words, BTC looks to have formed a double top, with neckline support positioned around $91,300.

          A UTC close below the neckline level would confirm the bearish reversal pattern, potentially triggering a decline to $75,000. This target is calculated using the measured move method, subtracting the gap between the twin peaks and the neckline from the neckline level.

          Risk Warnings and Disclaimers
          You understand and acknowledge that there is a high degree of risk involved in trading. Following any strategies or investment methods may lead to potential losses. The content on the site is provided by our contributors and analysts for information purposes only. You are solely responsible for determining whether any trading assets, securities, strategy, or any other product is suitable for investing based on your own investment objectives and financial situation.
          Add to Favorites
          Share
          FastBull
          Copyright © 2025 FastBull Ltd

          728 RM B 7/F GEE LOK IND BLDG NO 34 HUNG TO RD KWUN TONG KLN HONG KONG

          TelegramInstagramTwitterfacebooklinkedin
          App Store Google Play Google Play
          Products
          Charts

          Chats

          Q&A with Experts
          Screeners
          Economic Calendar
          Data
          Tools
          Membership
          Features
          Function
          Markets
          Copy Trading
          Latest Signals
          Contests
          News
          Analysis
          24/7
          Columns
          Education
          Company
          Careers
          About Us
          Contact Us
          Advertising
          Help Center
          Feedback
          User Agreement
          Privacy Policy
          Business

          White Label

          Data API

          Web Plug-ins

          Poster Maker

          Affiliate Program

          Risk Disclosure

          The risk of loss in trading financial instruments such as stocks, FX, commodities, futures, bonds, ETFs and crypto can be substantial. You may sustain a total loss of the funds that you deposit with your broker. Therefore, you should carefully consider whether such trading is suitable for you in light of your circumstances and financial resources.

          No decision to invest should be made without thoroughly conducting due diligence by yourself or consulting with your financial advisors. Our web content might not suit you since we don't know your financial conditions and investment needs. Our financial information might have latency or contain inaccuracy, so you should be fully responsible for any of your trading and investment decisions. The company will not be responsible for your capital loss.

          Without getting permission from the website, you are not allowed to copy the website's graphics, texts, or trademarks. Intellectual property rights in the content or data incorporated into this website belong to its providers and exchange merchants.

          Not Logged In

          Log in to access more features

          FastBull Membership

          Not yet

          Purchase

          Become a signal provider
          Help Center
          Customer Service
          Dark Mode
          Price Up/Down Colors

          Log In

          Sign Up

          Position
          Layout
          Fullscreen
          Default to Chart
          The chart page opens by default when you visit fastbull.com