• Trade
  • Markets
  • Copy
  • Contests
  • News
  • 24/7
  • Calendar
  • Q&A
  • Chats
Trending
Screeners
SYMBOL
LAST
BID
ASK
HIGH
LOW
NET CHG.
%CHG.
SPREAD
SPX
S&P 500 Index
6820.39
6820.39
6820.39
6861.30
6814.69
-7.02
-0.10%
--
DJI
Dow Jones Industrial Average
48400.77
48400.77
48400.77
48679.14
48375.18
-57.27
-0.12%
--
IXIC
NASDAQ Composite Index
23115.49
23115.49
23115.49
23345.56
23088.52
-79.67
-0.34%
--
USDX
US Dollar Index
97.810
97.890
97.810
98.070
97.750
-0.140
-0.14%
--
EURUSD
Euro / US Dollar
1.17592
1.17599
1.17592
1.17686
1.17262
+0.00198
+ 0.17%
--
GBPUSD
Pound Sterling / US Dollar
1.33869
1.33877
1.33869
1.34014
1.33546
+0.00162
+ 0.12%
--
XAUUSD
Gold / US Dollar
4321.29
4321.70
4321.29
4350.16
4294.68
+21.90
+ 0.51%
--
WTI
Light Sweet Crude Oil
56.756
56.786
56.756
57.601
56.635
-0.477
-0.83%
--

Community Accounts

Signal Accounts
--
Profit Accounts
--
Loss Accounts
--
View More

Become a signal provider

Sell trading signals to earn additional income

View More

Guide to Copy Trading

Get started with ease and confidence

View More

Signal Accounts for Members

All Signal Accounts

Best Return
  • Best Return
  • Best P/L
  • Best MDD
Past 1W
  • Past 1W
  • Past 1M
  • Past 1Y

All Contests

  • All
  • Trump Updates
  • Recommend
  • Stocks
  • Cryptocurrencies
  • Central Banks
  • Featured News
Top News Only
Share

Spot Platinum Rises 3% To $1798.18/Oz

Share

Miran: Do Not Support Sales Of Mortgage-Backed Securities Because It Might At This Point Involve The Fed Realizing Losses On Its Holdings

Share

Miran: Would Prefer An All Treasury Balance Sheet Unless There Is Another Crisis Centered In The Housing Market

Share

Miran: The Standing Repo Facility Is Not As Effective As Fed Hoped It Would Be

Share

Miran: The Renewal Of Treasury Bill Purchases By The Fed Are Not QE, And Will Continue To Transfer Some Risk To Private Markets

Share

USA Attorney General Bondi: Justice Department, Fbi Foils 'Terror Plot' In California's Orange County And Los Angeles

Share

Mexico Central Bank Poll: Private Sector Analysts See End-2026 Exchange Rate At 19.23 Pesos Per USD Versus 19.26 Pesos Per USD In Previous Poll

Share

Mexico Central Bank Poll: Private Sector Analysts See End-2025 Exchange Rate At 18.50 Pesos Per USD Versus 18.70 Pesos Per USD In Previous Poll

Share

Mexico Central Bank Poll: Private Sector Analysts See 2027 Core Inflation At 3.75%

Share

Mexico Central Bank Poll: Private Sector Analysts See 2026 Core Inflation At 3.90% Versus 3.90% In Previous Poll

Share

Mexico Central Bank Poll: Private Sector Analysts See 2025 Core Inflation At 4.24% Versus 4.25% In Previous Poll

Share

French Presidential Residence Elysee: Macron Will Go To Berlin On Monday For Talks On Ukraine

Share

Mexico Central Bank Poll: Private Sector Analysts See 2026 Headline Inflation At 3.88% Versus 3.90% In Previous Poll

Share

Mexico Central Bank Poll: Private Sector Analysts See 2025 Headline Inflation At 3.75% Versus 3.74% In Previous Poll

Share

Ukraine's Sbu Says It Hit Russian Submarine In Novorossiysk

Share

Pap - Poland Had Budget Deficit Of Pln 244.9 Billion At End Nov 2025

Share

All Three Major U.S. Stock Indexes Fell

Share

Ukrainians Told USA Side That Further Discussion Needed, Territorial Question Still Unresolved On Monday, According To Official Familiar With Matter

Share

Official: USA Side Sees Territory As Central Issue For Russians

Share

Miran: Don't See Evidence Of Concern In Inflation Expectations Data

TIME
ACT
FCST
PREV
Japan Tankan Small Manufacturing Outlook Index (Q4)

A:--

F: --

P: --

Japan Tankan Large Non-Manufacturing Outlook Index (Q4)

A:--

F: --

P: --

Japan Tankan Large Manufacturing Outlook Index (Q4)

A:--

F: --

P: --

Japan Tankan Small Manufacturing Diffusion Index (Q4)

A:--

F: --

P: --

Japan Tankan Large-Enterprise Capital Expenditure YoY (Q4)

A:--

F: --

P: --

U.K. Rightmove House Price Index YoY (Dec)

A:--

F: --

P: --

China, Mainland Industrial Output YoY (YTD) (Nov)

A:--

F: --

P: --

China, Mainland Urban Area Unemployment Rate (Nov)

A:--

F: --

P: --

Saudi Arabia CPI YoY (Nov)

A:--

F: --

P: --

Euro Zone Industrial Output YoY (Oct)

A:--

F: --

P: --

Euro Zone Industrial Output MoM (Oct)

A:--

F: --

P: --

Canada Existing Home Sales MoM (Nov)

A:--

F: --

P: --

Canada National Economic Confidence Index

A:--

F: --

P: --

Canada New Housing Starts (Nov)

A:--

F: --

P: --
U.S. NY Fed Manufacturing Employment Index (Dec)

A:--

F: --

P: --

U.S. NY Fed Manufacturing Index (Dec)

A:--

F: --

P: --

Canada Core CPI YoY (Nov)

A:--

F: --

P: --

Canada Manufacturing Unfilled Orders MoM (Oct)

A:--

F: --

P: --

U.S. NY Fed Manufacturing Prices Received Index (Dec)

A:--

F: --

P: --

U.S. NY Fed Manufacturing New Orders Index (Dec)

A:--

F: --

P: --

Canada Manufacturing New Orders MoM (Oct)

A:--

F: --

P: --

Canada Core CPI MoM (Nov)

A:--

F: --

P: --

Canada Trimmed CPI YoY (SA) (Nov)

A:--

F: --

P: --

Canada Manufacturing Inventory MoM (Oct)

A:--

F: --

P: --

Canada CPI YoY (Nov)

A:--

F: --

P: --

Canada CPI MoM (Nov)

A:--

F: --

P: --

Canada CPI YoY (SA) (Nov)

A:--

F: --

P: --

Canada Core CPI MoM (SA) (Nov)

A:--

F: --

P: --

Canada CPI MoM (SA) (Nov)

A:--

F: --

P: --

Federal Reserve Board Governor Milan delivered a speech
U.S. NAHB Housing Market Index (Dec)

A:--

F: --

P: --

Australia Composite PMI Prelim (Dec)

--

F: --

P: --

Australia Services PMI Prelim (Dec)

--

F: --

P: --

Australia Manufacturing PMI Prelim (Dec)

--

F: --

P: --

Japan Manufacturing PMI Prelim (SA) (Dec)

--

F: --

P: --

U.K. 3-Month ILO Employment Change (Oct)

--

F: --

P: --

U.K. Unemployment Claimant Count (Nov)

--

F: --

P: --

U.K. Unemployment Rate (Nov)

--

F: --

P: --

U.K. 3-Month ILO Unemployment Rate (Oct)

--

F: --

P: --

U.K. Average Weekly Earnings (3-Month Average, Including Bonuses) YoY (Oct)

--

F: --

P: --

U.K. Average Weekly Earnings (3-Month Average, Excluding Bonuses) YoY (Oct)

--

F: --

P: --

France Services PMI Prelim (Dec)

--

F: --

P: --

France Composite PMI Prelim (SA) (Dec)

--

F: --

P: --

France Manufacturing PMI Prelim (Dec)

--

F: --

P: --

Germany Services PMI Prelim (SA) (Dec)

--

F: --

P: --

Germany Manufacturing PMI Prelim (SA) (Dec)

--

F: --

P: --

Germany Composite PMI Prelim (SA) (Dec)

--

F: --

P: --

Euro Zone Composite PMI Prelim (SA) (Dec)

--

F: --

P: --

Euro Zone Services PMI Prelim (SA) (Dec)

--

F: --

P: --

Euro Zone Manufacturing PMI Prelim (SA) (Dec)

--

F: --

P: --

U.K. Services PMI Prelim (Dec)

--

F: --

P: --

U.K. Manufacturing PMI Prelim (Dec)

--

F: --

P: --

U.K. Composite PMI Prelim (Dec)

--

F: --

P: --

Euro Zone ZEW Economic Sentiment Index (Dec)

--

F: --

P: --

Germany ZEW Current Conditions Index (Dec)

--

F: --

P: --

Germany ZEW Economic Sentiment Index (Dec)

--

F: --

P: --

Euro Zone Trade Balance (Not SA) (Oct)

--

F: --

P: --

Euro Zone ZEW Current Conditions Index (Dec)

--

F: --

P: --

Euro Zone Trade Balance (SA) (Oct)

--

F: --

P: --

U.S. Retail Sales MoM (Excl. Gas Stations & Vehicle Dealers) (SA) (Oct)

--

F: --

P: --

U.S. Retail Sales MoM (Excl. Automobile) (SA) (Oct)

--

F: --

P: --

Q&A with Experts
    • All
    • Chatrooms
    • Groups
    • Friends
    Connecting
    .
    .
    .
    Type here...
    Add Symbol or Code

      No matching data

      All
      Trump Updates
      Recommend
      Stocks
      Cryptocurrencies
      Central Banks
      Featured News
      • All
      • Russia-Ukraine Conflict
      • Middle East Flashpoint
      • All
      • Russia-Ukraine Conflict
      • Middle East Flashpoint
      Search
      Products

      Charts Free Forever

      Chats Q&A with Experts
      Screeners Economic Calendar Data Tools
      Membership Features
      Data Warehouse Market Trends Institutional Data Policy Rates Macro

      Market Trends

      Market Sentiment Order Book Forex Correlations

      Top Indicators

      Charts Free Forever
      Markets

      News

      News Analysis 24/7 Columns Education
      From Institutions From Analysts
      Topics Columnists

      Latest Views

      Latest Views

      Trending Topics

      Top Columnists

      Latest Update

      Signals

      Copy Rankings Latest Signals Become a signal provider AI Rating
      Contests
      Brokers

      Overview Brokers Assessment Rankings Regulators News Claims
      Broker listing Forex Brokers Comparison Tool Live Spread Comparison Scam
      Q&A Complaint Scam Alert Videos Tips to Detect Scam
      More

      Business
      Events
      Careers About Us Advertising Help Center

      White Label

      Data API

      Web Plug-ins

      Affiliate Program

      Awards Institution Evaluation IB Seminar Salon Event Exhibition
      Vietnam Thailand Singapore Dubai
      Fans Party Investment Sharing Session
      FastBull Summit BrokersView Expo
      Recent Searches
        Top Searches
          Markets
          News
          Analysis
          User
          24/7
          Economic Calendar
          Education
          Data
          • Names
          • Latest
          • Prev

          View All

          No data

          Scan to Download

          Faster Charts, Chat Faster!

          Download App
          English
          • English
          • Español
          • العربية
          • Bahasa Indonesia
          • Bahasa Melayu
          • Tiếng Việt
          • ภาษาไทย
          • Français
          • Italiano
          • Türkçe
          • Русский язык
          • 简中
          • 繁中
          Open Account
          Search
          Products
          Charts Free Forever
          Markets
          News
          Signals

          Copy Rankings Latest Signals Become a signal provider AI Rating
          Contests
          Brokers

          Overview Brokers Assessment Rankings Regulators News Claims
          Broker listing Forex Brokers Comparison Tool Live Spread Comparison Scam
          Q&A Complaint Scam Alert Videos Tips to Detect Scam
          More

          Business
          Events
          Careers About Us Advertising Help Center

          White Label

          Data API

          Web Plug-ins

          Affiliate Program

          Awards Institution Evaluation IB Seminar Salon Event Exhibition
          Vietnam Thailand Singapore Dubai
          Fans Party Investment Sharing Session
          FastBull Summit BrokersView Expo

          QuinStreet (QNST) Stock Trades Up, Here Is Why

          StockStory
          QuinStreet
          +1.66%

          What Happened?

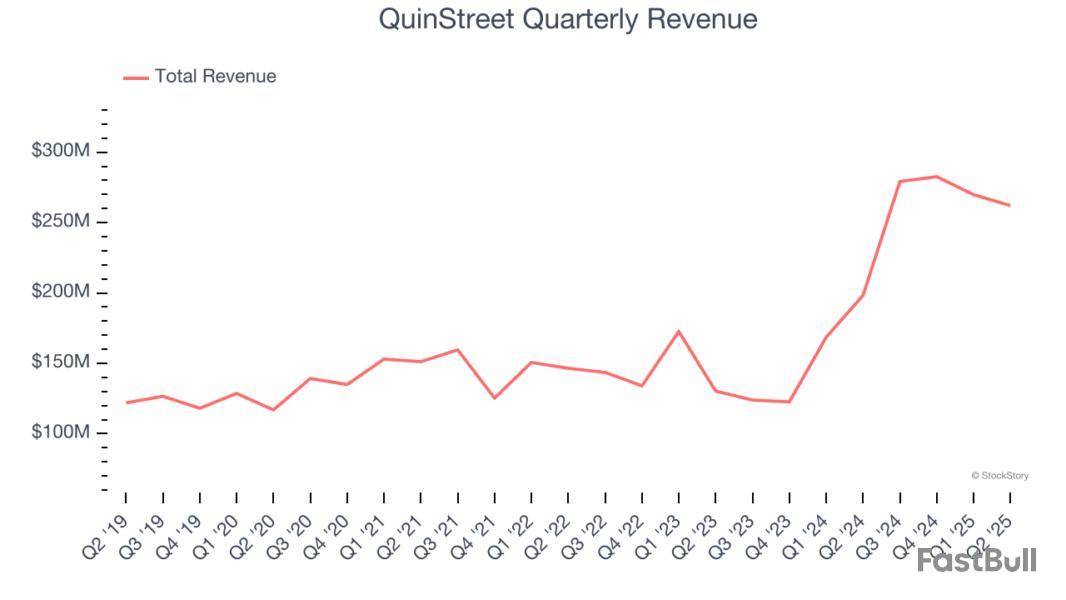
          Shares of performance marketing company QuinStreet (NASDAQ:QNST) jumped 3% in the afternoon session after Federal Reserve Chair Jerome Powell indicated that interest rates could be cut. The positive sentiment swept across Wall Street, lifting major indices like the Dow Jones Industrial Average, S&P 500, and the tech-heavy Nasdaq. Powell's comments eased investor concerns about prolonged high borrowing costs. Lower interest rates can stimulate economic growth by making it cheaper for companies and consumers to borrow, which often translates to higher corporate profits and stock valuations. The widespread rally suggests investors are optimistic that a less restrictive monetary policy from the central bank is on the horizon.

          After the initial pop the shares cooled down to $15.45, up 2.6% from previous close.

          Is now the time to buy QuinStreet? Access our full analysis report here, it’s free.

          What Is The Market Telling Us

          QuinStreet’s shares are very volatile and have had 22 moves greater than 5% over the last year. In that context, today’s move indicates the market considers this news meaningful but not something that would fundamentally change its perception of the business.

          The previous big move we wrote about was 1 day ago when the stock dropped 3.8% on the news that markets continued to decline, as investors grew cautious ahead of a key speech by Federal Reserve Chair Jerome Powell. The move came as U.S. equity markets recorded a fifth consecutive day of losses for major indexes like the S&P 500, with technology stocks experiencing the largest declines. Investors have grown wary that the sharp rally in the tech sector since April may have advanced too far. The market-wide caution is largely driven by the upcoming Jackson Hole symposium, a meeting of central bankers, where traders are anxiously awaiting Fed Chair Powell's speech on Friday for guidance on the future path of interest rates.

          QuinStreet is down 33.8% since the beginning of the year, and at $15.45 per share, it is trading 38.6% below its 52-week high of $25.17 from February 2025. Investors who bought $1,000 worth of QuinStreet’s shares 5 years ago would now be looking at an investment worth $1,161.

          Today’s young investors likely haven’t read the timeless lessons in Gorilla Game: Picking Winners In High Technology because it was written more than 20 years ago when Microsoft and Apple were first establishing their supremacy. But if we apply the same principles, then enterprise software stocks leveraging their own generative AI capabilities may well be the Gorillas of the future. So, in that spirit, we are excited to present our Special Free Report on a profitable, fast-growing enterprise software stock that is already riding the automation wave and looking to catch the generative AI next.

          Risk Warnings and Disclaimers
          You understand and acknowledge that there is a high degree of risk involved in trading. Following any strategies or investment methods may lead to potential losses. The content on the site is provided by our contributors and analysts for information purposes only. You are solely responsible for determining whether any trading assets, securities, strategy, or any other product is suitable for investing based on your own investment objectives and financial situation.
          Add to Favorites
          Share

          OSI Systems, QuidelOrtho, QuinStreet, Xerox, and Piper Sandler Stocks Trade Down, What You Need To Know

          Stock Story
          OSI Systems
          +0.43%
          QuidelOrtho
          -0.54%
          QuinStreet
          +1.66%
          Xerox
          -1.49%
          Piper Sandler
          -0.06%

          OSIS Cover Image

          What Happened?

          A number of stocks fell in the afternoon session after markets continued to decline, as investors grew cautious ahead of a key speech by Federal Reserve Chair Jerome Powell. The move came as U.S. equity markets recorded a fifth consecutive day of losses for major indexes like the S&P 500, with technology stocks experiencing the largest declines. Investors have grown wary that the sharp rally in the tech sector since April may have advanced too far. The market-wide caution is largely driven by the upcoming Jackson Hole symposium, a meeting of central bankers, where traders are anxiously awaiting Fed Chair Powell's speech on Friday for guidance on the future path of interest rates.

          The stock market overreacts to news, and big price drops can present good opportunities to buy high-quality stocks.

          Among others, the following stocks were impacted:

          • Specialized Technology company OSI Systems fell 6%. Is now the time to buy OSI Systems? Access our full analysis report here, it’s free.
          • Medical Devices & Supplies - Imaging, Diagnostics company QuidelOrtho fell 3.4%. Is now the time to buy QuidelOrtho? Access our full analysis report here, it’s free.
          • Advertising & Marketing Services company QuinStreet fell 3.8%. Is now the time to buy QuinStreet? Access our full analysis report here, it’s free.
          • Hardware & Infrastructure company Xerox fell 3.3%. Is now the time to buy Xerox? Access our full analysis report here, it’s free.
          • Investment Banking & Brokerage company Piper Sandler fell 5%. Is now the time to buy Piper Sandler? Access our full analysis report here, it’s free.

          Zooming In On OSI Systems (OSIS)

          OSI Systems’s shares are somewhat volatile and have had 13 moves greater than 5% over the last year. In that context, today’s move indicates the market considers this news meaningful but not something that would fundamentally change its perception of the business.

          The previous big move we wrote about was 9 days ago when the stock gained 3.6% on the news that a key inflation report met expectations, bolstering hopes for a Federal Reserve interest rate cut, while a separate report indicated rising optimism among small businesses.

          The July Consumer Price Index (CPI) report showed annual inflation holding steady at 2.7%, aligning with forecasts and increasing the probability of a Federal Reserve interest rate cut to over 94%. Lower interest rates can stimulate the economy by making it cheaper for businesses to borrow and invest. Further boosting confidence, the National Federation of Independent Business (NFIB) Small Business Optimism Index rose to a five-month high. This is a crucial indicator for the Business Services sector, as many of its companies cater to small and medium-sized enterprises. The combined positive data fueled a broad, "risk-on" sentiment, where investors favor economically sensitive sectors, leading to gains across IT services, staffing, and manufacturing.

          OSI Systems is up 27.1% since the beginning of the year, but at $210.19 per share, it is still trading 12.1% below its 52-week high of $239.05 from June 2025. Investors who bought $1,000 worth of OSI Systems’s shares 5 years ago would now be looking at an investment worth $2,802.

          Today’s young investors won’t have read the timeless lessons in Gorilla Game: Picking Winners In High Technology because it was written more than 20 years ago when Microsoft and Apple were first establishing their supremacy. But if we apply the same principles, then enterprise software stocks leveraging their own generative AI capabilities may well be the Gorillas of the future. So, in that spirit, we are excited to present our Special Free Report on a profitable, fast-growing enterprise software stock that is already riding the automation wave and looking to catch the generative AI next.

          Risk Warnings and Disclaimers
          You understand and acknowledge that there is a high degree of risk involved in trading. Following any strategies or investment methods may lead to potential losses. The content on the site is provided by our contributors and analysts for information purposes only. You are solely responsible for determining whether any trading assets, securities, strategy, or any other product is suitable for investing based on your own investment objectives and financial situation.
          Add to Favorites
          Share

          Dj Quinstreet Inc, Inst Holders, 2Q 2025 (Qnst)

          Reuters
          QuinStreet
          +1.66%
          Risk Warnings and Disclaimers
          You understand and acknowledge that there is a high degree of risk involved in trading. Following any strategies or investment methods may lead to potential losses. The content on the site is provided by our contributors and analysts for information purposes only. You are solely responsible for determining whether any trading assets, securities, strategy, or any other product is suitable for investing based on your own investment objectives and financial situation.
          Add to Favorites
          Share

          3 Reasons Investors Love QuinStreet (QNST)

          Stock Story
          QuinStreet
          +1.66%

          QNST Cover Image

          What a brutal six months it’s been for QuinStreet. The stock has dropped 24.8% and now trades at $15.13, rattling many shareholders. This may have investors wondering how to approach the situation.

          Following the pullback, is now the time to buy QNST? Find out in our full research report, it’s free.

          Why Are We Positive On QNST?

          Founded during the dot-com era in 1999 and specializing in high-intent consumer traffic, QuinStreet operates digital performance marketplaces that connect clients in financial and home services with consumers actively searching for their products.

          1. Skyrocketing Revenue Shows Strong Momentum

          A company’s long-term performance is an indicator of its overall quality. Any business can put up a good quarter or two, but the best consistently grow over the long haul. Over the last five years, QuinStreet grew its sales at an incredible 17.4% compounded annual growth rate. Its growth surpassed the average business services company and shows its offerings resonate with customers.

          QuinStreet Quarterly Revenue

          2. Wall Street Expects Impressive Revenue Gains

          Forecasted revenues by Wall Street analysts signal a company’s potential. Predictions may not always be accurate, but accelerating growth typically boosts valuation multiples and stock prices while slowing growth does the opposite, though some deceleration is natural as businesses become larger.

          Over the next 12 months, sell-side analysts expect QuinStreet’s revenue to rise by 7.5%. While this projection is below its 37.2% annualized growth rate for the past two years, it is healthy and suggests the market is baking in success for its products and services.

          3. Outstanding Long-Term EPS Growth

          We track the long-term change in earnings per share (EPS) because it highlights whether a company’s growth is profitable.

          QuinStreet’s EPS grew at a remarkable 11.5% compounded annual growth rate over the last five years. This performance was better than most business services businesses.

          QuinStreet Trailing 12-Month EPS (Non-GAAP)

          Final Judgment

          These are just a few reasons why we think QuinStreet is a great business. After the recent drawdown, the stock trades at 14.3× forward P/E (or $15.13 per share). Is now the time to initiate a position? See for yourself in our full research report, it’s free.

          High-Quality Stocks for All Market Conditions

          When Trump unveiled his aggressive tariff plan in April 2025, markets tanked as investors feared a full-blown trade war. But those who panicked and sold missed the subsequent rebound that’s already erased most losses.

          Don’t let fear keep you from great opportunities and take a look at Top 6 Stocks for this week. This is a curated list of our High Quality stocks that have generated a market-beating return of 183% over the last five years (as of March 31st 2025).

          Stocks that made our list in 2020 include now familiar names such as Nvidia (+1,545% between March 2020 and March 2025) as well as under-the-radar businesses like the once-small-cap company Exlservice (+354% five-year return).

          StockStory is growing and hiring equity analyst and marketing roles. Are you a 0 to 1 builder passionate about the markets and AI? See the open roles here.

          Risk Warnings and Disclaimers
          You understand and acknowledge that there is a high degree of risk involved in trading. Following any strategies or investment methods may lead to potential losses. The content on the site is provided by our contributors and analysts for information purposes only. You are solely responsible for determining whether any trading assets, securities, strategy, or any other product is suitable for investing based on your own investment objectives and financial situation.
          Add to Favorites
          Share

          Winners And Losers Of Q2: Omnicom Group (NYSE:OMC) Vs The Rest Of The Advertising & Marketing Services Stocks

          Stock Story
          Omnicom Group
          +0.07%
          Liberty Broadband-A
          +0.06%
          Liberty Broadband-C
          -0.38%
          Liberty Broadband Corporation Series A Cumulative Redeemable Preferred Stock
          +0.29%
          Ibotta
          -0.98%

          OMC Cover Image

          Earnings results often indicate what direction a company will take in the months ahead. With Q2 behind us, let’s have a look at Omnicom Group and its peers.

          The sector is on the precipice of both disruption and growth as AI, programmatic advertising, and data-driven marketing reshape how things are done. For example, the advent of the Internet broadly and programmatic advertising specifically means that brand building is not a relationship business anymore but instead one based on data and technology, which could hurt traditional ad agencies. On the other hand, the companies in the sector that beef up their tech chops by automating the buying of ad inventory or facilitating omnichannel marketing, for example, stand to benefit. With or without advances in digitization and AI, the sector is still highly levered to the macro, and economic uncertainty may lead to fluctuating ad spend, particularly in cyclical industries.

          The 7 advertising & marketing services stocks we track reported a satisfactory Q2. As a group, revenues along with next quarter’s revenue guidance were in line with analysts’ consensus estimates.

          In light of this news, share prices of the companies have held steady. On average, they are relatively unchanged since the latest earnings results.

          Omnicom Group

          With a vast network of creative agencies that helped craft some of the most memorable ad campaigns in history, Omnicom Group is a strategic holding company that provides advertising, marketing, and communications services to many of the world's largest companies.

          Omnicom Group reported revenues of $4.02 billion, up 4.2% year on year. This print exceeded analysts’ expectations by 1.2%. Overall, it was a satisfactory quarter for the company with organic revenue in line with analysts’ estimates.

          "We delivered solid 3.0% organic revenue growth this quarter even in the face of ongoing macroeconomic and geopolitical uncertainty - underscoring once again the resilience and agility of our business," said John Wren, Chairman and Chief Executive Officer of Omnicom.

          Omnicom Group Total Revenue

          Interestingly, the stock is up 7.6% since reporting and currently trades at $76.16.

          Is now the time to buy Omnicom Group? Access our full analysis of the earnings results here, it’s free.

          Best Q2: Liberty Broadband

          Operating across the United States, Liberty Broadband is a provider of high-speed internet, cable television, and telecommunications services across various markets.

          Liberty Broadband reported revenues of $261 million, up 6.1% year on year, outperforming analysts’ expectations by 3.7%. The business had an exceptional quarter.

          Liberty Broadband Total Revenue

          Liberty Broadband pulled off the biggest analyst estimates beat among its peers. The market seems content with the results as the stock is up 3.1% since reporting. It currently trades at $61.38.

          Is now the time to buy Liberty Broadband? Access our full analysis of the earnings results here, it’s free.

          Weakest Q2: Ibotta

          Originally launched as a way to make grocery shopping more rewarding for budget-conscious consumers, Ibotta is a mobile shopping app that allows consumers to earn cash back on everyday purchases by completing tasks and submitting receipts.

          Ibotta reported revenues of $86.03 million, down 2.2% year on year, falling short of analysts’ expectations by 5%. It was a softer quarter as it posted a significant miss of analysts’ EPS estimates.

          Ibotta delivered the weakest performance against analyst estimates in the group. As expected, the stock is down 23.3% since the results and currently trades at $26.12.

          Read our full analysis of Ibotta’s results here.

          Taboola

          Often appearing as those "You May Also Like" or "Recommended For You" boxes at the bottom of news articles, Taboola operates a digital platform that recommends personalized content to users across publisher websites, helping both publishers monetize their sites and advertisers reach target audiences.

          Taboola reported revenues of $465.5 million, up 8.7% year on year. This print topped analysts’ expectations by 3.6%. It was a strong quarter as it also recorded a beat of analysts’ EPS estimates and full-year revenue guidance slightly topping analysts’ expectations.

          The stock is up 3.9% since reporting and currently trades at $3.33.

          Read our full, actionable report on Taboola here, it’s free.

          QuinStreet

          Founded during the dot-com era in 1999 and specializing in high-intent consumer traffic, QuinStreet operates digital performance marketplaces that connect clients in financial and home services with consumers actively searching for their products.

          QuinStreet reported revenues of $262.1 million, up 32.1% year on year. This number surpassed analysts’ expectations by 0.7%. Taking a step back, it was a mixed quarter as it underperformed in some other aspects of the business.

          QuinStreet achieved the fastest revenue growth among its peers. The stock is down 7.7% since reporting and currently trades at $14.95.

          Read our full, actionable report on QuinStreet here, it’s free.

          Market Update

          In response to the Fed’s rate hikes in 2022 and 2023, inflation has been gradually trending down from its post-pandemic peak, trending closer to the Fed’s 2% target. Despite higher borrowing costs, the economy has avoided flashing recessionary signals. This is the much-desired soft landing that many investors hoped for. The recent rate cuts (0.5% in September and 0.25% in November 2024) have bolstered the stock market, making 2024 a strong year for equities. Donald Trump’s presidential win in November sparked additional market gains, sending indices to record highs in the days following his victory. However, debates continue over possible tariffs and corporate tax adjustments, raising questions about economic stability in 2025.

          Risk Warnings and Disclaimers
          You understand and acknowledge that there is a high degree of risk involved in trading. Following any strategies or investment methods may lead to potential losses. The content on the site is provided by our contributors and analysts for information purposes only. You are solely responsible for determining whether any trading assets, securities, strategy, or any other product is suitable for investing based on your own investment objectives and financial situation.
          Add to Favorites
          Share

          1 Services Stock with Impressive Fundamentals and 2 Facing Headwinds

          Stock Story
          ABM Industries
          -0.11%
          CDW Corp.
          -0.95%
          QuinStreet
          +1.66%

          ABM Cover Image

          Business services providers use their specialized expertise to help enterprises streamline operations and cut costs. But increasing competition from AI-driven upstarts has tempered enthusiasm, and over the past six months, the industry has pulled back by 4.1%. This performance was discouraging since the S&P 500 returned 5.2%.

          Only some companies are subject to these dynamics, however, and a handful of high-quality businesses can deliver earnings growth in any environment. With that said, here is one services stock poised to generate sustainable market-beating returns and two best left ignored.

          Two Business Services Stocks to Sell:

          ABM (ABM)

          Market Cap: $3.00 billion

          With roots dating back to 1909 as a window washing company, ABM Industries provides integrated facility management, infrastructure, and mobility solutions across various sectors including commercial, manufacturing, education, and aviation.

          Why Should You Sell ABM?

          • Organic sales performance over the past two years indicates the company may need to make strategic adjustments or rely on M&A to catalyze faster growth
          • Incremental sales over the last two years were less profitable as its earnings per share were flat while its revenue grew
          • Capital intensity has ramped up over the last five years as its free cash flow margin decreased by 8.3 percentage points

          At $48.14 per share, ABM trades at 12.4x forward P/E. To fully understand why you should be careful with ABM, check out our full research report (it’s free).

          CDW (CDW)

          Market Cap: $21.46 billion

          Serving as a crucial bridge between technology manufacturers and end users since 1984, CDW is a multi-brand provider of information technology solutions that helps businesses and public sector organizations select, implement, and manage hardware, software, and IT services.

          Why Is CDW Risky?

          • Annual sales declines of 1.1% for the past two years show its products and services struggled to connect with the market during this cycle
          • Demand will likely be soft over the next 12 months as Wall Street’s estimates imply tepid growth of 1.9%
          • Flat earnings per share over the last two years underperformed the sector average

          CDW is trading at $163.49 per share, or 16.4x forward P/E. Check out our free in-depth research report to learn more about why CDW doesn’t pass our bar.

          One Business Services Stock to Buy:

          QuinStreet (QNST)

          Market Cap: $839.5 million

          Founded during the dot-com era in 1999 and specializing in high-intent consumer traffic, QuinStreet operates digital performance marketplaces that connect clients in financial and home services with consumers actively searching for their products.

          Why Will QNST Outperform?

          • Market share has increased this cycle as its 37.2% annual revenue growth over the last two years was exceptional
          • Projected revenue growth of 7.5% for the next 12 months suggests its momentum from the last two years will persist
          • Earnings growth has massively outpaced its peers over the last two years as its EPS has compounded at 160% annually

          QuinStreet’s stock price of $14.74 implies a valuation ratio of 13.9x forward P/E. Is now the time to initiate a position? Find out in our full research report, it’s free.

          Stocks We Like Even More

          Trump’s April 2025 tariff bombshell triggered a massive market selloff, but stocks have since staged an impressive recovery, leaving those who panic sold on the sidelines.

          Take advantage of the rebound by checking out our Top 5 Growth Stocks for this month. This is a curated list of our High Quality stocks that have generated a market-beating return of 183% over the last five years (as of March 31st 2025).

          Stocks that made our list in 2020 include now familiar names such as Nvidia (+1,545% between March 2020 and March 2025) as well as under-the-radar businesses like the once-small-cap company Comfort Systems (+782% five-year return).

          StockStory is growing and hiring equity analyst and marketing roles. Are you a 0 to 1 builder passionate about the markets and AI? See the open roles here.

          Risk Warnings and Disclaimers
          You understand and acknowledge that there is a high degree of risk involved in trading. Following any strategies or investment methods may lead to potential losses. The content on the site is provided by our contributors and analysts for information purposes only. You are solely responsible for determining whether any trading assets, securities, strategy, or any other product is suitable for investing based on your own investment objectives and financial situation.
          Add to Favorites
          Share

          2 Volatile Stocks for Long-Term Investors and 1 That Underwhelm

          Stock Story
          nCino
          -2.75%
          FTAI Infrastructure
          -1.95%
          QuinStreet
          +1.66%

          NCNO Cover Image

          Volatility cuts both ways - while it creates opportunities, it also increases risk, making sharp declines just as likely as big gains. This unpredictability can shake out even the most experienced investors.

          At StockStory, our job is to help you avoid costly mistakes and stay on the right side of the trade. Keeping that in mind, here are two volatile stocks that could deliver huge gains and one that could just as easily collapse.

          One Stock to Sell:

          nCino (NCNO)

          Rolling One-Year Beta: 1.36

          Founded in 2011 in North Carolina, nCino makes cloud-based operating systems for banks and provides that software-as-a-service.

          Why Does NCNO Worry Us?

          • Estimated sales growth of 5.9% for the next 12 months implies demand will slow from its three-year trend
          • Gross margin of 60.1% is below its competitors, leaving less money to invest in areas like marketing and R&D
          • Suboptimal cost structure is highlighted by its history of operating margin losses

          At $28.50 per share, nCino trades at 5.6x forward price-to-sales. Dive into our free research report to see why there are better opportunities than NCNO.

          Two Stocks to Watch:

          FTAI Infrastructure (FIP)

          Rolling One-Year Beta: 1.76

          Spun off from FTAI Aviation in 2021, FTAI Infrastructure invests in and operates infrastructure and related assets across the transportation and energy sectors.

          Why Are We Fans of FIP?

          • Annual revenue growth of 57.1% over the last four years was superb and indicates its market share increased during this cycle
          • Market share is on track to rise over the next 12 months as its 69.2% projected revenue growth implies demand will accelerate from its two-year trend

          FTAI Infrastructure’s stock price of $4.95 implies a valuation ratio of 1.8x forward EV-to-EBITDA. Is now the time to initiate a position? Find out in our full research report, it’s free.

          QuinStreet (QNST)

          Rolling One-Year Beta: 1.36

          Founded during the dot-com era in 1999 and specializing in high-intent consumer traffic, QuinStreet operates digital performance marketplaces that connect clients in financial and home services with consumers actively searching for their products.

          Why Are We Bullish on QNST?

          • Annual revenue growth of 37.2% over the past two years was outstanding, reflecting market share gains this cycle
          • Forecasted revenue growth of 7.5% for the next 12 months indicates its momentum over the last two years is sustainable
          • Earnings growth has trumped its peers over the last two years as its EPS has compounded at 160% annually

          QuinStreet is trading at $15.32 per share, or 14.4x forward P/E. Is now the right time to buy? See for yourself in our comprehensive research report, it’s free.

          Stocks We Like Even More

          Donald Trump’s April 2025 "Liberation Day" tariffs sent markets into a tailspin, but stocks have since rebounded strongly, proving that knee-jerk reactions often create the best buying opportunities.

          The smart money is already positioning for the next leg up. Don’t miss out on the recovery - check out our Top 6 Stocks for this week. This is a curated list of our High Quality stocks that have generated a market-beating return of 183% over the last five years (as of March 31st 2025).

          Stocks that made our list in 2020 include now familiar names such as Nvidia (+1,545% between March 2020 and March 2025) as well as under-the-radar businesses like the once-micro-cap company Kadant (+351% five-year return).

          StockStory is growing and hiring equity analyst and marketing roles. Are you a 0 to 1 builder passionate about the markets and AI? See the open roles here.

          Risk Warnings and Disclaimers
          You understand and acknowledge that there is a high degree of risk involved in trading. Following any strategies or investment methods may lead to potential losses. The content on the site is provided by our contributors and analysts for information purposes only. You are solely responsible for determining whether any trading assets, securities, strategy, or any other product is suitable for investing based on your own investment objectives and financial situation.
          Add to Favorites
          Share
          FastBull
          Copyright © 2025 FastBull Ltd

          728 RM B 7/F GEE LOK IND BLDG NO 34 HUNG TO RD KWUN TONG KLN HONG KONG

          TelegramInstagramTwitterfacebooklinkedin
          App Store Google Play Google Play
          Products
          Charts

          Chats

          Q&A with Experts
          Screeners
          Economic Calendar
          Data
          Tools
          Membership
          Features
          Function
          Markets
          Copy Trading
          Latest Signals
          Contests
          News
          Analysis
          24/7
          Columns
          Education
          Company
          Careers
          About Us
          Contact Us
          Advertising
          Help Center
          Feedback
          User Agreement
          Privacy Policy
          Business

          White Label

          Data API

          Web Plug-ins

          Poster Maker

          Affiliate Program

          Risk Disclosure

          The risk of loss in trading financial instruments such as stocks, FX, commodities, futures, bonds, ETFs and crypto can be substantial. You may sustain a total loss of the funds that you deposit with your broker. Therefore, you should carefully consider whether such trading is suitable for you in light of your circumstances and financial resources.

          No decision to invest should be made without thoroughly conducting due diligence by yourself or consulting with your financial advisors. Our web content might not suit you since we don't know your financial conditions and investment needs. Our financial information might have latency or contain inaccuracy, so you should be fully responsible for any of your trading and investment decisions. The company will not be responsible for your capital loss.

          Without getting permission from the website, you are not allowed to copy the website's graphics, texts, or trademarks. Intellectual property rights in the content or data incorporated into this website belong to its providers and exchange merchants.

          Not Logged In

          Log in to access more features

          FastBull Membership

          Not yet

          Purchase

          Become a signal provider
          Help Center
          Customer Service
          Dark Mode
          Price Up/Down Colors

          Log In

          Sign Up

          Position
          Layout
          Fullscreen
          Default to Chart
          The chart page opens by default when you visit fastbull.com