

Markets
News
Analysis
User
24/7
Economic Calendar
Education
Data
- Names
- Latest
- Prev


Signal Accounts for Members
All Signal Accounts
All Contests
[Israel Raises Three Hardline Demands On US-Iran Talks] It Was Learned On The Evening Of February 2nd Local Time That Israel Will Raise Three Hardline Demands Regarding Iran During Its Meeting With US Presidential Envoy Witkov On February 3rd. These Demands Stipulate That In Any Potential Agreement Between The US And Iran, Iran Must Agree To The Following Three "red Lines": No Nuclear Program; No Ballistic Missile Program; And No Support For Armed "proxies," Including So-called "terrorist Organizations" That Threaten Israel. In Addition To Israeli Prime Minister Netanyahu, Mossad Director Barnea And Chief Of The General Staff Zamir Will Also Attend The Meeting With Witkov. It Is Understood That Israel Still Believes That "overthrowing The Iranian Regime Through Military Action Is 'possible'."
[Britain Imposes New Sanctions On Iran] British Foreign Secretary Yvette Cooper Announced On The 2nd That Britain Is Imposing A New Round Of Sanctions On Iran, Targeting Iranian Law Enforcement And 10 Individuals, Including Home Minister Eskander Mhomeini
On Monday (February 2), At The Close Of Trading In New York (05:59 Beijing Time On Tuesday), The Offshore Yuan (CNH) Was Quoted At 6.9426 Against The US Dollar, Up 158 Points From The Close Of Trading In New York On Friday. The Yuan Traded In The Range Of 6.9630-6.9380 During The Day
The Philadelphia Gold And Silver Index Closed Down 0.40% At 380.81 Points. The NYSE Arca Gold Miners Index Fell 1.62% To 2699.52 Points, After A Sharp Rise Followed By A Fall In Early Trading. The Materials Index Closed Up 0.58%, And The Metals & Mining Index Closed Up 1.44%
On Monday (February 2nd) In Late New York Trading, Spot Silver Fell 6.73% To $79.4438 Per Ounce. Comex Silver Futures Rose 1.56% To $79.760 Per Ounce. Comex Copper Futures Fell 1.49% To $5.8345 Per Pound, Having Fallen As Low As $5.5640 At 14:40 Beijing Time. Spot Platinum Fell 2.93%, While Spot Palladium Rose 0.74%
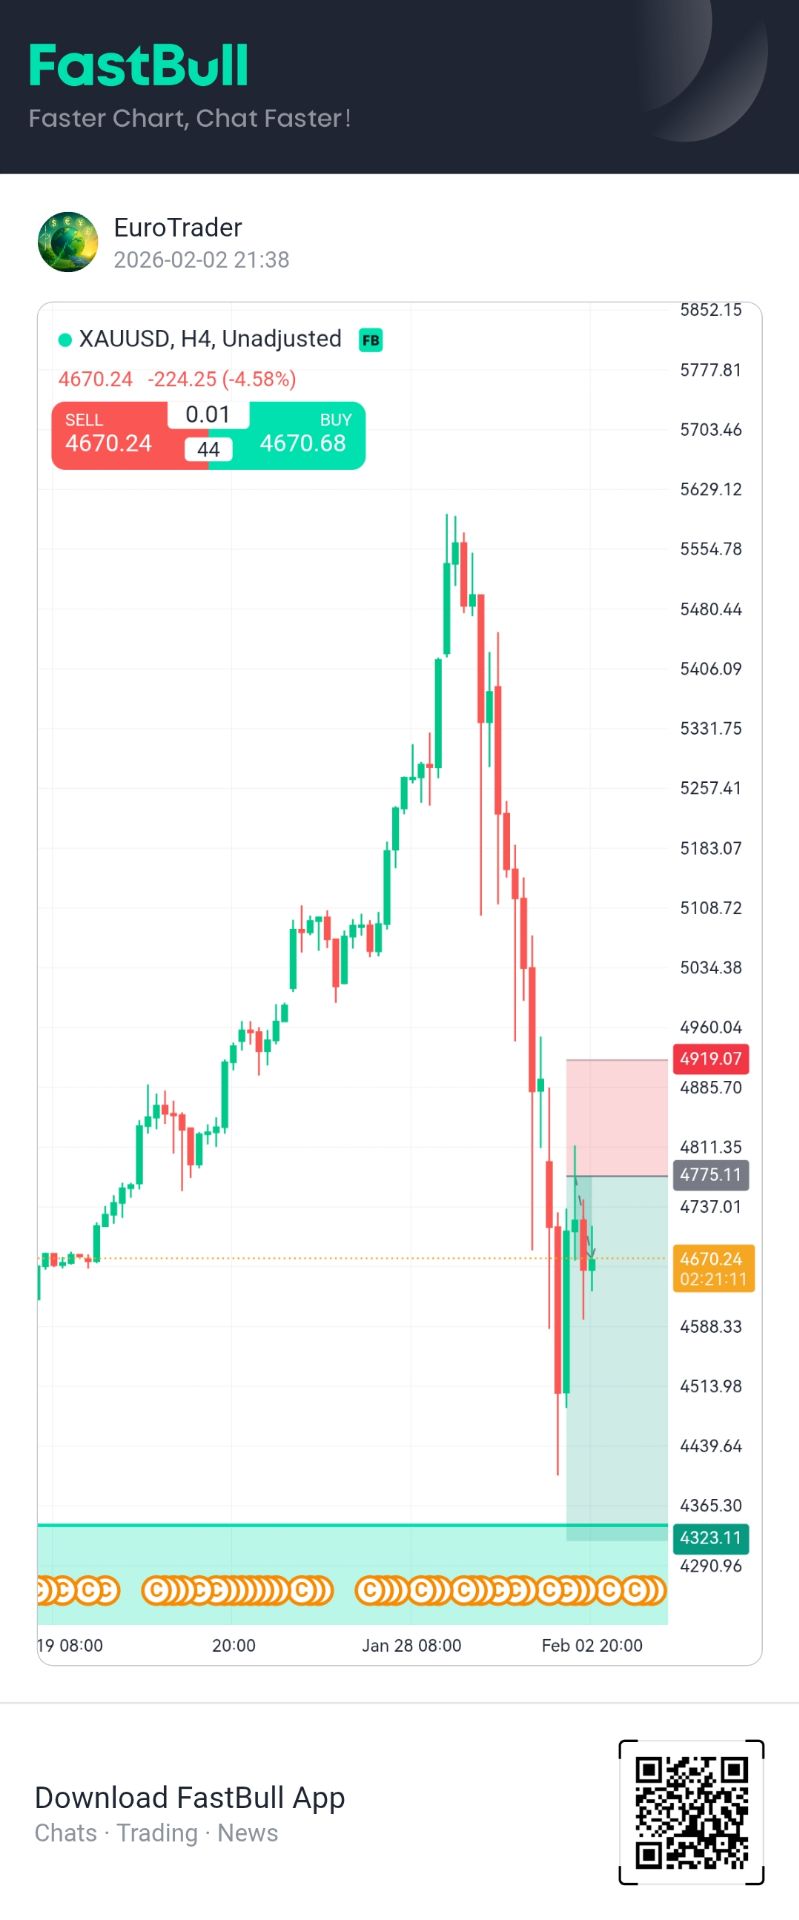
On Monday (February 2nd) In Late New York Trading, Spot Gold Fell 4.54% To $4671.58 Per Ounce, Remaining In A Downward Trend Throughout The Day. At 14:38 Beijing Time, It Had Fallen To $4402.95. On The Daily Chart, Gold Prices Have Fallen For Three Consecutive Trading Days, Approaching The December 31st Low Of $4319.37, And Briefly Breaking Below The 50-day Moving Average And Approaching The 100-day Moving Average (currently At $4483.43 And $4228.16 Respectively). Comex Gold Futures Fell 0.90% To $4702.60 Per Ounce, Also Briefly Falling To $4423.20 At 14:38
US President Trump, Speaking About The Justice Department's Investigation Into The Federal Reserve, Declared: "We'll See How It Goes."
U.S. Treasury Secretary Bessant: Federal Reserve Chairman Nominee Warsh Will Have A Great Start
 China, Mainland NBS Non-manufacturing PMI (Jan)
A:--
F: --
P: --
 South Korea Trade Balance Prelim (Jan)
A:--
F: --
 Japan Manufacturing PMI Final (Jan)
A:--
F: --
P: --
South Korea IHS Markit Manufacturing PMI (SA) (Jan)A:--
F: --
P: --
 Indonesia IHS Markit Manufacturing PMI (Jan)
A:--
F: --
P: --
China, Mainland Caixin Manufacturing PMI (SA) (Jan)A:--
F: --
P: --
Indonesia Trade Balance (Dec)A:--
F: --
P: --
Indonesia Inflation Rate YoY (Jan)A:--
F: --
P: --
Indonesia Core Inflation YoY (Jan)A:--
F: --
P: --
 India HSBC Manufacturing PMI Final (Jan)
A:--
F: --
P: --
 Australia Commodity Price YoY (Jan)
A:--
F: --
P: --
 Russia IHS Markit Manufacturing PMI (Jan)
A:--
F: --
P: --
 Turkey Manufacturing PMI (Jan)
A:--
F: --
P: --
 U.K. Nationwide House Price Index MoM (Jan)
A:--
F: --
P: --
U.K. Nationwide House Price Index YoY (Jan)A:--
F: --
P: --
 Germany Actual Retail Sales MoM (Dec)
A:--
F: --
 Italy Manufacturing PMI (SA) (Jan)
A:--
F: --
P: --
 South Africa Manufacturing PMI (Jan)
A:--
F: --
P: --
 Euro Zone Manufacturing PMI Final (Jan)
A:--
F: --
P: --
U.K. Manufacturing PMI Final (Jan)A:--
F: --
P: --
Turkey Trade Balance (Jan)A:--
F: --
P: --
 Brazil IHS Markit Manufacturing PMI (Jan)
A:--
F: --
P: --
 Canada National Economic Confidence Index
A:--
F: --
P: --
Canada Manufacturing PMI (SA) (Jan)A:--
F: --
P: --
 U.S. IHS Markit Manufacturing PMI Final (Jan)
A:--
F: --
P: --
U.S. ISM Output Index (Jan)A:--
F: --
P: --
U.S. ISM Inventories Index (Jan)A:--
F: --
P: --
U.S. ISM Manufacturing Employment Index (Jan)A:--
F: --
P: --
U.S. ISM Manufacturing New Orders Index (Jan)A:--
F: --
P: --
U.S. ISM Manufacturing PMI (Jan)A:--
F: --
P: --
South Korea CPI YoY (Jan)--
F: --
P: --
Japan Monetary Base YoY (SA) (Jan)--
F: --
P: --
Australia Building Approval Total YoY (Dec)--
F: --
P: --
Australia Building Permits MoM (SA) (Dec)--
F: --
P: --
Australia Building Permits YoY (SA) (Dec)--
F: --
P: --
Australia Private Building Permits MoM (SA) (Dec)--
F: --
P: --
Australia Overnight (Borrowing) Key Rate--
F: --
P: --
RBA Rate Statement Japan 10-Year Note Auction Yield--
F: --
P: --
 Saudi Arabia IHS Markit Composite PMI (Jan)
--
F: --
P: --
RBA Press Conference Turkey PPI YoY (Jan)--
F: --
P: --
Turkey CPI YoY (Jan)--
F: --
P: --
Turkey CPI YoY (Excl. Energy, Food, Beverage, Tobacco & Gold) (Jan)--
F: --
P: --
U.S. Weekly Redbook Index YoY--
F: --
P: --
U.S. JOLTS Job Openings (SA) (Dec)--
F: --
P: --
 Mexico Manufacturing PMI (Jan)
--
F: --
P: --
U.S. API Weekly Refined Oil Stocks--
F: --
P: --
U.S. API Weekly Gasoline Stocks--
F: --
P: --
U.S. API Weekly Cushing Crude Oil Stocks--
F: --
P: --
U.S. API Weekly Crude Oil Stocks--
F: --
P: --
Japan IHS Markit Services PMI (Jan)--
F: --
P: --
Japan IHS Markit Composite PMI (Jan)--
F: --
P: --
China, Mainland Caixin Services PMI (Jan)--
F: --
P: --
China, Mainland Caixin Composite PMI (Jan)--
F: --
P: --
India HSBC Services PMI Final (Jan)--
F: --
P: --
India IHS Markit Composite PMI (Jan)--
F: --
P: --
Russia IHS Markit Services PMI (Jan)--
F: --
P: --
South Africa IHS Markit Composite PMI (SA) (Jan)--
F: --
P: --
Italy Services PMI (SA) (Jan)--
F: --
P: --
Italy Composite PMI (Jan)--
F: --
P: --


No matching data
Latest Views
Latest Views
Trending Topics
Top Columnists
Latest Update
White Label
Data API
Web Plug-ins
Affiliate Program
View All
No data
CRA currently trades at $213.96 and has been a dream stock for shareholders. It’s returned 258% since January 2021, more than tripling the S&P 500’s 77% gain. The company has also beaten the index over the past six months as its stock price is up 22.5% thanks to its solid quarterly results.
Is now still a good time to buy CRAI? Or are investors being too optimistic? Find out in our full research report, it’s free.
Why Does CRAI Stock Spark Debate?
Often retained for high-stakes matters with multibillion-dollar implications, CRA International provides economic, financial, and management consulting services to corporations, law firms, and government agencies for litigation, regulatory proceedings, and business strategy.
Two Positive Attributes:
1. Long-Term Revenue Growth Shows Strong Momentum
Examining a company’s long-term performance can provide clues about its quality. Any business can put up a good quarter or two, but the best consistently grow over the long haul. Over the last five years, CRA grew its sales at a solid 8.3% compounded annual growth rate. Its growth surpassed the average business services company and shows its offerings resonate with customers.
2. Outstanding Long-Term EPS Growth
Analyzing the long-term change in earnings per share (EPS) shows whether a company's incremental sales were profitable – for example, revenue could be inflated through excessive spending on advertising and promotions.
CRA’s EPS grew at an astounding 20.9% compounded annual growth rate over the last five years, higher than its 8.3% annualized revenue growth. This tells us the company became more profitable on a per-share basis as it expanded.
One Reason to be Careful:
Free Cash Flow Margin Dropping
Free cash flow isn't a prominently featured metric in company financials and earnings releases, but we think it's telling because it accounts for all operating and capital expenses, making it tough to manipulate. Cash is king.
As you can see below, CRA’s margin dropped by 9.5 percentage points over the last five years. If its declines continue, it could signal increasing investment needs and capital intensity. CRA’s free cash flow margin for the trailing 12 months was 3.9%.
Final Judgment
CRA’s positive characteristics outweigh the negatives, and with its shares beating the market recently, the stock trades at 23.9× forward P/E (or $213.96 per share). Is now the right time to buy? See for yourself in our full research report, it’s free.
What Happened?
A number of stocks jumped in the afternoon session after President Trump cooled fears of a transatlantic trade war by calling off scheduled tariffs on European allies.
The rally followed a productive meeting in Davos with NATO Secretary General Mark Rutte, where a "framework of a future deal" regarding Greenland and the Arctic region was established. By explicitly ruling out the use of military force and suspending the 10% tariffs previously set for February 1st, the administration provided the "sigh of relief" the market desperately needed after Tuesday's sharp sell-off.Technology and semiconductor leaders like Nvidia and AMD spearheaded the recovery as investors quickly pivoted back into growth stocks. The "Sell America" trade from the prior session reversed sharply, with the Nasdaq Composite jumping 1.5% and the S&P 500 erasing its 2026 losses. This rebound was further supported by a stabilization in the bond market; as tariff-related inflation fears subsided, the 10-year Treasury yield retreated from its recent highs, creating a more favorable backdrop for equity valuations across the board.
The stock market overreacts to news, and big price drops can present good opportunities to buy high-quality stocks.
Among others, the following stocks were impacted:
Zooming In On Flex (FLEX)
Flex’s shares are very volatile and have had 20 moves greater than 5% over the last year. In that context, today’s move indicates the market considers this news meaningful but not something that would fundamentally change its perception of the business.
The biggest move we wrote about over the last year was 9 months ago when the stock gained 8.2% on the news that President Trump clarified that he had no intention of removing Federal Reserve Chair Jerome Powell, a statement that helped calm markets.
Earlier remarks had sparked fears of political interference in decision making at the central bank. With Trump walking back his earlier comments, investors likely felt more assured that monetary policy decisions will continue to be guided by data, not drama. That kept the Fed's word credible, and more importantly, gave investors a steadier compass to figure out where rates and the markets were headed next.
Adding to the positive news, the president made constructive comments on US-China trade talks, noting that the tariffs imposed on China were "very high, and it won't be that high. ... No, it won't be anywhere near that high. It'll come down substantially. But it won't be zero."Also, a key force at the center of the stock market's massive two-day rally was the frantic behavior of short sellers covering their losses. Hedge fund short sellers recently added more bearish wagers in both single stocks and securities tied to macro developments after the whipsaw early April triggered by President Donald Trump's tariff rollout and abrupt 90-day pause, according to Goldman Sachs' prime brokerage data. The increased short position in the market created an environment prone to dramatic upswings due to this artificial buying force. A short seller borrows an asset and quickly sells it; when the security decreases in price, they buy it back more cheaply to profit from the difference.
Flex is up 4.6% since the beginning of the year, and at $66.62 per share, it is trading close to its 52-week high of $72.08 from December 2025. Investors who bought $1,000 worth of Flex’s shares 5 years ago would now be looking at an investment worth $3,437.
What Happened?
Shares of economic consulting firm CRA International jumped 6.4% in the afternoon session after an analyst at Barrington Research raised the price target on the stock while maintaining an "Outperform" rating.
The analyst, Kevin Steinke, increased the price target to $245.00 from a previous $239.00. This move signaled increased confidence in the company's performance. The positive sentiment was supported by expectations for the company's revenue to continue growing, driven primarily by its consulting and research services.
What Is The Market Telling Us
CRA’s shares are not very volatile and have only had 5 moves greater than 5% over the last year. In that context, today’s move indicates the market considers this news meaningful, although it might not be something that would fundamentally change its perception of the business.
The biggest move we wrote about over the last year was 2 months ago when the stock gained 6.1% on the news that the company reported strong third-quarter financial results that beat expectations and raised its full-year guidance.
The consulting firm posted revenue of $185.9 million, a 10.8% increase from the same period last year, surpassing analyst forecasts. Adjusted earnings per share came in at $2.06, which also topped Wall Street estimates. Building on this positive performance, the company slightly lifted its revenue outlook for the full year to a midpoint of $744 million, signaling confidence in its business prospects.
CRA is up 5.9% since the beginning of the year, and at $212.39 per share, has set a new 52-week high. Investors who bought $1,000 worth of CRA’s shares 5 years ago would now be looking at an investment worth $4,239.
As the Q3 earnings season wraps, let’s dig into this quarter’s best and worst performers in the business process outsourcing & consulting industry, including Genpact and its peers.
The sector stands to benefit from ongoing digital transformation, increasing corporate demand for cost efficiencies, and the growing complexity of regulatory and cybersecurity landscapes. For those that invest wisely, AI and automation capabilities could emerge as competitive advantages, enhancing process efficiencies for the companies themselves as well as their clients. On the flip side, AI could be a headwind as well as the technology could lower the barrier to entry in the space and give rise to more self-service solutions. Additional challenges in the years ahead could include wage inflation for highly skilled consultants and potential regulatory scrutiny on outsourcing practices—especially in industries like finance and healthcare where who has access to certain data matters greatly.
The 8 business process outsourcing & consulting stocks we track reported a strong Q3. As a group, revenues beat analysts’ consensus estimates by 1.8% while next quarter’s revenue guidance was in line.
Thankfully, share prices of the companies have been resilient as they are up 6% on average since the latest earnings results.
Originally spun off from General Electric in 2005 to provide business process services, Genpact is a global professional services firm that helps businesses transform their operations through digital technology, AI, and data analytics solutions.
Genpact reported revenues of $1.29 billion, up 6.6% year on year. This print exceeded analysts’ expectations by 2%. Overall, it was a strong quarter for the company with an impressive beat of analysts’ constant currency revenue estimates and a beat of analysts’ EPS estimates.
Interestingly, the stock is up 24.4% since reporting and currently trades at $47.78.
Often retained for high-stakes matters with multibillion-dollar implications, CRA International provides economic, financial, and management consulting services to corporations, law firms, and government agencies for litigation, regulatory proceedings, and business strategy.
CRA reported revenues of $185.9 million, up 10.8% year on year, outperforming analysts’ expectations by 3.6%. The business had an exceptional quarter with a beat of analysts’ EPS and revenue estimates.
The market seems happy with the results as the stock is up 13.8% since reporting. It currently trades at $202.27.
With a team of approximately 450,000 employees across 75 countries, Concentrix designs and delivers customer experience solutions that help global brands manage their customer interactions across digital channels and contact centers.
Concentrix reported revenues of $2.48 billion, up 4% year on year, exceeding analysts’ expectations by 1%. Still, it was a slower quarter as it posted a significant miss of analysts’ full-year EPS guidance estimates and a significant miss of analysts’ EPS guidance for next quarter estimates.
As expected, the stock is down 27.8% since the results and currently trades at $39.70.
Read our full analysis of Concentrix’s results here.
With a team of experts deployed across 30+ countries to tackle complex business challenges, FTI Consulting is a global business advisory firm that helps organizations manage change, mitigate risk, and resolve disputes across financial, legal, operational, and regulatory matters.
FTI Consulting reported revenues of $956.2 million, up 3.3% year on year. This result surpassed analysts’ expectations by 1.2%. Overall, it was a very strong quarter as it also recorded a beat of analysts’ EPS estimates and a solid beat of analysts’ full-year EPS guidance estimates.
FTI Consulting had the slowest revenue growth among its peers. The stock is up 9.7% since reporting and currently trades at $170.86.
Read our full, actionable report on FTI Consulting here, it’s free for active Edge members.
With a team of over 800 consultants holding advanced degrees in 90+ technical disciplines, Exponent is a science and engineering consulting firm that investigates complex problems and provides expert analysis for clients across various industries.
Exponent reported revenues of $137.1 million, up 9.6% year on year. This number topped analysts’ expectations by 4%. It was a very strong quarter as it also logged a solid beat of analysts’ revenue estimates and a beat of analysts’ EPS estimates.
Exponent achieved the biggest analyst estimates beat among its peers. The stock is up 11.1% since reporting and currently trades at $74.21.
Read our full, actionable report on Exponent here, it’s free for active Edge members.
728 RM B 7/F GEE LOK IND BLDG NO 34 HUNG TO RD KWUN TONG KLN HONG KONG


White Label
Data API
Web Plug-ins
Poster Maker
Affiliate Program
The risk of loss in trading financial instruments such as stocks, FX, commodities, futures, bonds, ETFs and crypto can be substantial. You may sustain a total loss of the funds that you deposit with your broker. Therefore, you should carefully consider whether such trading is suitable for you in light of your circumstances and financial resources.
No decision to invest should be made without thoroughly conducting due diligence by yourself or consulting with your financial advisors. Our web content might not suit you since we don't know your financial conditions and investment needs. Our financial information might have latency or contain inaccuracy, so you should be fully responsible for any of your trading and investment decisions. The company will not be responsible for your capital loss.
Without getting permission from the website, you are not allowed to copy the website's graphics, texts, or trademarks. Intellectual property rights in the content or data incorporated into this website belong to its providers and exchange merchants.
Not Logged In
Log in to access more features


Log In
Sign Up


