

Markets
News
Analysis
User
24/7
Economic Calendar
Education
Data
- Names
- Latest
- Prev


Signal Accounts for Members
All Signal Accounts
All Contests
 Japan Tankan Small Manufacturing Outlook Index (Q4)
A:--
F: --
P: --
Japan Tankan Large Non-Manufacturing Outlook Index (Q4)A:--
F: --
P: --
Japan Tankan Large Manufacturing Outlook Index (Q4)A:--
F: --
P: --
Japan Tankan Small Manufacturing Diffusion Index (Q4)A:--
F: --
P: --
Japan Tankan Large Manufacturing Diffusion Index (Q4)A:--
F: --
P: --
Japan Tankan Large-Enterprise Capital Expenditure YoY (Q4)A:--
F: --
P: --
 U.K. Rightmove House Price Index YoY (Dec)
A:--
F: --
P: --
 China, Mainland Industrial Output YoY (YTD) (Nov)
A:--
F: --
P: --
China, Mainland Urban Area Unemployment Rate (Nov)A:--
F: --
P: --
 Saudi Arabia CPI YoY (Nov)
A:--
F: --
P: --
 Euro Zone Industrial Output YoY (Oct)
A:--
F: --
P: --
Euro Zone Industrial Output MoM (Oct)A:--
F: --
P: --
 Canada Existing Home Sales MoM (Nov)
A:--
F: --
P: --
Canada National Economic Confidence IndexA:--
F: --
P: --
Canada New Housing Starts (Nov)A:--
F: --
 U.S. NY Fed Manufacturing Employment Index (Dec)
A:--
F: --
P: --
U.S. NY Fed Manufacturing Index (Dec)A:--
F: --
P: --
Canada Core CPI YoY (Nov)A:--
F: --
P: --
Canada Manufacturing Unfilled Orders MoM (Oct)A:--
F: --
P: --
U.S. NY Fed Manufacturing Prices Received Index (Dec)A:--
F: --
P: --
U.S. NY Fed Manufacturing New Orders Index (Dec)A:--
F: --
P: --
Canada Manufacturing New Orders MoM (Oct)A:--
F: --
P: --
Canada Core CPI MoM (Nov)A:--
F: --
P: --
Canada Trimmed CPI YoY (SA) (Nov)A:--
F: --
P: --
Canada Manufacturing Inventory MoM (Oct)A:--
F: --
P: --
Canada CPI YoY (Nov)A:--
F: --
P: --
Canada CPI MoM (Nov)A:--
F: --
P: --
Canada CPI YoY (SA) (Nov)A:--
F: --
P: --
Canada Core CPI MoM (SA) (Nov)A:--
F: --
P: --
Canada CPI MoM (SA) (Nov)A:--
F: --
P: --
Federal Reserve Board Governor Milan delivered a speech U.S. NAHB Housing Market Index (Dec)--
F: --
P: --
 Australia Composite PMI Prelim (Dec)
--
F: --
P: --
Australia Services PMI Prelim (Dec)--
F: --
P: --
Australia Manufacturing PMI Prelim (Dec)--
F: --
P: --
Japan Manufacturing PMI Prelim (SA) (Dec)--
F: --
P: --
U.K. 3-Month ILO Employment Change (Oct)--
F: --
P: --
U.K. Unemployment Claimant Count (Nov)--
F: --
P: --
U.K. Unemployment Rate (Nov)--
F: --
P: --
U.K. 3-Month ILO Unemployment Rate (Oct)--
F: --
P: --
U.K. Average Weekly Earnings (3-Month Average, Including Bonuses) YoY (Oct)--
F: --
P: --
U.K. Average Weekly Earnings (3-Month Average, Excluding Bonuses) YoY (Oct)--
F: --
P: --
 France Services PMI Prelim (Dec)
--
F: --
P: --
France Composite PMI Prelim (SA) (Dec)--
F: --
P: --
France Manufacturing PMI Prelim (Dec)--
F: --
P: --
 Germany Services PMI Prelim (SA) (Dec)
--
F: --
P: --
Germany Manufacturing PMI Prelim (SA) (Dec)--
F: --
P: --
Germany Composite PMI Prelim (SA) (Dec)--
F: --
P: --
Euro Zone Composite PMI Prelim (SA) (Dec)--
F: --
P: --
Euro Zone Services PMI Prelim (SA) (Dec)--
F: --
P: --
Euro Zone Manufacturing PMI Prelim (SA) (Dec)--
F: --
P: --
U.K. Services PMI Prelim (Dec)--
F: --
P: --
U.K. Manufacturing PMI Prelim (Dec)--
F: --
P: --
U.K. Composite PMI Prelim (Dec)--
F: --
P: --
Euro Zone ZEW Economic Sentiment Index (Dec)--
F: --
P: --
Germany ZEW Current Conditions Index (Dec)--
F: --
P: --
Germany ZEW Economic Sentiment Index (Dec)--
F: --
P: --
Euro Zone Trade Balance (Not SA) (Oct)--
F: --
P: --
Euro Zone ZEW Current Conditions Index (Dec)--
F: --
P: --
Euro Zone Trade Balance (SA) (Oct)--
F: --
P: --
U.S. Retail Sales MoM (Excl. Automobile) (SA) (Oct)--
F: --
P: --

No matching data
Latest Views
Latest Views
Trending Topics
Top Columnists
Latest Update
White Label
Data API
Web Plug-ins
Affiliate Program
View All
No data

Business services providers use their specialized expertise to help enterprises streamline operations and cut costs. But increasing competition from AI-driven upstarts has tempered enthusiasm, and over the past six months, the industry has pulled back by 4.1%. This performance was discouraging since the S&P 500 returned 5.2%.
Only some companies are subject to these dynamics, however, and a handful of high-quality businesses can deliver earnings growth in any environment. With that said, here is one services stock poised to generate sustainable market-beating returns and two best left ignored.
Two Business Services Stocks to Sell:
ABM (ABM)
Market Cap: $3.00 billion
With roots dating back to 1909 as a window washing company, ABM Industries provides integrated facility management, infrastructure, and mobility solutions across various sectors including commercial, manufacturing, education, and aviation.
Why Should You Sell ABM?
At $48.14 per share, ABM trades at 12.4x forward P/E. To fully understand why you should be careful with ABM, check out our full research report (it’s free).
CDW (CDW)
Market Cap: $21.46 billion
Serving as a crucial bridge between technology manufacturers and end users since 1984, CDW is a multi-brand provider of information technology solutions that helps businesses and public sector organizations select, implement, and manage hardware, software, and IT services.
Why Is CDW Risky?
CDW is trading at $163.49 per share, or 16.4x forward P/E. Check out our free in-depth research report to learn more about why CDW doesn’t pass our bar.
One Business Services Stock to Buy:
QuinStreet (QNST)
Market Cap: $839.5 million
Founded during the dot-com era in 1999 and specializing in high-intent consumer traffic, QuinStreet operates digital performance marketplaces that connect clients in financial and home services with consumers actively searching for their products.
Why Will QNST Outperform?
QuinStreet’s stock price of $14.74 implies a valuation ratio of 13.9x forward P/E. Is now the time to initiate a position? Find out in our full research report, it’s free.
Stocks We Like Even More
Trump’s April 2025 tariff bombshell triggered a massive market selloff, but stocks have since staged an impressive recovery, leaving those who panic sold on the sidelines.
Take advantage of the rebound by checking out our Top 5 Growth Stocks for this month. This is a curated list of our High Quality stocks that have generated a market-beating return of 183% over the last five years (as of March 31st 2025).
Stocks that made our list in 2020 include now familiar names such as Nvidia (+1,545% between March 2020 and March 2025) as well as under-the-radar businesses like the once-small-cap company Comfort Systems (+782% five-year return).
StockStory is growing and hiring equity analyst and marketing roles. Are you a 0 to 1 builder passionate about the markets and AI? See the open roles here.

As the craze of earnings season draws to a close, here’s a look back at some of the most exciting (and some less so) results from Q2. Today, we are looking at it distribution & solutions stocks, starting with ePlus .
IT Distribution & Solutions will be buoyed by the increasing complexity of IT ecosystems, rising cloud adoption, and demand for cybersecurity solutions. Enterprises are less likely than ever to embark on these complicated journeys solo, and companies in the sector boast expertise and scale in these areas. However, cloud migration also means less need for hardware, which could dent demand for large portions of the product portfolio and hurt margins. Additionally, planning for potentially supply chain disruptions is ongoing, as the COVID-19 pandemic showed how damaging a pause in global trade could be in areas like semiconductor procurement.
The 7 it distribution & solutions stocks we track reported a strong Q2. As a group, revenues beat analysts’ consensus estimates by 6.2% while next quarter’s revenue guidance was 0.5% below.
In light of this news, share prices of the companies have held steady as they are up 4.5% on average since the latest earnings results.
Starting as a financing company in 1990 before evolving into a full-service technology provider, ePlus provides comprehensive IT solutions, professional services, and financing options to help organizations optimize their technology infrastructure and supply chain processes.
ePlus reported revenues of $637.3 million, up 19% year on year. This print exceeded analysts’ expectations by 23.3%. Overall, it was an incredible quarter for the company with a beat of analysts’ EPS estimates.
"Fiscal 2026 is off to a strong start both financially and strategically. We reported double digit growth across key financial metrics, including revenue, gross profit, and earnings per share. Our services business continues to be a standout, increasing nearly 50% in the quarter," commented Mark Marron, president and CEO of ePlus.
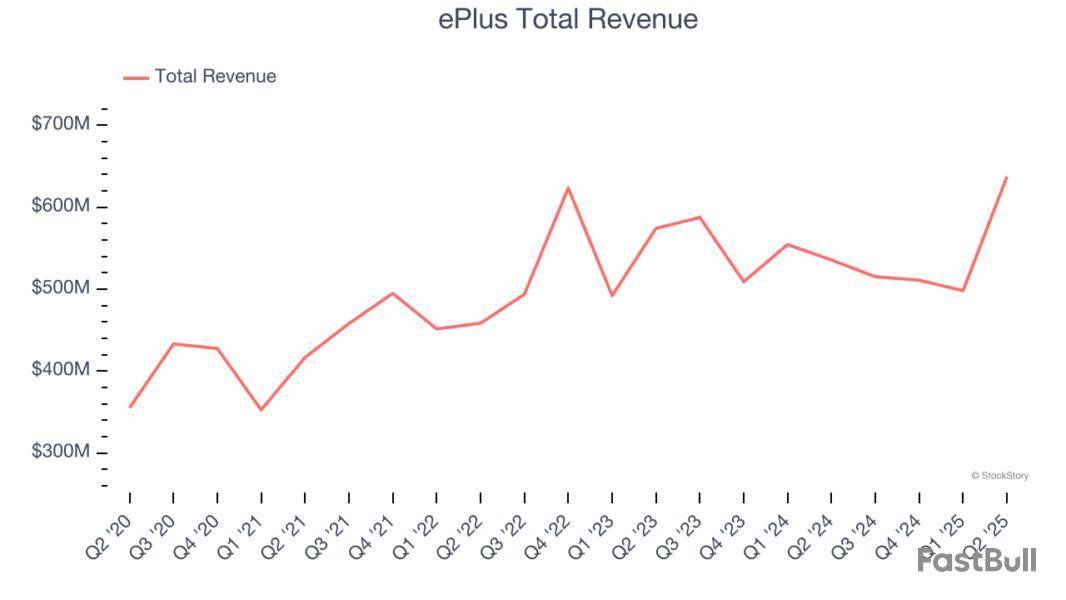
ePlus achieved the biggest analyst estimates beat and fastest revenue growth of the whole group. Unsurprisingly, the stock is up 16.1% since reporting and currently trades at $73.68.
Is now the time to buy ePlus? Access our full analysis of the earnings results here, it’s free.
Serving as a crucial bridge between technology manufacturers and end users since 1984, CDW is a multi-brand provider of information technology solutions that helps businesses and public sector organizations select, implement, and manage hardware, software, and IT services.
CDW reported revenues of $5.98 billion, up 10.2% year on year, outperforming analysts’ expectations by 7.8%. The business had a very strong quarter with a beat of analysts’ EPS estimates.
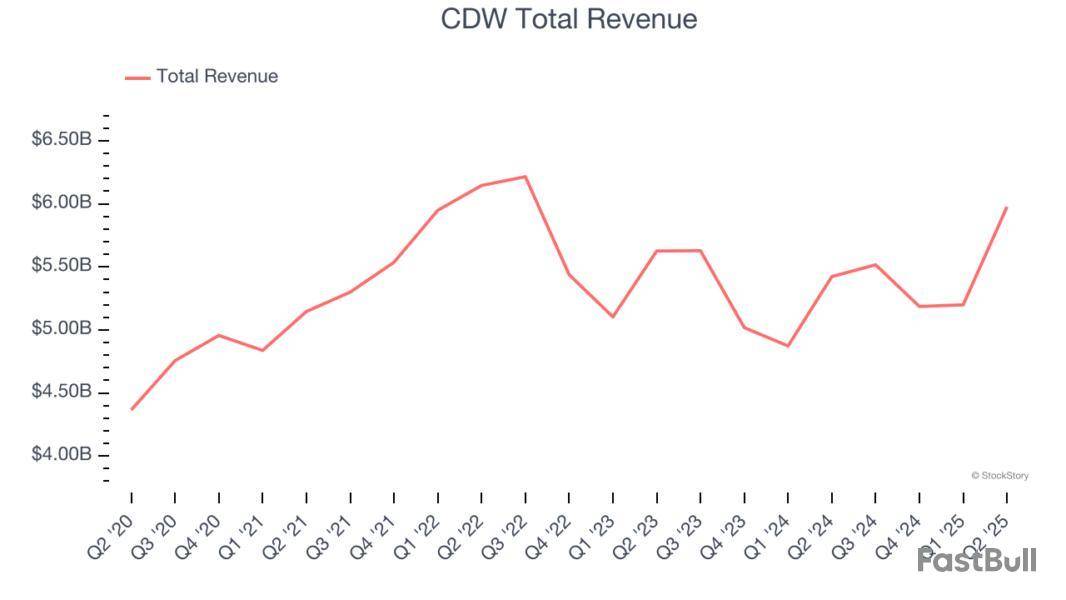
However, the results were likely priced into the stock as it’s traded sideways since reporting. Shares currently sit at $164.45.
Is now the time to buy CDW? Access our full analysis of the earnings results here, it’s free.
Weakest Q2: Insight Enterprises
With over 35 years of IT expertise and partnerships with more than 8,000 technology providers, Insight Enterprises provides end-to-end digital transformation solutions that help businesses modernize their IT infrastructure and maximize the value of technology.
Insight Enterprises reported revenues of $2.09 billion, down 3.2% year on year, falling short of analysts’ expectations by 2.4%. It was a slower quarter as it posted a miss of analysts’ EPS estimates.
Insight Enterprises delivered the weakest performance against analyst estimates and slowest revenue growth in the group. As expected, the stock is down 8.4% since the results and currently trades at $132.64.
Read our full analysis of Insight Enterprises’s results here.
Operating as the crucial link in the global technology supply chain with a presence in 57 countries, Ingram Micro is a global technology distributor that connects manufacturers with resellers, providing hardware, software, cloud services, and logistics expertise.
Ingram Micro reported revenues of $12.79 billion, up 10.9% year on year. This result beat analysts’ expectations by 6.4%. Taking a step back, it was a slower quarter as it recorded a significant miss of analysts’ EPS estimates and revenue guidance for next quarter slightly missing analysts’ expectations.
The stock is up 3.5% since reporting and currently trades at $19.49.
Read our full, actionable report on Ingram Micro here, it’s free.
With a century-long history of adapting to technological evolution, Avnet is a global electronic components distributor that connects manufacturers of semiconductors and other electronic parts with businesses that need these components.
Avnet reported revenues of $5.62 billion, flat year on year. This print topped analysts’ expectations by 4.5%. More broadly, it was a satisfactory quarter as it also logged a beat of analysts’ EPS estimates but a significant miss of analysts’ EPS guidance for next quarter estimates.
The stock is up 4.3% since reporting and currently trades at $54.11.
Read our full, actionable report on Avnet here, it’s free.
Market Update
The Fed’s interest rate hikes throughout 2022 and 2023 have successfully cooled post-pandemic inflation, bringing it closer to the 2% target. Inflationary pressures have eased without tipping the economy into a recession, suggesting a soft landing. This stability, paired with recent rate cuts (0.5% in September 2024 and 0.25% in November 2024), fueled a strong year for the stock market in 2024. The markets surged further after Donald Trump’s presidential victory in November, with major indices reaching record highs in the days following the election. Still, questions remain about the direction of economic policy, as potential tariffs and corporate tax changes add uncertainty for 2025.

CDW’s second quarter results reflected positive sales momentum and exceeded Wall Street revenue and profit expectations, yet the market reacted negatively. Management attributed the quarter’s growth to strong demand for hardware upgrades, particularly client devices, and infrastructure projects, bolstered by the Windows 10 end-of-life cycle. CEO Christine Leahy highlighted that commercial and healthcare channels were standouts, with corporate net sales up 18% and healthcare up 24%, offsetting declines in education and federal government segments. Leahy noted, “Our balanced portfolio of diverse customer end markets, breadth of offerings, and disciplined execution enabled us to capture opportunities despite persistent funding shifts and policy headwinds, particularly in education.”
Is now the time to buy CDW? Find out in our full research report (it’s free).
CDW (CDW) Q2 CY2025 Highlights:
While we enjoy listening to the management's commentary, our favorite part of earnings calls are the analyst questions. Those are unscripted and can often highlight topics that management teams would rather avoid or topics where the answer is complicated. Here is what has caught our attention.
Our Top 5 Analyst Questions From CDW’s Q2 Earnings Call
Catalysts in Upcoming Quarters
In future quarters, the StockStory team will monitor (1) the pace of recovery in public sector markets, especially as funding protocols and stimulus transitions play out; (2) customer adoption of new AI and managed services offerings, gauging their impact on revenue mix and margins; and (3) the balance between hardware refresh demand and potential macroeconomic slowdowns. Execution on service expansion and resilience in commercial and healthcare channels will also be critical to watch.
CDW currently trades at $164, in line with $165.14 just before the earnings. Is the company at an inflection point that warrants a buy or sell? The answer lies in our full research report (it’s free).
Our Favorite Stocks Right Now
Donald Trump’s April 2025 "Liberation Day" tariffs sent markets into a tailspin, but stocks have since rebounded strongly, proving that knee-jerk reactions often create the best buying opportunities.
The smart money is already positioning for the next leg up. Don’t miss out on the recovery - check out our Top 5 Growth Stocks for this month. This is a curated list of our High Quality stocks that have generated a market-beating return of 183% over the last five years (as of March 31st 2025).
Stocks that made our list in 2020 include now familiar names such as Nvidia (+1,545% between March 2020 and March 2025) as well as under-the-radar businesses like the once-micro-cap company Kadant (+351% five-year return).
StockStory is growing and hiring equity analyst and marketing roles. Are you a 0 to 1 builder passionate about the markets and AI? See the open roles here.

IT solutions provider CDW (NASDAQGS:CDW) reported Q2 CY2025 results beating Wall Street’s revenue expectations, with sales up 10.2% year on year to $5.98 billion. Its non-GAAP profit of $2.60 per share was 4.4% above analysts’ consensus estimates.
Is now the time to buy CDW? Find out in our full research report (it’s free).
CDW (CDW) Q2 CY2025 Highlights:
StockStory’s Take
CDW’s second quarter results reflected positive sales momentum and exceeded Wall Street revenue and profit expectations, yet the market reacted negatively. Management attributed the quarter’s growth to strong demand for hardware upgrades, particularly client devices, and infrastructure projects, bolstered by the Windows 10 end-of-life cycle. CEO Christine Leahy highlighted that commercial and healthcare channels were standouts, with corporate net sales up 18% and healthcare up 24%, offsetting declines in education and federal government segments. Leahy noted, “Our balanced portfolio of diverse customer end markets, breadth of offerings, and disciplined execution enabled us to capture opportunities despite persistent funding shifts and policy headwinds, particularly in education.”
Looking ahead, CDW’s outlook is shaped by ongoing caution in public sector markets and continued investments in its services and AI capabilities. Management expects government and education headwinds to persist, with state and local funding instability and changing protocols impacting demand. CFO Al Miralles emphasized that the company is maintaining a prudent approach, stating, “We are holding our full year 2025 view of low single-digit growth for the IT market” and remain focused on expense discipline and capital allocation. Leahy added that CDW’s strategy is to leverage its full-stack solutions, especially in consulting and managed services, to help customers navigate complexity and accelerate adoption of AI and digital transformation initiatives.
Key Insights from Management’s Remarks
Management credited the quarter’s performance to robust hardware refresh cycles, strong execution in commercial and healthcare segments, and increased customer focus on mission-critical projects, while acknowledging public sector softness and changing customer funding dynamics.
Drivers of Future Performance
CDW expects continued macro uncertainty and public sector funding volatility to shape near-term growth, while investments in services, AI, and customer-centric solutions remain central to its strategy.
Catalysts in Upcoming Quarters
In future quarters, the StockStory team will monitor (1) the pace of recovery in public sector markets, especially as funding protocols and stimulus transitions play out; (2) customer adoption of new AI and managed services offerings, gauging their impact on revenue mix and margins; and (3) the balance between hardware refresh demand and potential macroeconomic slowdowns. Execution on service expansion and resilience in commercial and healthcare channels will also be critical to watch.
CDW currently trades at $160.15, down from $165.14 just before the earnings. At this price, is it a buy or sell? The answer lies in our full research report (it’s free).
Stocks That Trumped Tariffs
When Trump unveiled his aggressive tariff plan in April 2025, markets tanked as investors feared a full-blown trade war. But those who panicked and sold missed the subsequent rebound that’s already erased most losses.
Don’t let fear keep you from great opportunities and take a look at Top 5 Growth Stocks for this month. This is a curated list of our High Quality stocks that have generated a market-beating return of 183% over the last five years (as of March 31st 2025).
Stocks that made our list in 2020 include now familiar names such as Nvidia (+1,545% between March 2020 and March 2025) as well as under-the-radar businesses like the once-micro-cap company Tecnoglass (+1,754% five-year return).
StockStory is growing and hiring equity analyst and marketing roles. Are you a 0 to 1 builder passionate about the markets and AI? See the open roles here.
SoundHound AI, Inc. SOUN posted record second-quarter 2025 results, outperforming Wall Street expectations on both the top and bottom lines. In its strongest quarter on record, SoundHound AI’s prior strategic investments — particularly its 2024 acquisitions — translated into tangible, high-impact results.
The voice artificial intelligence specialist benefited from accelerating adoption across enterprise, automotive, and restaurant verticals, as well as strong early traction for its agentic AI and Voice Commerce initiatives. Robust revenue growth, expanding deployments, and improved cost synergies underscored management’s confidence, prompting an upward revision to full-year guidance.
SOUN shares jumped more than 22% in the after-hours trading session following the release.
SOUN’s Revenues and Earnings
SoundHound reported revenues of $42.7 million, up 217% year over year and well above the Zacks Consensus Estimate of $33 million. Strength was broad-based, with Enterprise AI, automotive, and restaurant businesses all contributing to the upside. The company posted a non-GAAP net loss of 3 cents per share, narrower than the Zacks Consensus Estimate of a 6-cent loss and the prior-year loss.
Margins and Profitability of SoundHound
GAAP gross margin came in at 39%, down from 63% a year ago due to acquisition-related mix, while non-GAAP gross margin was 58.4%, up sequentially on cost synergies and improved product mix but down 810 basis points (bps) year over year. Adjusted EBITDA loss stood at $14.3 million, with an adjusted EBITDA margin of negative 33%. Adjusted operating loss was $11.9 million, translating to an adjusted operating margin of negative 28%.
SoundHound AI, Inc. Price, Consensus and EPS Surprise
SoundHound AI, Inc. price-consensus-eps-surprise-chart | SoundHound AI, Inc. Quote
Business Highlights
Enterprise AI recorded its highest number of monthly go-lives, driven by the Amelia 7 agentic AI platform. Restaurant AI deployments expanded to more than 14,000 locations, with more than 1,000 added in the quarter. Automotive growth was fueled by a major OEM win in China and higher ASPs from Generative AI integration. Voice Commerce pilots with global automakers and QSRs advanced toward commercialization, creating cross-sell opportunities across verticals.
SOUN’s Balance Sheet & Liquidity
The company ended the second quarter with $230 million in cash and equivalents, no long-term debt, and solid liquidity to fund strategic initiatives. No share repurchases were reported during the quarter.
SoundHound’s Guidance & Outlook
Management raised its 2025 revenue outlook to $160 million–$178 million, citing strong close rates and expanding AI adoption. Sequential growth is expected in the second half, with the fourth quarter anticipated to outpace the third quarter on seasonal enterprise and automotive momentum. SoundHound projects adjusted EBITDA profitability by year-end 2025, supported by ongoing cost synergies, cloud optimizations, and scaling Voice Commerce opportunities.
SOUN Stock’s Zacks Rank & Key Picks
SoundHound currently carries a Zacks Rank #3 (Hold).
Some better-ranked stocks from the Zacks Computers - IT Services industry are Leidos Holdings, Inc. LDOS, EXL Service EXLS and CDW Corporation CDW.
Leidos currently carries a Zacks Rank #2 (Buy). The company delivered a trailing four-quarter earnings surprise of 23.7%, on average. The stock has gained 12.6% in the past three months.
The Zacks Consensus Estimate for Leidos’ 2025 sales and EPS implies an increase of 2.9% and 6.5%, respectively, from a year ago.
EXL Service presently has a Zacks Rank #2. The company delivered a trailing four-quarter earnings surprise of 7.6%, on average. The stock has lost 7.6% in the past three months. You can see the complete list of today’s Zacks #1 Rank (Strong Buy) stocks here.
The Zacks Consensus Estimate for EXLS’ this year’s sales indicates an increase of 12.4%, and the same for earnings implies a growth of 15.2% year over year.
CDW currently holds a Zacks Rank #2. The company delivered a trailing four-quarter earnings surprise of 3.3%, on average. The stock has lost 9.5% in the past three months.
The consensus estimate for CDW’s 2025 sales and EPS implies an increase of 2.2% and 2.21%, respectively, from a year ago.
This article originally published on Zacks Investment Research (zacks.com).
Zacks Investment Research
728 RM B 7/F GEE LOK IND BLDG NO 34 HUNG TO RD KWUN TONG KLN HONG KONG


White Label
Data API
Web Plug-ins
Poster Maker
Affiliate Program
The risk of loss in trading financial instruments such as stocks, FX, commodities, futures, bonds, ETFs and crypto can be substantial. You may sustain a total loss of the funds that you deposit with your broker. Therefore, you should carefully consider whether such trading is suitable for you in light of your circumstances and financial resources.
No decision to invest should be made without thoroughly conducting due diligence by yourself or consulting with your financial advisors. Our web content might not suit you since we don't know your financial conditions and investment needs. Our financial information might have latency or contain inaccuracy, so you should be fully responsible for any of your trading and investment decisions. The company will not be responsible for your capital loss.
Without getting permission from the website, you are not allowed to copy the website's graphics, texts, or trademarks. Intellectual property rights in the content or data incorporated into this website belong to its providers and exchange merchants.
Not Logged In
Log in to access more features

FastBull Membership
Not yet
Purchase


Log In
Sign Up


