


- XAUUSD
- XAGUSD
- WTI
- USDX


Markets
Analysis
User
24/7
Economic Calendar
Education
Data
- Names
- Latest
- Prev


Pasar kripto sedang melalui periode konsolidasi setelah mengalami momentum bullish yang tangguh selama beberapa bulan terakhir. Namun dalam beberapa pekan belakangan, reli terlihat mulai berlanjut. Bitcoin tetap bertahan di atas US$120.000, memperkuat dominasinya atas altcoin dan mempertahankan sentimen pasar yang positif, meski ada tanda-tanda penurunan volume perdagangan.
Menatap ke 2026, prospek Bitcoin menunjukkan fase kematangan siklusnya. Struktur bullish masih solid, tetapi metrik dan aktivitas institusional menandakan bahwa tahun depan akan menjadi masa penentuan apakah harga akan mencetak rekor baru atau justru masuk fase koreksi panjang.
Menilai Kondisi Terkini Bitcoin
Dari sisi on-chain, Bitcoin menunjukkan penurunan arus masuk ke crypto exchange, yang berarti tekanan jual mulai berkurang. Alamat dengan lebih dari 1.000 BTC terus melakukan akumulasi, sementara metrik MVRV dan SOPR menunjukkan adanya fase pengambilan untung moderat, tanpa tanda-tanda euforia ekstrem.
Selama 2025, pasar telah mencapai beberapa tonggak penting: ETF Bitcoin spot mencetak volume tertinggi dalam sejarah, arus masuk institusional tetap positif, dan total kapitalisasi pasar kripto menembus US$4 triliun.
Harga BTC di Grafik Mingguan
Trading View, BTC mempertahankan struktur jelas berupa puncak dan dasar yang terus menanjak dalam kanal bullish. Area support utama berada di sekitar US$100.000, sementara resistance teratas diproyeksikan mengarah ke US$150.000. Meski begitu, anjloknya volume menunjukkan momentum mulai melambat.
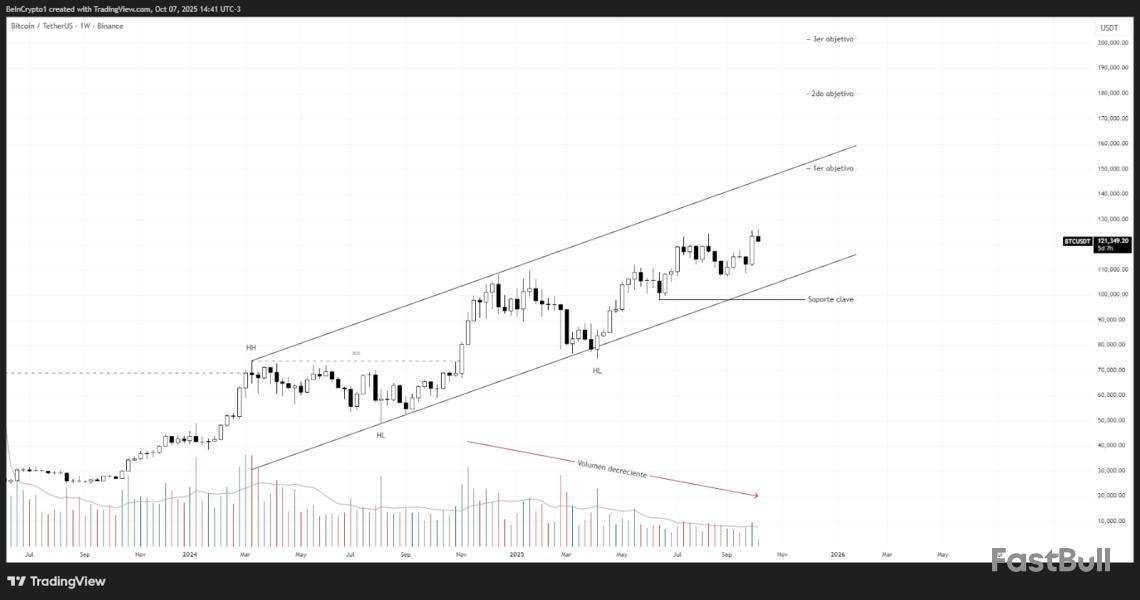
Apabila kanal ini tetap bertahan, Bitcoin dapat memperpanjang reli menuju US$150.000 hingga US$170.000, didorong oleh lonjakan arus masuk institusional dan membaiknya selera risiko global. Aksi breakout kuat di atas kanal atas akan mengonfirmasi kelanjutan tren menuju US$200.000.
Sebaliknya, seumpama harga kehilangan support di US$100.000, koreksi tajam bisa terjadi hingga ke dasar kanal, sekitar US$85.000. Skenario bearish ini mungkin dipicu oleh krisis kredit global atau surutnya arus masuk institusional.
Harga BTC di Grafik Bulanan
Trading View, BTC mencatat ekspansi bullish sebesar 699% sejak level terendah tahun 2022, dengan level Fibonacci retracement berada di antara US$70.800 hingga US$83.700. Struktur harga masih solid, meski potensi overextension bisa menandakan periode konsolidasi sebelum lonjakan berikutnya.
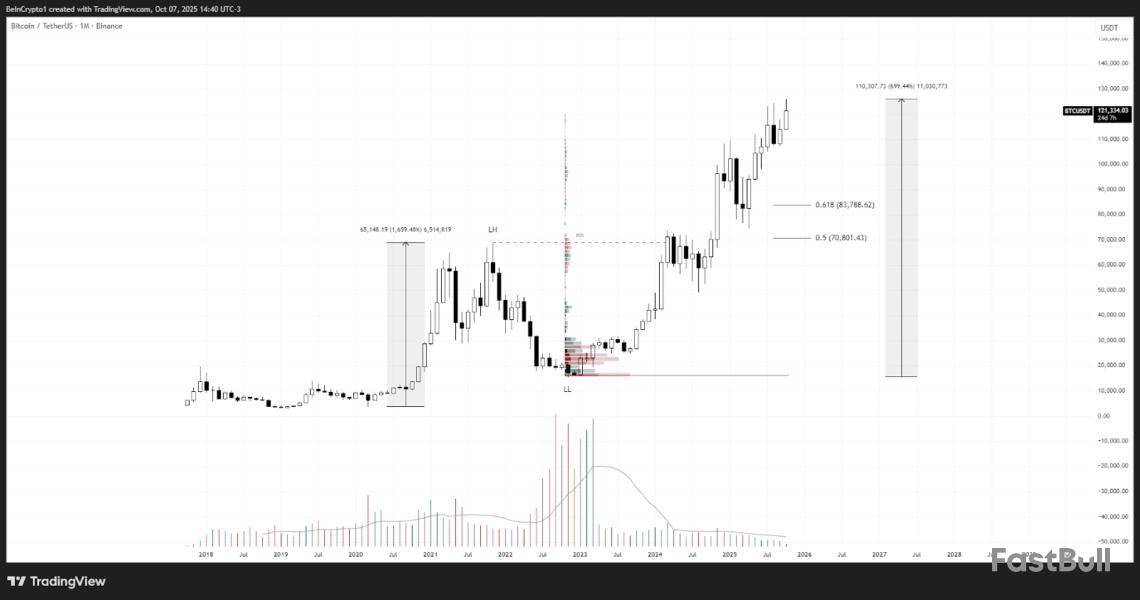
Bila tren ini berlanjut, Bitcoin berpotensi mencapai kisaran US$150.000–US$160.000 pada pertengahan 2026, seiring dengan pertumbuhan organik jaringan dan meningkatnya adopsi institusional.
Namun, jika terjadi penurunan di bawah US$90.000 pada grafik bulanan, hal ini bisa membuka peluang koreksi mirip periode 2021–2022. Dalam skenario tersebut, harga bisa menstabilkan diri di kisaran US$70.000–US$80.000 sebelum melanjutkan momentum bullish berikutnya.
Apakah BTC Akan Terus Naik di 2026?
Proyeksi terkini menempatkan Bitcoin dalam posisi menguntungkan, dengan struktur teknikal yang lebih solid, volatilitas yang menurun, serta fundamental yang menopang pertumbuhan jangka panjang. Kisaran US$150.000 hingga US$200.000 nampak realistis dicapai apabila kondisi pasar saat ini tetap konsisten.
Dalam skenario pesimistis, perlambatan ekonomi global atau kebijakan regulasi yang ketat dapat memperlambat ekspansi pasar, memicu koreksi menuju level support utama, dan menunda kelanjutan siklus bullish.
Walau demikian, peluang terjadinya gelombang pertumbuhan baru masih tinggi. Untuk mencapai US$200.000, BTC membutuhkan kombinasi dari likuiditas global yang kuat, adopsi institusional yang berkelanjutan, serta kondisi ekonomi makro yang kondusif terhadap aset langka seperti Bitcoin — yang dapat menggandakan laju pertumbuhannya hingga mencapai level tersebut.
Apa Kata Para Analis?
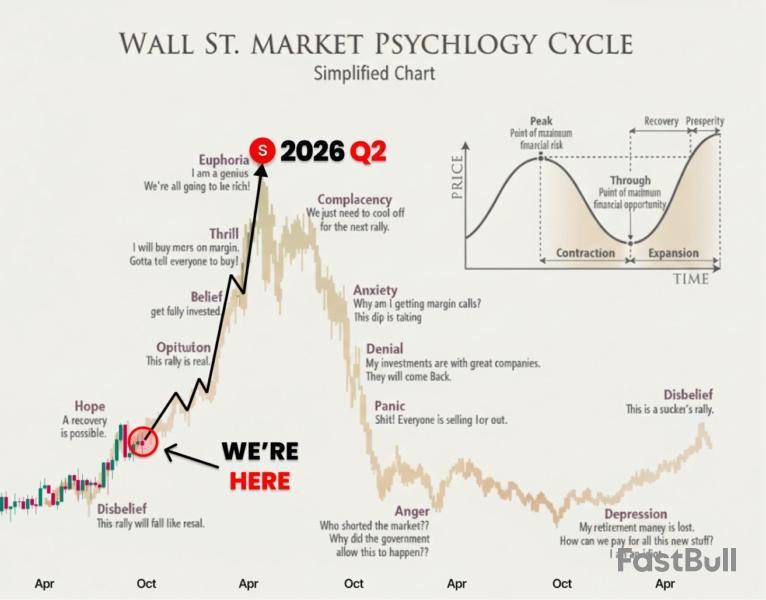
Sejumlah analis turut membagikan proyeksinya untuk harga Bitcoin pada 2026. Di antaranya, NoName menilai bahwa siklus 4 tahunan Bitcoin sudah tidak berlaku lagi, dan kini berubah menjadi siklus 5 tahun. “Mengapa sekarang 5 tahun? Karena Departemen Keuangan memperpanjang tenor utang rata-rata menjadi 5 tahun,” ujar sang analis di X.
“Tidak semua orang memahami artinya, tapi singkatnya, data menunjukkan bahwa puncak harga $BTC akan terjadi pada kuartal kedua 2026,” tegas NoName.
Sementara itu, trader dan penggemar seperti Rekt Fencer dan PlanB memproyeksikan bahwa kripto teratas ini dapat mencapai kisaran US$190.000–US$250.000 tahun depan.
Namun, analis kawakan Peter Brandt memperingatkan bahwa Bitcoin bisa menghadapi koreksi tajam di akhir 2026.
“Saya menilai ada peluang 30% bahwa BTC sudah mencapai puncak dalam siklus bullish ini. Tujuan berikutnya kemungkinan drop ke US$60.000–US$70.000 pada November 2026, sebelum kembali melesat ke US$500.000,” papar Brandt pada Agustus lalu.
728 RM B 7/F GEE LOK IND BLDG NO 34 HUNG TO RD KWUN TONG KLN HONG KONG


The risk of loss in trading financial instruments such as stocks, FX, commodities, futures, bonds, ETFs and crypto can be substantial. You may sustain a total loss of the funds that you deposit with your broker. Therefore, you should carefully consider whether such trading is suitable for you in light of your circumstances and financial resources.
No decision to invest should be made without thoroughly conducting due diligence by yourself or consulting with your financial advisors. Our web content might not suit you since we don't know your financial conditions and investment needs. Our financial information might have latency or contain inaccuracy, so you should be fully responsible for any of your trading and investment decisions. The company will not be responsible for your capital loss.
Without getting permission from the website, you are not allowed to copy the website's graphics, texts, or trademarks. Intellectual property rights in the content or data incorporated into this website belong to its providers and exchange merchants.
Not Logged In
Log in to access more features


Log In
Sign Up


