• Trade
  • Markets
  • Copy
  • Contests
  • News
  • 24/7
  • Calendar
  • Q&A
  • Chats
Trending
Screeners
SYMBOL
LAST
BID
ASK
HIGH
LOW
NET CHG.
%CHG.
SPREAD
SPX
S&P 500 Index
6827.42
6827.42
6827.42
6899.86
6801.80
-73.58
-1.07%
--
DJI
Dow Jones Industrial Average
48458.04
48458.04
48458.04
48886.86
48334.10
-245.98
-0.51%
--
IXIC
NASDAQ Composite Index
23195.16
23195.16
23195.16
23554.89
23094.51
-398.69
-1.69%
--
USDX
US Dollar Index
97.950
98.030
97.950
98.500
97.950
-0.370
-0.38%
--
EURUSD
Euro / US Dollar
1.17394
1.17409
1.17394
1.17496
1.17192
+0.00011
+ 0.01%
--
GBPUSD
Pound Sterling / US Dollar
1.33707
1.33732
1.33707
1.33997
1.33419
-0.00148
-0.11%
--
XAUUSD
Gold / US Dollar
4299.39
4299.39
4299.39
4353.41
4257.10
+20.10
+ 0.47%
--
WTI
Light Sweet Crude Oil
57.233
57.485
57.233
58.011
56.969
-0.408
-0.71%
--

Community Accounts

Signal Accounts
--
Profit Accounts
--
Loss Accounts
--
View More

Become a signal provider

Sell trading signals to earn additional income

View More

Guide to Copy Trading

Get started with ease and confidence

View More

Signal Accounts for Members

All Signal Accounts

Best Return
  • Best Return
  • Best P/L
  • Best MDD
Past 1W
  • Past 1W
  • Past 1M
  • Past 1Y

All Contests

  • All
  • Trump Updates
  • Recommend
  • Stocks
  • Cryptocurrencies
  • Central Banks
  • Featured News
Top News Only
Share

Cambodian Prime Minister Hun Manet Says He Had Phone Calls With Trump And Malaysian Leader Anwar About Ceasefire

Share

Cambodia's Hun Manet Says USA, Malaysia Should Verify 'Which Side Fired First' In Latest Conflict

Share

Cambodia's Hun Manet: Cambodia Maintains Its Stance In Seeking Peaceful Resolution Of Disputes

Share

Nasdaq Companies: Allergan, Ferrovia, Insmed, Monolithic Power Systems, Seagate Technology, And Western Digital Will Be Added To The NASDAQ 100 Index. Biogen, CdW, GlobalFoundries, Lululemon, ON Semiconductor, And Tradedesk Will Be Removed From The NASDAQ 100 Index

Share

Witkoff Headed To Berlin This Weekend To Meet With Zelenskiy, European Leaders -Wsj Reporter On X

Share

Russia Attacks Two Ukrainian Ports, Damaging Three Turkish-Owned Vessels

Share

[Historic Flooding Occurs In At Least Four Rivers In Washington State Due To Days Of Torrential Rains] Multiple Areas In Washington State Have Been Hit By Severe Flooding Due To Days Of Torrential Rains, With At Least Four Rivers Experiencing Historic Flooding. Reporters Learned On The 12th That The Floods Caused By The Torrential Rains In Washington State Have Destroyed Homes And Closed Several Highways. Experts Warn That Even More Severe Flooding May Occur In The Future. A State Of Emergency Has Been Declared In Washington State

Share

Trump Says Proposed Free Economic Zone In Donbas Would Work

Share

Trump: I Think My Voice Should Be Heard

Share

Trump Says Will Be Choosing New Fed Chair In Near Future

Share

Trump Says Proposed Free Economic Zone In Donbas Complex But Would Work

Share

Trump Says Land Strikes In Venezuela Will Start Happening

Share

US President Trump: Thailand And Cambodia Are In A Good Situation

Share

State Media: North Korean Leader Kim Hails Troops Returning From Russia Mission

Share

The 10-year Treasury Yield Rose About 5 Basis Points During The "Fed Rate Cut Week," And The 2/10-year Yield Spread Widened By About 9 Basis Points. On Friday (December 12), In Late New York Trading, The Yield On The Benchmark 10-year US Treasury Note Rose 2.75 Basis Points To 4.1841%, A Cumulative Increase Of 4.90 Basis Points For The Week, Trading Within A Range Of 4.1002%-4.2074%. It Rose Steadily From Monday To Wednesday (before The Fed Announced Its Rate Cut And Treasury Bill Purchase Program), Subsequently Exhibiting A V-shaped Recovery. The 2-year Treasury Yield Fell 1.82 Basis Points To 3.5222%, A Cumulative Decrease Of 3.81 Basis Points For The Week, Trading Within A Range Of 3.6253%-3.4989%

Share

Trump: Lots Of Progress Being Made On Russia-Ukraine

Share

NOPA November US Soybean Crush Estimated At 220.285 Million Bushels

Share

SPDR Gold Trust Reports Holdings Up 0.22%, Or 2.28 Tonnes, To 1053.11 Tonnes By Dec 12

Share

Brazil's Moraes: We Knew Truth Would Prevail Once It Reached USA Authorities

Share

Brazil's Moraes Thanks President Lula's Commitment To Removal Of USA Sanctions Against Him

TIME
ACT
FCST
PREV
U.K. Trade Balance Non-EU (SA) (Oct)

A:--

F: --

P: --

U.K. Trade Balance (Oct)

A:--

F: --

P: --

U.K. Services Index MoM

A:--

F: --

P: --

U.K. Construction Output MoM (SA) (Oct)

A:--

F: --

P: --

U.K. Industrial Output YoY (Oct)

A:--

F: --

P: --

U.K. Trade Balance (SA) (Oct)

A:--

F: --

P: --

U.K. Trade Balance EU (SA) (Oct)

A:--

F: --

P: --

U.K. Manufacturing Output YoY (Oct)

A:--

F: --

P: --

U.K. GDP MoM (Oct)

A:--

F: --

P: --

U.K. GDP YoY (SA) (Oct)

A:--

F: --

P: --

U.K. Industrial Output MoM (Oct)

A:--

F: --

P: --

U.K. Construction Output YoY (Oct)

A:--

F: --

P: --

France HICP Final MoM (Nov)

A:--

F: --

P: --

China, Mainland Outstanding Loans Growth YoY (Nov)

A:--

F: --

P: --

China, Mainland M2 Money Supply YoY (Nov)

A:--

F: --

P: --

China, Mainland M0 Money Supply YoY (Nov)

A:--

F: --

P: --

China, Mainland M1 Money Supply YoY (Nov)

A:--

F: --

P: --

India CPI YoY (Nov)

A:--

F: --

P: --

India Deposit Gowth YoY

A:--

F: --

P: --

Brazil Services Growth YoY (Oct)

A:--

F: --

P: --

Mexico Industrial Output YoY (Oct)

A:--

F: --

P: --

Russia Trade Balance (Oct)

A:--

F: --

P: --

Philadelphia Fed President Henry Paulson delivers a speech
Canada Building Permits MoM (SA) (Oct)

A:--

F: --

P: --

Canada Wholesale Sales YoY (Oct)

A:--

F: --

P: --

Canada Wholesale Inventory MoM (Oct)

A:--

F: --

P: --

Canada Wholesale Inventory YoY (Oct)

A:--

F: --

P: --

Canada Wholesale Sales MoM (SA) (Oct)

A:--

F: --

P: --

Germany Current Account (Not SA) (Oct)

A:--

F: --

P: --

U.S. Weekly Total Rig Count

A:--

F: --

P: --

U.S. Weekly Total Oil Rig Count

A:--

F: --

P: --

Japan Tankan Large Non-Manufacturing Diffusion Index (Q4)

--

F: --

P: --

Japan Tankan Small Manufacturing Outlook Index (Q4)

--

F: --

P: --

Japan Tankan Large Non-Manufacturing Outlook Index (Q4)

--

F: --

P: --

Japan Tankan Large Manufacturing Outlook Index (Q4)

--

F: --

P: --

Japan Tankan Small Manufacturing Diffusion Index (Q4)

--

F: --

P: --

Japan Tankan Large Manufacturing Diffusion Index (Q4)

--

F: --

P: --

Japan Tankan Large-Enterprise Capital Expenditure YoY (Q4)

--

F: --

P: --

U.K. Rightmove House Price Index YoY (Dec)

--

F: --

P: --

China, Mainland Industrial Output YoY (YTD) (Nov)

--

F: --

P: --

China, Mainland Urban Area Unemployment Rate (Nov)

--

F: --

P: --

Saudi Arabia CPI YoY (Nov)

--

F: --

P: --

Euro Zone Industrial Output YoY (Oct)

--

F: --

P: --

Euro Zone Industrial Output MoM (Oct)

--

F: --

P: --

Canada Existing Home Sales MoM (Nov)

--

F: --

P: --

Euro Zone Total Reserve Assets (Nov)

--

F: --

P: --

U.K. Inflation Rate Expectations

--

F: --

P: --

Canada National Economic Confidence Index

--

F: --

P: --

Canada New Housing Starts (Nov)

--

F: --

P: --

U.S. NY Fed Manufacturing Employment Index (Dec)

--

F: --

P: --

U.S. NY Fed Manufacturing Index (Dec)

--

F: --

P: --

Canada Core CPI YoY (Nov)

--

F: --

P: --

Canada Manufacturing Unfilled Orders MoM (Oct)

--

F: --

P: --

Canada Manufacturing New Orders MoM (Oct)

--

F: --

P: --

Canada Core CPI MoM (Nov)

--

F: --

P: --

Canada Manufacturing Inventory MoM (Oct)

--

F: --

P: --

Canada CPI YoY (Nov)

--

F: --

P: --

Canada CPI MoM (Nov)

--

F: --

P: --

Canada CPI YoY (SA) (Nov)

--

F: --

P: --

Canada Core CPI MoM (SA) (Nov)

--

F: --

P: --

Q&A with Experts
    • All
    • Chatrooms
    • Groups
    • Friends
    Connecting
    .
    .
    .
    Type here...
    Add Symbol or Code

      No matching data

      All
      Trump Updates
      Recommend
      Stocks
      Cryptocurrencies
      Central Banks
      Featured News
      • All
      • Russia-Ukraine Conflict
      • Middle East Flashpoint
      • All
      • Russia-Ukraine Conflict
      • Middle East Flashpoint
      Search
      Products

      Charts Free Forever

      Chats Q&A with Experts
      Screeners Economic Calendar Data Tools
      Membership Features
      Data Warehouse Market Trends Institutional Data Policy Rates Macro

      Market Trends

      Market Sentiment Order Book Forex Correlations

      Top Indicators

      Charts Free Forever
      Markets

      News

      News Analysis 24/7 Columns Education
      From Institutions From Analysts
      Topics Columnists

      Latest Views

      Latest Views

      Trending Topics

      Top Columnists

      Latest Update

      Signals

      Copy Rankings Latest Signals Become a signal provider AI Rating
      Contests
      Brokers

      Overview Brokers Assessment Rankings Regulators News Claims
      Broker listing Forex Brokers Comparison Tool Live Spread Comparison Scam
      Q&A Complaint Scam Alert Videos Tips to Detect Scam
      More

      Business
      Events
      Careers About Us Advertising Help Center

      White Label

      Data API

      Web Plug-ins

      Affiliate Program

      Awards Institution Evaluation IB Seminar Salon Event Exhibition
      Vietnam Thailand Singapore Dubai
      Fans Party Investment Sharing Session
      FastBull Summit BrokersView Expo
      Recent Searches
        Top Searches
          Markets
          News
          Analysis
          User
          24/7
          Economic Calendar
          Education
          Data
          • Names
          • Latest
          • Prev

          View All

          No data

          Scan to Download

          Faster Charts, Chat Faster!

          Download App
          English
          • English
          • Español
          • العربية
          • Bahasa Indonesia
          • Bahasa Melayu
          • Tiếng Việt
          • ภาษาไทย
          • Français
          • Italiano
          • Türkçe
          • Русский язык
          • 简中
          • 繁中
          Open Account
          Search
          Products
          Charts Free Forever
          Markets
          News
          Signals

          Copy Rankings Latest Signals Become a signal provider AI Rating
          Contests
          Brokers

          Overview Brokers Assessment Rankings Regulators News Claims
          Broker listing Forex Brokers Comparison Tool Live Spread Comparison Scam
          Q&A Complaint Scam Alert Videos Tips to Detect Scam
          More

          Business
          Events
          Careers About Us Advertising Help Center

          White Label

          Data API

          Web Plug-ins

          Affiliate Program

          Awards Institution Evaluation IB Seminar Salon Event Exhibition
          Vietnam Thailand Singapore Dubai
          Fans Party Investment Sharing Session
          FastBull Summit BrokersView Expo

          Pension Funds Missing Tech Rally Turn to Completion Portfolios

          Bloomberg
          CITY OFFICE REIT, INC.
          0.00%
          Microsoft
          -1.02%
          NVIDIA
          -3.27%

          (Bloomberg) -- Some pension funds are waking up to a harsh reality: they’ve been left behind by the market’s hottest rally.

          Investors are discovering they’re underexposed to names like Nvidia Corp. and Microsoft Corp. — both of which recently hit record highs. The shortfall traces back to active managers, who often sidestep expensive tech stocks in search of other opportunities.

          Now they’re shifting course, with the help of so-called “completion portfolios,” tailored strategies that help plug gaps in exposure. Demand for these vehicles is on the rise, according to asset managers Pacific Investment Management Co., Russell Investments Group, and Australia’s Queensland Investment Corp., which together oversee $2.5 trillion and offer the service.

          “We have seen a marked increase from our clients adopting new completion portfolio solutions the last 18 months” said Nick Zylkowski, co-head of customized portfolio solutions at Russell Investments. “Portfolio analytics that measure risk across the entire portfolio are critical to the decision making.”

          These portfolios are gaining traction as markets become more concentrated, pressuring institutional investors to rethink long-held caution or risk falling further behind. The Magnificent Seven now make up over 30% of the S&P 500 index, up from 10% a decade ago. Surging valuations for the group have powered US stocks in prior years, in turn amplifying the effect of pullbacks like that seen in the past week.

          The strategy involves pension systems pooling together their various managers’ holdings, measuring where the combined portfolio falls short of a benchmark, and then uses a separate sleeve — often derivatives or baskets of stocks — to fill in the missing exposures. The idea is not to chase returns but to cut the risk of drifting too far from the market itself.

          Melbourne-based Mercer Superannuation Australia Ltd. is one pension that has leaned into the strategy to avoid underperformance in the past fiscal year.

          “When we look across the universe of active global equity managers, we find that the overwhelming majority have been materially underweight to these large US technology companies,” said Mercer Chief Investment Officer Graeme Miller, who manages A$74 billion ($48 billion) in assets.

          LegalSuper, which has A$7 billion in assets, uses completion portfolios to hedge concentrated exposures. Relying on external active managers usually “means that you’re underweight the big mega caps,” said interim CIO Andrew Lill. “As a result, there’s an increasing need to reduce active risk,” through completion portfolios, he said.

          Still, they’re not a cure-all. AustralianSuper, the country’s largest pension with A$388 billion under management, uses completion portfolios but still blamed underweight exposure to megacap US tech in externally managed funds for lackluster returns last year.

          Others avoid them altogether. “There are some great alpha opportunities out there,” said Mark Rider, chief investment officer of Brighter Super, a A$35 billion fund, according to their website. A completion portfolio would “override” their contribution, he said.

          Benchmark Mismatches

          The strategy is also gaining traction in fixed income. Active bond managers are preferring corporate debt for higher yields, which creates a mismatch against benchmarks, according to Stuart Simmons, head of multi-asset solutions in the Liquid Markets Group for Queensland Investment Corp. As a result, more large investors are using completion portfolios to load up on US Treasuries exposure, Simmons added.

          Other investors have turned to the portfolios to manage risk across asset classes, aligning exposure to growth proxies in stocks, bonds and commodities, said Sam Watkins, who heads business in Australia and New Zealand at Pimco.

          “What has changed is that it was a very narrow subset that we were dealing with in the past, and that now has broadened into a much larger group,” Watkins said, referring to the use of the strategy.

          (Updates fifth paragraph to show recent pullback in tech stocks. An earlier version corrected the spelling of Stuart Simmons)

          ©2025 Bloomberg L.P.

          Risk Warnings and Disclaimers
          You understand and acknowledge that there is a high degree of risk involved in trading. Following any strategies or investment methods may lead to potential losses. The content on the site is provided by our contributors and analysts for information purposes only. You are solely responsible for determining whether any trading assets, securities, strategy, or any other product is suitable for investing based on your own investment objectives and financial situation.
          Add to Favorites
          Share

          US stock futures flounder amid tech weakness, Fed caution

          Investing.com
          Meta Platforms
          -1.30%
          Advanced Micro Devices
          -4.81%
          Lowe's Companies
          -0.32%
          Walmart
          0.00%
          NVIDIA
          -3.27%

          Investing.com-- U.S. stock index futures moved little on Wednesday evening as sustained weakness in technology shares and growing uncertainty over the Federal Reserve’s plans for interest rates kept investors to the sidelines.

          Futures were muted after a negative session on Wall Street, where declines in tech shares and hawkish signals from the Fed largely offset some positive retail earnings.

          S&P 500 Futures fell slightly to 6,411.25 points, while Nasdaq 100 Futures were flat at 23,323.50 points by 19:14 ET (23:14 GMT). Dow Jones Futures fell 0.1% to 44,973.0 points. 

          Tech shares see extended losses on AI doubts 

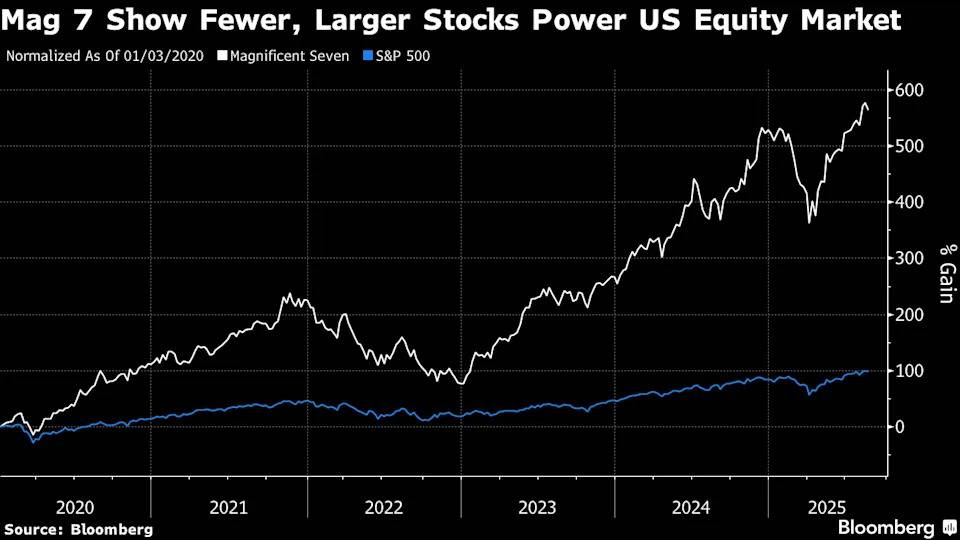
          Tech shares saw another day of outsized selling, with the so-called Magnificent Seven Complex sinking between 0.1% and 2%. Apple (NASDAQ:AAPL) was the worst performer with a near 2% drop, while Nvidia (NASDAQ:NVDA) fell the least after steep losses earlier this week.

          Tech shares were hit chiefly by growing doubts over the profitability of artificial intelligence, especially following a highly critical report released from a branch of the Massachusetts Institute of Technology.

          The report said 95% of organizations were seeing “zero return” on their AI investments, raising doubts over the hype around AI, which has been a key drive of Wall Street and tech stocks this year. 

          The report comes just a week before quarterly earnings from AI bellwether Nvidia, which will be closely watched for more cues on the fast-growing industry. 

          OpenAI CEO Sam Altman had also warned late last week that an AI bubble may be forming.

          Losses in tech saw the S&P 500 close down 0.2% at 6,395.79 points on Wednesday. The NASDAQ Composite fell 0.7% to 21,172.86 points, while the Dow Jones Industrial Average was flat at 44,938.06 points. 

          Fed minutes ring hawkish as Jackson Hole looms 

          Wall Street indexes were also spooked by somewhat hawkish signals from the minutes of the Fed’s July meeting.

          The minutes showed a bulk of Fed members largely supported the central bank’s wait-and-see approach to cutting interest rates, amid caution over the inflationary impact of President Donald Trump’s trade tariffs. 

          The central bank was also seen prioritizing inflation risks over fears of a decline in the U.S. labor market, which could elicit another hold in September.

          Markets were seen trimming their bets on a September rate cut after the minutes. Fed fund futures are pricing in a 80.6% chance the Fed will cut rates by 25 basis points in September, down from yesterday’s probability of 84.4%, CME Fedwatch showed. 

          Fed Chair Jerome Powell is now set to speak at the Jackson Hole Symposium on Friday, offering up more cues on policy. Powell’s address comes after some soft readings on consumer inflation and payrolls in July, which had boosted expectations for a September rate cut.

          Retail earnings spur limited cheer, Walmart awaited 

          Some positive quarterly earnings from major retailers TJX Companies Inc (NYSE:TJX) and Lowe’s Companies Inc (NYSE:LOW) did little to lift Wall Street, with both stocks logging small gains.

          Target slid nearly 7% even as its earnings beat relatively low expectations. The company named insider Michael Fiddelke as its new CEO, replacing long-time CEO Brian Cornell.

          Retail giant Walmart Inc (NYSE:WMT) is now set to report earnings on Thursday, offering up more cues on the U.S. consumer.

          Risk Warnings and Disclaimers
          You understand and acknowledge that there is a high degree of risk involved in trading. Following any strategies or investment methods may lead to potential losses. The content on the site is provided by our contributors and analysts for information purposes only. You are solely responsible for determining whether any trading assets, securities, strategy, or any other product is suitable for investing based on your own investment objectives and financial situation.
          Add to Favorites
          Share

          Best megacap bank stocks to buy now, according to WarrenAI

          Investing.com
          JPMorgan
          +0.36%
          Meta Platforms
          -1.30%
          Wells Fargo & Co.
          +0.18%
          NVIDIA
          -3.27%
          Tesla
          +2.70%

          Investing.com -- Megacap bank stocks present varying opportunities for investors, with some offering significant value while others trade at premium prices. According to a recent analysis by WarrenAI using Investing Pro’s Fair Value metrics, Pro scores, technical indicators, and analyst price targets, certain banking giants stand out more than others.

          The analysis reveals a clear hierarchy among the four largest U.S. banks, with value-oriented opportunities leading the pack while quality names command premium valuations. Here’s how these financial powerhouses rank:

          1. Citigroup (NYSE:C) emerges as the top pick with an impressive Fair Value Upside of 32.1%, the highest among all four megabanks. The stock presents a classic turnaround/value play with solid technical buy signals and "FAIR" health ratings. Analyst price targets suggest a 9.4% upside, which, while lower than the Fair Value estimate, still represents the highest pure value among peers. Technically, Citigroup shows Buy signals on daily charts and Strong Buy indicators on weekly timeframes. Despite some overbought weekly signals, upward momentum remains the dominant force.

          In other news, Fitch Ratings affirmed Citigroup’s ’A’ rating with a stable outlook. The bank is also exploring stablecoin custody services and appointed a new head to lead its private credit origination in North America.

          2. Bank of America (NYSE:BAC) claims the second spot with a Fair Value Upside of 28.2%, nearly matching Citigroup’s value proposition but with even stronger technical momentum. Analyst targets confirm upside potential at 13.8%. While not offering the same deep-value opportunity as Citigroup, Bank of America stands out as a technical favorite with Strong Buy ratings across all timeframes. The stock appears overbought but enjoys strong consensus support from technical indicators and moving averages.

          According to Bank of America’s own analysis, credit card delinquencies appear to have reached their peak. Additionally, the bank is one of the owners of Zelle operator Early Warning Services, which was sued by the New York Attorney General over alleged fraud protection failures.

          3. Wells Fargo (NYSE:WFC) ranks third with a Fair Value Upside of 28.8%, comparable to Bank of America’s value proposition. However, mixed technical signals and a lower Pro Score place it below its peers. Analysts see a more modest 6.8% upside potential. Wells Fargo displays mixed/neutral daily technicals, neutral weekly indicators, though with some underlying strength detected in the analysis.

          Wells Fargo announced plans to appoint CEO Charlie Scharf as chairman of the board. The company is also expanding its partnership with Google (NASDAQ:GOOGL) Cloud to deploy artificial intelligence agents within the bank.

          4. JP Morgan (NYSE:JPM) rounds out the list as the quality leader but value laggard. Despite its reputation for size and stability, JP Morgan actually trades 12.8% above its Fair Value, making it the only overvalued stock among the four megabanks. Analysts project a modest 5.3% upside, the lowest among the group. While JP Morgan shows Strong Buy signals on both daily and weekly charts, the negative Fair Value Upside suggests limited "bargain" potential for value-oriented investors.

          Following strong second-quarter results that surpassed earnings expectations, Freedom Broker raised its price target on JPMorgan Chase. The bank also recently reached a milestone by opening its 1,000th new branch as part of its 2018 expansion initiative.

          Looking for a deeper dive into the bank sector, or other stocks: try WarrenAI free today here: https://www.investing.com/warrenai/

          This article was generated with the support of AI and reviewed by an editor. For more information see our T&C.

          Risk Warnings and Disclaimers
          You understand and acknowledge that there is a high degree of risk involved in trading. Following any strategies or investment methods may lead to potential losses. The content on the site is provided by our contributors and analysts for information purposes only. You are solely responsible for determining whether any trading assets, securities, strategy, or any other product is suitable for investing based on your own investment objectives and financial situation.
          Add to Favorites
          Share

          As Nasdaq stumbles again, investors start to wonder: Have Big Tech stocks finally peaked?

          MarketWatch
          Bank of America
          +1.06%
          NVIDIA
          -3.27%
          Palantir Technologies Inc. Class A Common Stock
          -2.12%

          By Christine Ji

          The winning streak for mega-cap tech stocks might finally be over

          A major market shift could end Big Tech's dominance, according to Bank of America.

          As the biggest names in tech lead the market lower, investors are wondering if the sector is selling off for good.

          Tech stocks tumbled for the second day in a row Wednesday, with the Nasdaq Composite Index COMP shedding 0.7% after falling 1.5% on Tuesday. Notable losers included Nvidia Corp. (NVDA), which has fallen roughly 4% since Tuesday's open, and Palantir Technologies Inc. (PLTR), which has fallen around 16% in a six-session losing streak.

          While past downturns have proved to be fleeting, there are signs that the tech sector's reckoning may have finally arrived. A combination of higher inflation and Fed rate cuts points to the end of mega-cap dominance, Savita Subramanian, Bank of America's head of U.S. equity and quantitative strategy, said in a recent note.

          In the past two months, Bank of America's U.S. "regime indicator," an economic model that tracks the U.S. business cycle, signaled a shift from a "downturn" to a "recovery," Subramanian said in the note.

          In the past, that's spelled bad news for the biggest stocks and good news for everyone else. In previous recoveries, the largest 50 stocks in the S&P 500 Index SPX lagged the rest of the market by an average of 3.3 percentage points a year, while the other 450 stocks' price-to-earnings ratios expanded twice as much as the top 50.

          With the market pricing in a September interest-rate cut, Subramanian sees even more reason for a sustained rotation out of mega-caps.

          "Easing has been accompanied by mega-caps lagging more than leading, and higher inflation should support a broadening of the S&P 500 beyond defensives/secular growth," Subramanian wrote. Historically, in the three months after an initial rate cut, value stocks with low forward price-to-earnings ratios have outperformed growth stocks, according to Bank of America.

          There are mega-cap companies in every sector, but the technology sector is home to the market's largest and most influential names, with the so-called Magnificent Seven representing roughly a third of the entire S&P 500's market cap. And with companies like Nvidia trading at 34.2 times forward earnings - not to mention Palantir at a staggering 156 times, according to FactSet data - the sector looks particularly vulnerable for a rotation.

          "If the Fed's next move is a rate cut, and if the regime indicator is shifting to a recovery, we think the run may be closer to done," Subramanian said.

          Also read: The entire stock market is being carried by these four AI stocks

          While there wasn't a specific catalyst that triggered the tech selloff, concerns about an artificial-intelligence capital-expenditure bubble and stretched valuations loom over the tech sector.

          However, some analysts remain staunch supporters of a continued tech rally.

          Dan Ives of Wedbush Securities believes the AI growth story is simply too strong to be derailed. In a note published Tuesday, Ives said that while headlines about tariffs and Intel Corp. (INTC) could lead to near-term volatility, the underlying demand for AI solutions remains strong. He encouraged investors to take the opportunity to buy the dip.

          "Names like Palantir will further grow into their valuations over the coming years, in our view," Ives wrote. "While healthy pullbacks will happen...we believe Palantir is a trillion market cap in the next 2-3 years given its AI secret sauce that is disrupting the software landscape like an earthquake."

          Investors will get another read on the sustainability of the AI boom next week, when Nvidia reports its second-quarter earnings.

          Don't miss: Why the Russell 2000 has a real chance to beat the S&P 500 - finally

          -Christine Ji

          This content was created by MarketWatch, which is operated by Dow Jones & Co. MarketWatch is published independently from Dow Jones Newswires and The Wall Street Journal.

          Risk Warnings and Disclaimers
          You understand and acknowledge that there is a high degree of risk involved in trading. Following any strategies or investment methods may lead to potential losses. The content on the site is provided by our contributors and analysts for information purposes only. You are solely responsible for determining whether any trading assets, securities, strategy, or any other product is suitable for investing based on your own investment objectives and financial situation.
          Add to Favorites
          Share

          Colombia stocks higher at close of trade; COLCAP up 0.10%

          Investing.com
          Meta Platforms
          -1.30%
          NVIDIA
          -3.27%
          Tesla
          +2.70%
          Advanced Micro Devices
          -4.81%
          Alphabet-A
          -1.01%

          Investing.com – Colombia stocks were higher after the close on Wednesday, as gains in the Industrials, Services and Agriculture sectors led shares higher.

          At the close in Colombia, the COLCAP rose 0.10%.

          The best performers of the session on the COLCAP were Corporacion Financiera Colombiana SA (BVC:CFV), which rose 5.36% or 960.00 points to trade at 18,860.00 at the close. Meanwhile, Banco De Bogota SA (BVC:BBO) added 2.76% or 940.00 points to end at 35,000.00 and Grupo Aval Acciones y Valores SA Pref (BVC:GAA_p) was up 2.52% or 16.00 points to 650.00 in late trade.

          The worst performers of the session were Canacol Energy Ltd (BVC:CNE), which fell 2.37% or 120.00 points to trade at 4,950.00 at the close. Celsia SA (BVC:CEL) declined 1.64% or 80.00 points to end at 4,805.00 and Promigas (BVC:PMG) was down 1.33% or 90.00 points to 6,680.00.

          Falling stocks outnumbered advancing ones on the Colombia Stock Exchange by 0 to 0.

          Shares in Banco De Bogota SA (BVC:BBO) rose to 52-week highs; rising 2.76% or 940.00 to 35,000.00. Shares in Grupo Aval Acciones y Valores SA Pref (BVC:GAA_p) rose to 52-week highs; up 2.52% or 16.00 to 650.00.

          US coffee C for December delivery was up 1.25% or 4.35 to $353.40 . Elsewhere in commodities trading, US cocoa for delivery in December fell 2.89% or 236.00 to hit $7,942.00 , while the December Gold Futures contract rose 1.00% or 33.45 to trade at $3,392.15 a troy ounce.

          USD/COP was down 0.06% to 4,023.74, while BRL/COP fell 0.06% to 734.00.

          The US Dollar Index Futures was up 0.04% at 98.16.

          Risk Warnings and Disclaimers
          You understand and acknowledge that there is a high degree of risk involved in trading. Following any strategies or investment methods may lead to potential losses. The content on the site is provided by our contributors and analysts for information purposes only. You are solely responsible for determining whether any trading assets, securities, strategy, or any other product is suitable for investing based on your own investment objectives and financial situation.
          Add to Favorites
          Share

          Russia stocks lower at close of trade; MOEX Russia Index down 0.90%

          Investing.com
          Glatfelter
          -0.74%
          Amazon
          -1.78%
          NVIDIA
          -3.27%
          Netflix
          +1.17%
          Apple
          +0.09%

          Investing.com – Russia stocks were lower after the close on Wednesday, as losses in the Oil & Gas, Mining and Power sectors led shares lower.

          At the close in Moscow, the MOEX Russia Index lost 0.90%.

          The best performers of the session on the MOEX Russia Index were Rostelekom PJSC (MCX:RTKM), which rose 0.82% or 0.57 points to trade at 70.50 at the close. Meanwhile, Polyus PJSC (MCX:PLZL) added 0.42% or 9.00 points to end at 2,146.80 and Mobil’nye Telesistemy PJSC (MCX:MTSS) was up 0.29% or 0.65 points to 226.25 in late trade.

          The worst performers of the session were NOVATEK PJSC (MCX:NVTK), which fell 2.85% or 35.60 points to trade at 1,215.00 at the close. Magnitogorskiy Metallurgicheskiy Kombinat PAO (MCX:MAGN) declined 2.35% or 0.84 points to end at 34.71 and Aeroflot PJSC (MCX:AFLT) was down 2.23% or 1.50 points to 65.83.

          Falling stocks outnumbered advancing ones on the Moscow Stock Exchange by 166 to 74 and 9 ended unchanged.

          The Russian Volatility Index – RVI, which measures the implied volatility of MOEX Russia Index options, was up 1.51% to 38.32.

          Gold Futures for December delivery was up 1.00% or 33.45 to $3,392.15 a troy ounce. Elsewhere in commodities trading, Crude oil for delivery in October rose 1.76% or 1.09 to hit $62.86 a barrel, while the October Brent oil contract unchanged 0.00% or 0.00 to trade at $66.94 a barrel.

          USD/RUB was unchanged 0.00% to 80.71, while EUR/RUB unchanged 0.00% to 93.79.

          The US Dollar Index Futures was up 0.04% at 98.16.

          Risk Warnings and Disclaimers
          You understand and acknowledge that there is a high degree of risk involved in trading. Following any strategies or investment methods may lead to potential losses. The content on the site is provided by our contributors and analysts for information purposes only. You are solely responsible for determining whether any trading assets, securities, strategy, or any other product is suitable for investing based on your own investment objectives and financial situation.
          Add to Favorites
          Share

          CVS Health won’t cover Gilead’s new HIV prevention drug Yeztugo - Reuters

          Investing.com
          Advanced Micro Devices
          -4.81%
          Apple
          +0.09%
          Arcosa
          -1.89%
          Harte Hanks
          +8.14%
          Netflix
          +1.17%

          Investing.com -- CVS Health (NYSE:CVS) will not include Gilead Sciences (NASDAQ:GILD)’ new HIV prevention drug Yeztugo in its commercial plans for the time being, despite the medication’s proven effectiveness.

          CVS, which operates the largest pharmacy benefit manager in the United States, made this decision based on clinical, financial, and regulatory considerations, according to company spokesperson David Whitrap, as reported by Reuters.

          The twice-yearly injection, which carries a U.S. list price exceeding $28,000 annually, will also not be covered under CVS’s Affordable Care Act formularies. Whitrap explained that CVS’s ACA preventive program follows recommendations and mandates from the U.S. Department of Health and Human Services.

          Current HIV prevention recommendations from the U.S. Preventive Services Task Force, which is supported by HHS, only include three older medications.

          A source familiar with the matter indicated that Gilead is still in negotiations with CVS regarding Yeztugo coverage.

          Mitchell Warren, executive director of AIDS nonprofit AVAC, called the decision "a grave disappointment and frankly a missed opportunity," adding that it "reflects a price that is too high and a U.S. pharmaceutical pricing structure that is frankly not sustainable."

          This article was generated with the support of AI and reviewed by an editor. For more information see our T&C.

          Risk Warnings and Disclaimers
          You understand and acknowledge that there is a high degree of risk involved in trading. Following any strategies or investment methods may lead to potential losses. The content on the site is provided by our contributors and analysts for information purposes only. You are solely responsible for determining whether any trading assets, securities, strategy, or any other product is suitable for investing based on your own investment objectives and financial situation.
          Add to Favorites
          Share
          FastBull
          Copyright © 2025 FastBull Ltd

          728 RM B 7/F GEE LOK IND BLDG NO 34 HUNG TO RD KWUN TONG KLN HONG KONG

          TelegramInstagramTwitterfacebooklinkedin
          App Store Google Play Google Play
          Products
          Charts

          Chats

          Q&A with Experts
          Screeners
          Economic Calendar
          Data
          Tools
          Membership
          Features
          Function
          Markets
          Copy Trading
          Latest Signals
          Contests
          News
          Analysis
          24/7
          Columns
          Education
          Company
          Careers
          About Us
          Contact Us
          Advertising
          Help Center
          Feedback
          User Agreement
          Privacy Policy
          Business

          White Label

          Data API

          Web Plug-ins

          Poster Maker

          Affiliate Program

          Risk Disclosure

          The risk of loss in trading financial instruments such as stocks, FX, commodities, futures, bonds, ETFs and crypto can be substantial. You may sustain a total loss of the funds that you deposit with your broker. Therefore, you should carefully consider whether such trading is suitable for you in light of your circumstances and financial resources.

          No decision to invest should be made without thoroughly conducting due diligence by yourself or consulting with your financial advisors. Our web content might not suit you since we don't know your financial conditions and investment needs. Our financial information might have latency or contain inaccuracy, so you should be fully responsible for any of your trading and investment decisions. The company will not be responsible for your capital loss.

          Without getting permission from the website, you are not allowed to copy the website's graphics, texts, or trademarks. Intellectual property rights in the content or data incorporated into this website belong to its providers and exchange merchants.

          Not Logged In

          Log in to access more features

          FastBull Membership

          Not yet

          Purchase

          Become a signal provider
          Help Center
          Customer Service
          Dark Mode
          Price Up/Down Colors

          Log In

          Sign Up

          Position
          Layout
          Fullscreen
          Default to Chart
          The chart page opens by default when you visit fastbull.com