• Trade
  • Markets
  • Copy
  • Contests
  • News
  • 24/7
  • Calendar
  • Q&A
  • Chats
Trending
Screeners
SYMBOL
LAST
BID
ASK
HIGH
LOW
NET CHG.
%CHG.
SPREAD
SPX
S&P 500 Index
6800.25
6800.25
6800.25
6819.26
6759.73
-16.26
-0.24%
--
DJI
Dow Jones Industrial Average
48114.25
48114.25
48114.25
48452.17
47946.25
-302.30
-0.62%
--
IXIC
NASDAQ Composite Index
23111.45
23111.45
23111.45
23162.60
22920.66
+54.05
+ 0.23%
--
USDX
US Dollar Index
97.930
98.010
97.930
97.940
97.790
+0.030
+ 0.03%
--
EURUSD
Euro / US Dollar
1.17376
1.17383
1.17376
1.17520
1.17366
-0.00091
-0.08%
--
GBPUSD
Pound Sterling / US Dollar
1.34085
1.34092
1.34085
1.34265
1.34061
-0.00122
-0.09%
--
XAUUSD
Gold / US Dollar
4317.37
4317.75
4317.37
4327.70
4301.37
+15.08
+ 0.35%
--
WTI
Light Sweet Crude Oil
55.771
55.808
55.771
55.966
54.927
+0.832
+ 1.51%
--

Community Accounts

Signal Accounts
--
Profit Accounts
--
Loss Accounts
--
View More

Become a signal provider

Sell trading signals to earn additional income

View More

Guide to Copy Trading

Get started with ease and confidence

View More

Signal Accounts for Members

All Signal Accounts

Best Return
  • Best Return
  • Best P/L
  • Best MDD
Past 1W
  • Past 1W
  • Past 1M
  • Past 1Y

All Contests

  • All
  • Trump Updates
  • Recommend
  • Stocks
  • Cryptocurrencies
  • Central Banks
  • Featured News
Top News Only
Share

HK Budget Consultation Begins: Paul Chan Sees Expanding Economic Development, Creating Jobs As Key Tasks

Share

The Main Shanghai Silver Futures Contract Rose Nearly 5% To 15,475 Yuan/kg, Setting A New Historical High, And Has Risen More Than 106% Year-to-date

Share

New South Wales Premier Chris Minns: Looking At Reforms To Not Accept Applications For Protests After Terror Events

Share

New South Wales Premier Chris Minns: To Recall State Parliament To Discuss Urgent Legislation On Firearms

Share

Russia - China Far Eastern Gas Route Construction Progressing, China Ambassador To Russia Tells RIA

Share

Spot Silver Rose 3.00% On The Day, Currently Trading At $65.64 Per Ounce

Share

South Korean Won Falls As Much As 0.6% To 1482.10 Per USA Dollar, Lowest Since April 9

Share

South Korea Forex Authority: Resumes Currency Swap With Bank Of Korea

Share

Wsj's Timiraos: Latest US Employment Data May Not Prompt Further Rate Cuts By Fed Next Month

Share

Robinhood: Introduces Next Generation Of Robinhood Cortex, To Roll Out In Q1 Of Next Year To Robinhood Gold Subscribers

Share

Trump Blockade Is "Absolutely Irrational", Violates Free Commerce And Navigability-Venezuela Government

Share

India's Central Bank Governor Sanjay Malhotra Signals Rates To Stay Low For 'Long Period'

Share

India Central Bank Governor: Impact Of US Trade Deal Could Be As Much As About Half A Percentage Point

Share

Indonesia Employers Association:New Rule Would See Indonesia Provincial Minimum Wage Increase In 2026 At Range Of 5.3% To 7.3%

Share

Japan's Nikkei Share Average Reverses Losses, Last Up 0.13%

Share

The Main Palladium Futures Contract Continued To Rise, With An Intraday Increase Of 5.00%, Currently Trading At 448.6 Yuan/gram

Share

Spot Silver Rises To Hit $65/Oz For The First Time

Share

Spot Silver Broke Through The Previous High Of $64.658 Per Ounce, Setting A New All-time High, And Rose 1.43% On The Day

Share

Spot Silver Rises More Than 1% To Hit Record High At $64.65/Oz

Share

Spot Silver Rose 1.00% On The Day, Currently Trading At $64.37 Per Ounce. New York Silver Futures Rose More Than 2.00% On The Day, Currently Trading At $64.59 Per Ounce

TIME
ACT
FCST
PREV
U.S. Average Hourly Wage MoM (SA) (Oct)

A:--

F: --

P: --

U.S. Average Hourly Wage YoY (Oct)

A:--

F: --

P: --

U.S. Retail Sales (Oct)

A:--

F: --

P: --

U.S. Core Retail Sales MoM (Oct)

A:--

F: --

P: --
U.S. Core Retail Sales (Oct)

A:--

F: --

P: --

U.S. Retail Sales MoM (Oct)

A:--

F: --

P: --
U.S. Private Nonfarm Payrolls (SA) (Oct)

A:--

F: --

P: --
U.S. Average Weekly Working Hours (SA) (Oct)

A:--

F: --

P: --

U.S. Labor Force Participation Rate (SA) (Nov)

A:--

F: --

P: --

U.S. Retail Sales YoY (Oct)

A:--

F: --

P: --

U.S. Manufacturing Employment (SA) (Oct)

A:--

F: --

P: --
U.S. Government Employment (Nov)

A:--

F: --

P: --

U.S. Weekly Redbook Index YoY

A:--

F: --

P: --

U.S. IHS Markit Manufacturing PMI Prelim (SA) (Dec)

A:--

F: --

P: --

U.S. IHS Markit Composite PMI Prelim (SA) (Dec)

A:--

F: --

P: --

U.S. IHS Markit Services PMI Prelim (SA) (Dec)

A:--

F: --

P: --

U.S. Commercial Inventory MoM (Sept)

A:--

F: --

P: --

BOC Gov Macklem Speaks
Argentina GDP YoY (Constant Prices) (Q3)

A:--

F: --

P: --

U.S. API Weekly Gasoline Stocks

A:--

F: --

P: --

U.S. API Weekly Cushing Crude Oil Stocks

A:--

F: --

P: --

U.S. API Weekly Refined Oil Stocks

A:--

F: --

P: --

U.S. API Weekly Crude Oil Stocks

A:--

F: --

P: --

Australia Westpac Leading Index MoM (Nov)

A:--

F: --

P: --
Japan Trade Balance (Not SA) (Nov)

A:--

F: --

P: --

Japan Goods Trade Balance (SA) (Nov)

A:--

F: --

P: --

Japan Imports YoY (Nov)

A:--

F: --

P: --

Japan Exports YoY (Nov)

A:--

F: --

P: --

Japan Core Machinery Orders YoY (Oct)

A:--

F: --

P: --

Japan Core Machinery Orders MoM (Oct)

A:--

F: --

P: --

U.K. Core CPI MoM (Nov)

--

F: --

P: --

U.K. Inflation Rate Expectations

--

F: --

P: --

U.K. Core Retail Prices Index YoY (Nov)

--

F: --

P: --

U.K. Core CPI YoY (Nov)

--

F: --

P: --

U.K. Output PPI MoM (Not SA) (Nov)

--

F: --

P: --

U.K. Output PPI YoY (Not SA) (Nov)

--

F: --

P: --

U.K. Input PPI YoY (Not SA) (Nov)

--

F: --

P: --

U.K. CPI YoY (Nov)

--

F: --

P: --

U.K. Retail Prices Index MoM (Nov)

--

F: --

P: --

U.K. CPI MoM (Nov)

--

F: --

P: --

U.K. Input PPI MoM (Not SA) (Nov)

--

F: --

P: --

U.K. Retail Prices Index YoY (Nov)

--

F: --

P: --

Indonesia 7-Day Reverse Repo Rate

--

F: --

P: --

Indonesia Deposit Facility Rate (Dec)

--

F: --

P: --

Indonesia Lending Facility Rate (Dec)

--

F: --

P: --

Indonesia Loan Growth YoY (Nov)

--

F: --

P: --

South Africa Core CPI YoY (Nov)

--

F: --

P: --

South Africa CPI YoY (Nov)

--

F: --

P: --

Germany Ifo Business Expectations Index (SA) (Dec)

--

F: --

P: --

Germany Ifo Current Business Situation Index (SA) (Dec)

--

F: --

P: --

Germany IFO Business Climate Index (SA) (Dec)

--

F: --

P: --

Euro Zone Core CPI Final MoM (Nov)

--

F: --

P: --

Euro Zone Labor Cost YoY (Q3)

--

F: --

P: --

Euro Zone Core HICP Final YoY (Nov)

--

F: --

P: --

Euro Zone Core HICP Final MoM (Nov)

A:--

F: --

P: --

Euro Zone Core CPI Final YoY (Nov)

--

F: --

P: --

Euro Zone HICP MoM (Excl. Food & Energy) (Nov)

--

F: --

P: --

Euro Zone CPI YoY (Excl. Tobacco) (Nov)

--

F: --

P: --

Euro Zone HICP Final YoY (Nov)

--

F: --

P: --

Euro Zone HICP Final MoM (Nov)

--

F: --

P: --

Q&A with Experts
    • All
    • Chatrooms
    • Groups
    • Friends
    Connecting
    .
    .
    .
    Type here...
    Add Symbol or Code

      No matching data

      All
      Trump Updates
      Recommend
      Stocks
      Cryptocurrencies
      Central Banks
      Featured News
      • All
      • Russia-Ukraine Conflict
      • Middle East Flashpoint
      • All
      • Russia-Ukraine Conflict
      • Middle East Flashpoint
      Search
      Products

      Charts Free Forever

      Chats Q&A with Experts
      Screeners Economic Calendar Data Tools
      Membership Features
      Data Warehouse Market Trends Institutional Data Policy Rates Macro

      Market Trends

      Market Sentiment Order Book Forex Correlations

      Top Indicators

      Charts Free Forever
      Markets

      News

      News Analysis 24/7 Columns Education
      From Institutions From Analysts
      Topics Columnists

      Latest Views

      Latest Views

      Trending Topics

      Top Columnists

      Latest Update

      Signals

      Copy Rankings Latest Signals Become a signal provider AI Rating
      Contests
      Brokers

      Overview Brokers Assessment Rankings Regulators News Claims
      Broker listing Forex Brokers Comparison Tool Live Spread Comparison Scam
      Q&A Complaint Scam Alert Videos Tips to Detect Scam
      More

      Business
      Events
      Careers About Us Advertising Help Center

      White Label

      Data API

      Web Plug-ins

      Affiliate Program

      Awards Institution Evaluation IB Seminar Salon Event Exhibition
      Vietnam Thailand Singapore Dubai
      Fans Party Investment Sharing Session
      FastBull Summit BrokersView Expo
      Recent Searches
        Top Searches
          Markets
          News
          Analysis
          User
          24/7
          Economic Calendar
          Education
          Data
          • Names
          • Latest
          • Prev

          View All

          No data

          Scan to Download

          Faster Charts, Chat Faster!

          Download App
          English
          • English
          • Español
          • العربية
          • Bahasa Indonesia
          • Bahasa Melayu
          • Tiếng Việt
          • ภาษาไทย
          • Français
          • Italiano
          • Türkçe
          • Русский язык
          • 简中
          • 繁中
          Open Account
          Search
          Products
          Charts Free Forever
          Markets
          News
          Signals

          Copy Rankings Latest Signals Become a signal provider AI Rating
          Contests
          Brokers

          Overview Brokers Assessment Rankings Regulators News Claims
          Broker listing Forex Brokers Comparison Tool Live Spread Comparison Scam
          Q&A Complaint Scam Alert Videos Tips to Detect Scam
          More

          Business
          Events
          Careers About Us Advertising Help Center

          White Label

          Data API

          Web Plug-ins

          Affiliate Program

          Awards Institution Evaluation IB Seminar Salon Event Exhibition
          Vietnam Thailand Singapore Dubai
          Fans Party Investment Sharing Session
          FastBull Summit BrokersView Expo

          Nyse Content Advisory: Pre-Market Update + S&P 500 Hits 28Th Record In 2025

          Reuters
          CompoSecure
          0.00%
          Intercontinental Exchange
          -0.54%
          Resolute Holdings Management Common Stock Ex-distribution When-Issued
          0.00%
          Risk Warnings and Disclaimers
          You understand and acknowledge that there is a high degree of risk involved in trading. Following any strategies or investment methods may lead to potential losses. The content on the site is provided by our contributors and analysts for information purposes only. You are solely responsible for determining whether any trading assets, securities, strategy, or any other product is suitable for investing based on your own investment objectives and financial situation.
          Add to Favorites
          Share

          Dj Nasdaq Inc. Stock Slips 4.5%, Underperforms Peers

          Reuters
          CME Group
          +0.28%
          Intercontinental Exchange
          -0.54%
          Nasdaq
          0.00%
          Risk Warnings and Disclaimers
          You understand and acknowledge that there is a high degree of risk involved in trading. Following any strategies or investment methods may lead to potential losses. The content on the site is provided by our contributors and analysts for information purposes only. You are solely responsible for determining whether any trading assets, securities, strategy, or any other product is suitable for investing based on your own investment objectives and financial situation.
          Add to Favorites
          Share

          3 Low-Volatility Stocks We Find Risky

          Stock Story
          Yum China
          -1.33%
          Amneal Pharmaceuticals
          -2.33%
          Intercontinental Exchange
          -0.54%

          YUMC Cover Image

          A stock with low volatility can be reassuring, but it doesn’t always mean strong long-term performance. Investors who prioritize stability may miss out on higher-reward opportunities elsewhere.

          Luckily for you, StockStory helps you navigate which companies are truly worth holding. That said, here are three low-volatility stocks to steer clear of and a few better alternatives.

          Yum China (YUMC)

          Rolling One-Year Beta: 0.57

          One of China’s largest restaurant companies, Yum China is an independent entity spun off from Yum! Brands in 2016.

          Why Does YUMC Worry Us?

          • Disappointing same-store sales over the past two years show customers aren’t responding well to its menu offerings and dining experience
          • Projected sales growth of 4.8% for the next 12 months suggests sluggish demand
          • Challenging supply chain dynamics and bad unit economics are reflected in its low gross margin of 20.1%

          Yum China is trading at $43.95 per share, or 16.1x forward P/E. To fully understand why you should be careful with YUMC, check out our full research report (it’s free).

          Amneal (AMRX)

          Rolling One-Year Beta: 0.68

          Founded in 2002 and growing into one of America's largest generic drug producers, Amneal Pharmaceuticals develops, manufactures, and distributes generic medicines, specialty branded drugs, biosimilars, and injectable products for the U.S. healthcare market.

          Why Are We Cautious About AMRX?

          • Below-average returns on capital indicate management struggled to find compelling investment opportunities

          At $10 per share, Amneal trades at 14.2x forward P/E. Dive into our free research report to see why there are better opportunities than AMRX.

          Intercontinental Exchange (ICE)

          Rolling One-Year Beta: 0.56

          Starting as an energy trading platform in 2000 before acquiring the iconic New York Stock Exchange in 2013, Intercontinental Exchange operates global financial exchanges, clearing houses, and provides data services and mortgage technology solutions to financial institutions and corporations.

          Why Do We Think Twice About ICE?

          • Incremental sales over the last five years were less profitable as its 8.6% annual earnings per share growth lagged its revenue gains

          Intercontinental Exchange’s stock price of $175.99 implies a valuation ratio of 23.9x forward P/E. If you’re considering ICE for your portfolio, see our FREE research report to learn more.

          High-Quality Stocks for All Market Conditions

          Trump’s April 2025 tariff bombshell triggered a massive market selloff, but stocks have since staged an impressive recovery, leaving those who panic sold on the sidelines.

          Take advantage of the rebound by checking out our Top 5 Growth Stocks for this month. This is a curated list of our High Quality stocks that have generated a market-beating return of 183% over the last five years (as of March 31st 2025).

          Stocks that made our list in 2020 include now familiar names such as Nvidia (+1,545% between March 2020 and March 2025) as well as under-the-radar businesses like the once-small-cap company Comfort Systems (+782% five-year return).

          StockStory is growing and hiring equity analyst and marketing roles. Are you a 0 to 1 builder passionate about the markets and AI? See the open roles here.

          Risk Warnings and Disclaimers
          You understand and acknowledge that there is a high degree of risk involved in trading. Following any strategies or investment methods may lead to potential losses. The content on the site is provided by our contributors and analysts for information purposes only. You are solely responsible for determining whether any trading assets, securities, strategy, or any other product is suitable for investing based on your own investment objectives and financial situation.
          Add to Favorites
          Share

          Dj Cfo Fitzsimmons Surrenders 19250 Of Composecure Inc >Cmpo

          Reuters
          CompoSecure
          0.00%
          Risk Warnings and Disclaimers
          You understand and acknowledge that there is a high degree of risk involved in trading. Following any strategies or investment methods may lead to potential losses. The content on the site is provided by our contributors and analysts for information purposes only. You are solely responsible for determining whether any trading assets, securities, strategy, or any other product is suitable for investing based on your own investment objectives and financial situation.
          Add to Favorites
          Share

          Dj Coo Maes Surrenders 3452 Of Composecure Inc >Cmpo

          Reuters
          CompoSecure
          0.00%
          Risk Warnings and Disclaimers
          You understand and acknowledge that there is a high degree of risk involved in trading. Following any strategies or investment methods may lead to potential losses. The content on the site is provided by our contributors and analysts for information purposes only. You are solely responsible for determining whether any trading assets, securities, strategy, or any other product is suitable for investing based on your own investment objectives and financial situation.
          Add to Favorites
          Share

          Dj Officer Lowe Surrenders 14116 Of Composecure Inc >Cmpo

          Reuters
          CompoSecure
          0.00%
          Risk Warnings and Disclaimers
          You understand and acknowledge that there is a high degree of risk involved in trading. Following any strategies or investment methods may lead to potential losses. The content on the site is provided by our contributors and analysts for information purposes only. You are solely responsible for determining whether any trading assets, securities, strategy, or any other product is suitable for investing based on your own investment objectives and financial situation.
          Add to Favorites
          Share

          Q2 Earnings Outperformers: Intercontinental Exchange (NYSE:ICE) And The Rest Of The Financial Exchanges & Data Stocks

          Stock Story
          Intercontinental Exchange
          -0.54%
          Moody's
          +1.13%
          Tradeweb Markets
          -0.36%
          FactSet Research Systems
          +0.33%
          CME Group
          +0.28%

          ICE Cover Image

          The end of an earnings season can be a great time to discover new stocks and assess how companies are handling the current business environment. Let’s take a look at how Intercontinental Exchange and the rest of the financial exchanges & data stocks fared in Q2.

          Financial exchanges and data providers operate trading platforms and sell market information. They enjoy relatively stable revenue from trading fees and subscriptions, increasing demand for data analytics, and expansion opportunities in emerging markets. Challenges include regulatory oversight of market structure, competition from alternative trading venues, and substantial technology investments needed to maintain low-latency trading infrastructure and data security.

          The 9 financial exchanges & data stocks we track reported a mixed Q2. As a group, revenues beat analysts’ consensus estimates by 1%.

          Amidst this news, share prices of the companies have had a rough stretch. On average, they are down 5.5% since the latest earnings results.

          Intercontinental Exchange

          Starting as an energy trading platform in 2000 before acquiring the iconic New York Stock Exchange in 2013, Intercontinental Exchange operates global financial exchanges, clearing houses, and provides data services and mortgage technology solutions to financial institutions and corporations.

          Intercontinental Exchange reported revenues of $2.54 billion, up 9.8% year on year. This print was in line with analysts’ expectations, but overall, it was a mixed quarter for the company with a beat of analysts’ EPS estimates but a slight miss of analysts’ Exchanges segment estimates.

          Intercontinental Exchange Total Revenue

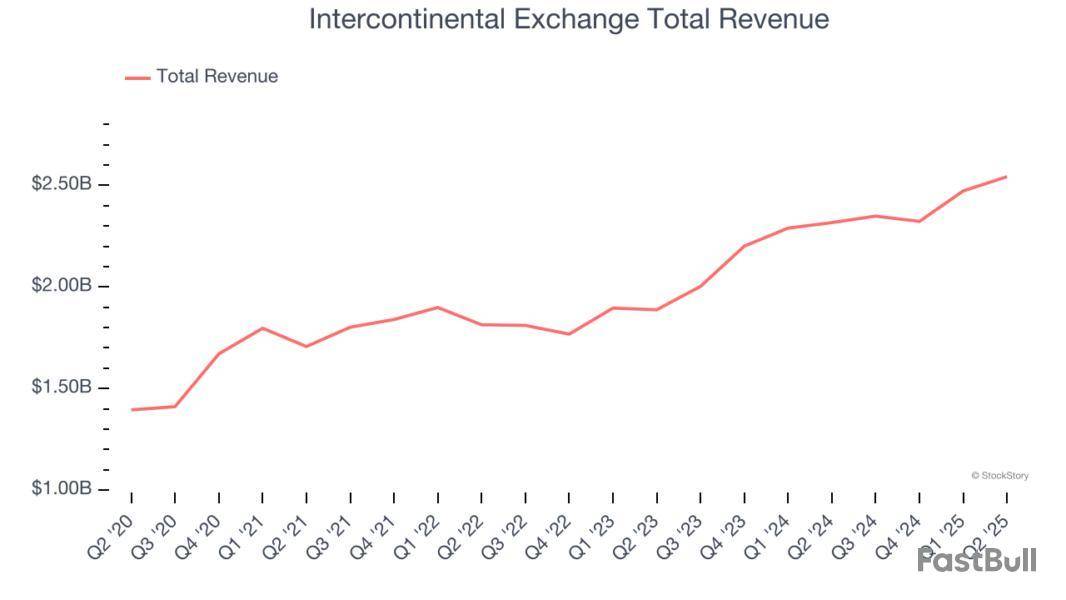
          Unsurprisingly, the stock is down 6.7% since reporting and currently trades at $173.46.

          Is now the time to buy Intercontinental Exchange? Access our full analysis of the earnings results here, it’s free.

          Best Q2: Moody's

          Founded in 1900 during America's railroad boom when investors needed reliable information on bond risks, Moody's provides credit ratings, risk assessment tools, and analytical solutions that help organizations evaluate financial risks and make informed investment decisions.

          Moody's reported revenues of $1.90 billion, up 4.5% year on year, outperforming analysts’ expectations by 2.9%. The business had a strong quarter with a solid beat of analysts’ Investor Services segment estimates and an impressive beat of analysts’ EBITDA estimates.

          Moody's Total Revenue

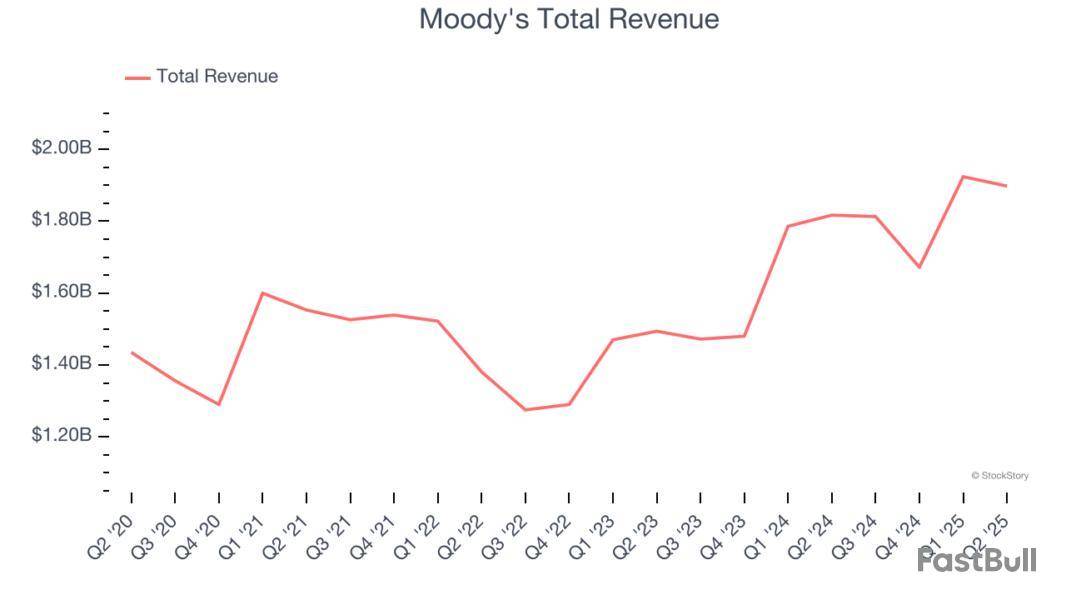
          Moody's delivered the biggest analyst estimates beat among its peers. The market seems content with the results as the stock is up 1.6% since reporting. It currently trades at $507.

          Is now the time to buy Moody's? Access our full analysis of the earnings results here, it’s free.

          Weakest Q2: Tradeweb Markets

          Founded in 1996 as one of the pioneers in electronic bond trading, Tradeweb Markets builds and operates electronic marketplaces that connect financial institutions for trading across rates, credit, equities, and money markets.

          Tradeweb Markets reported revenues of $513 million, up 26.7% year on year, in line with analysts’ expectations. It was a slower quarter as it posted a significant miss of analysts’ EPS estimates and transaction volumes in line with analysts’ estimates.

          As expected, the stock is down 13.7% since the results and currently trades at $119.26.

          Read our full analysis of Tradeweb Markets’s results here.

          FactSet

          Founded in 1978 when financial data was still primarily delivered through paper reports, FactSet provides financial data, analytics, and technology solutions that investment professionals use to research, analyze, and manage their portfolios.

          FactSet reported revenues of $585.5 million, up 5.9% year on year. This print surpassed analysts’ expectations by 0.7%. Taking a step back, it was a mixed quarter as it also produced a decent beat of analysts’ EBITDA estimates but a miss of analysts’ EPS estimates.

          The stock is down 11.8% since reporting and currently trades at $373.

          Read our full, actionable report on FactSet here, it’s free.

          CME Group

          Born from the Chicago Mercantile Exchange founded in 1898 as a butter and egg trading venue, CME Group operates the world's largest derivatives marketplace where traders can buy and sell futures and options contracts across interest rates, equities, currencies, commodities, and more.

          CME Group reported revenues of $1.69 billion, up 10.5% year on year. This number met analysts’ expectations. Aside from that, it was a mixed quarter as it underperformed in some other aspects of the business.

          The stock is down 5.2% since reporting and currently trades at $260.50.

          Read our full, actionable report on CME Group here, it’s free.

          Market Update

          The Fed’s interest rate hikes throughout 2022 and 2023 have successfully cooled post-pandemic inflation, bringing it closer to the 2% target. Inflationary pressures have eased without tipping the economy into a recession, suggesting a soft landing. This stability, paired with recent rate cuts (0.5% in September 2024 and 0.25% in November 2024), fueled a strong year for the stock market in 2024. The markets surged further after Donald Trump’s presidential victory in November, with major indices reaching record highs in the days following the election. Still, questions remain about the direction of economic policy, as potential tariffs and corporate tax changes add uncertainty for 2025.

          Risk Warnings and Disclaimers
          You understand and acknowledge that there is a high degree of risk involved in trading. Following any strategies or investment methods may lead to potential losses. The content on the site is provided by our contributors and analysts for information purposes only. You are solely responsible for determining whether any trading assets, securities, strategy, or any other product is suitable for investing based on your own investment objectives and financial situation.
          Add to Favorites
          Share
          FastBull
          Copyright © 2025 FastBull Ltd

          728 RM B 7/F GEE LOK IND BLDG NO 34 HUNG TO RD KWUN TONG KLN HONG KONG

          TelegramInstagramTwitterfacebooklinkedin
          App Store Google Play Google Play
          Products
          Charts

          Chats

          Q&A with Experts
          Screeners
          Economic Calendar
          Data
          Tools
          Membership
          Features
          Function
          Markets
          Copy Trading
          Latest Signals
          Contests
          News
          Analysis
          24/7
          Columns
          Education
          Company
          Careers
          About Us
          Contact Us
          Advertising
          Help Center
          Feedback
          User Agreement
          Privacy Policy
          Personal Information Protection Statement
          Business

          White Label

          Data API

          Web Plug-ins

          Poster Maker

          Affiliate Program

          Risk Disclosure

          The risk of loss in trading financial instruments such as stocks, FX, commodities, futures, bonds, ETFs and crypto can be substantial. You may sustain a total loss of the funds that you deposit with your broker. Therefore, you should carefully consider whether such trading is suitable for you in light of your circumstances and financial resources.

          No decision to invest should be made without thoroughly conducting due diligence by yourself or consulting with your financial advisors. Our web content might not suit you since we don't know your financial conditions and investment needs. Our financial information might have latency or contain inaccuracy, so you should be fully responsible for any of your trading and investment decisions. The company will not be responsible for your capital loss.

          Without getting permission from the website, you are not allowed to copy the website's graphics, texts, or trademarks. Intellectual property rights in the content or data incorporated into this website belong to its providers and exchange merchants.

          Not Logged In

          Log in to access more features

          FastBull Membership

          Not yet

          Purchase

          Become a signal provider
          Help Center
          Customer Service
          Dark Mode
          Price Up/Down Colors

          Log In

          Sign Up

          Position
          Layout
          Fullscreen
          Default to Chart
          The chart page opens by default when you visit fastbull.com