Markets
News
Analysis
User
24/7
Economic Calendar
Education
Data
- Names
- Latest
- Prev


Signal Accounts for Members
All Signal Accounts
All Contests


Romanian Finance Minister Says Will Introduce Wide Range Of Support Schemes For Companies And Investmentors Worth Up To 2.2 Billion Lei In 2026
Central Bank Data - Turkish Central Bank Gross Forex Reserves Stood At $84.41 Billion As Of Jan 30 From $86.20 Billion A Week Earlier
Indonesia Finance Ministry: Government, Central Bank Committed To Maintain Price, Financial Markets, Exchange Rate Stability
Indonesia Government Will Ensure All Potential Risks Are Managed Well During Planned Economic Transformation
Commodity Strategy: UBS Global Wealth Management Downgrades Industrial Metals To Neutral From Moderately Overweight
IMF: Additional Fiscal Consolidation In Israel Is Required To Place Debt On A Downward Trajectory While Safeguarding Adequate Civilian Spending
Central Bank Data - Foreign Investors' Turkish Government Bonds $+721.8 Million Of In Week To January 30
Central Bank Data - Forex Held By Turkish Locals Stood At $238.25 Billion As Of January 30, From $230.99 Billion A Week Earlier
Turkish Energy Minister: Turkey's Tpao Signed Memorandum Of Understanding With Chevron On Possible Energy Cooperation

Brazil IHS Markit Services PMI (Jan)A:--
F: --
P: --
U.S. ADP Employment (Jan)A:--
F: --
The U.S. Treasury Department released its quarterly refinancing statement.
U.S. IHS Markit Composite PMI Final (Jan)A:--
F: --
P: --
U.S. IHS Markit Services PMI Final (Jan)A:--
F: --
P: --
U.S. ISM Non-Manufacturing Price Index (Jan)A:--
F: --
P: --
U.S. ISM Non-Manufacturing Employment Index (Jan)A:--
F: --
P: --
U.S. ISM Non-Manufacturing New Orders Index (Jan)A:--
F: --
P: --
U.S. ISM Non-Manufacturing Inventories Index (Jan)A:--
F: --
P: --
U.S. ISM Non-Manufacturing PMI (Jan)A:--
F: --
P: --
U.S. EIA Weekly Crude Oil Imports ChangesA:--
F: --
P: --
U.S. EIA Weekly Heating Oil Stock ChangesA:--
F: --
P: --
U.S. EIA Weekly Crude Demand Projected by ProductionA:--
F: --
P: --
U.S. EIA Weekly Gasoline Stocks ChangeA:--
F: --
P: --
U.S. EIA Weekly Crude Stocks ChangeA:--
F: --
P: --
U.S. EIA Weekly Cushing, Oklahoma Crude Oil Stocks ChangeA:--
F: --
P: --
Australia Trade Balance (SA) (Dec)A:--
F: --
Australia Exports MoM (SA) (Dec)A:--
F: --
Japan 30-Year JGB Auction YieldA:--
F: --
P: --
Indonesia Annual GDP GrowthA:--
F: --
P: --
Indonesia GDP YoY (Q4)A:--
F: --
P: --
France Industrial Output MoM (SA) (Dec)A:--
F: --
Italy IHS Markit Construction PMI (Jan)A:--
F: --
P: --
Euro Zone IHS Markit Construction PMI (Jan)A:--
F: --
P: --
Germany Construction PMI (SA) (Jan)A:--
F: --
P: --
Italy Retail Sales MoM (SA) (Dec)A:--
F: --
P: --
U.K. Markit/CIPS Construction PMI (Jan)A:--
F: --
P: --
France 10-Year OAT Auction Avg. YieldA:--
F: --
P: --
Euro Zone Retail Sales YoY (Dec)A:--
F: --
Euro Zone Retail Sales MoM (Dec)A:--
F: --
U.K. BOE MPC Vote Cut (Feb)--
F: --
P: --
U.K. BOE MPC Vote Hike (Feb)--
F: --
P: --
U.K. BOE MPC Vote Unchanged (Feb)--
F: --
P: --
U.K. Benchmark Interest Rate--
F: --
P: --
MPC Rate Statement
U.S. Challenger Job Cuts (Jan)--
F: --
P: --
U.S. Challenger Job Cuts MoM (Jan)--
F: --
P: --
U.S. Challenger Job Cuts YoY (Jan)--
F: --
P: --
Bank of England Governor Bailey held a press conference on monetary policy.
Euro Zone ECB Marginal Lending Rate--
F: --
P: --
Euro Zone ECB Deposit Rate--
F: --
P: --
Euro Zone ECB Main Refinancing Rate--
F: --
P: --
ECB Monetary Policy Statement
U.S. Weekly Initial Jobless Claims (SA)--
F: --
P: --
U.S. Initial Jobless Claims 4-Week Avg. (SA)--
F: --
P: --
U.S. Weekly Continued Jobless Claims (SA)--
F: --
P: --
ECB Press Conference
U.S. JOLTS Job Openings (SA) (Dec)--
F: --
P: --
U.S. EIA Weekly Natural Gas Stocks Change--
F: --
P: --
BOC Gov Macklem Speaks
Mexico Policy Interest Rate--
F: --
P: --
U.S. Weekly Treasuries Held by Foreign Central Banks--
F: --
P: --
Reserve Bank of Australia Governor Bullock testified before Parliament.
India Benchmark Interest Rate--
F: --
P: --
India Cash Reserve Ratio--
F: --
P: --
India Repo Rate--
F: --
P: --
India Reverse Repo Rate--
F: --
P: --
Japan Leading Indicators Prelim (Dec)--
F: --
P: --
Germany Industrial Output MoM (SA) (Dec)--
F: --
P: --
Germany Exports MoM (SA) (Dec)--
F: --
P: --
U.K. Halifax House Price Index YoY (SA) (Jan)--
F: --
P: --


No matching data
View All

No data
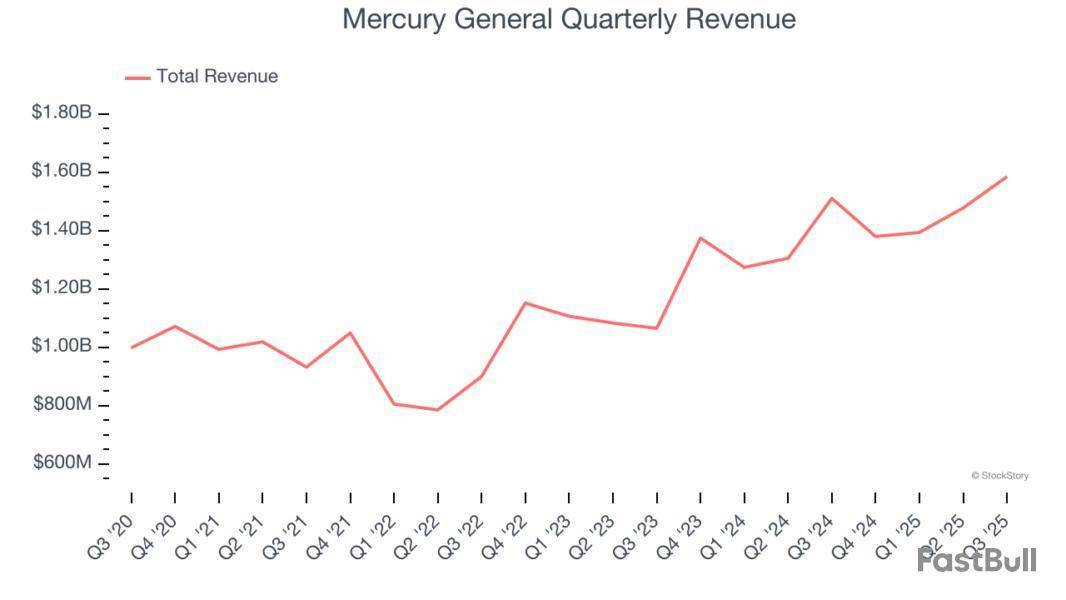
Mercury General has had an impressive run over the past six months as its shares have beaten the S&P 500 by 27%. The stock now trades at $90.58, marking a 37.1% gain. This was partly thanks to its solid quarterly results, and the performance may have investors wondering how to approach the situation.
Why Is Mercury General Not Exciting?
We’re glad investors have benefited from the price increase, but we're sitting this one out for now. Here are three reasons why MCY doesn't excite us and a stock we'd rather own.
1. Projected Revenue Growth Is Slim
Forecasted revenues by Wall Street analysts signal a company’s potential. Predictions may not always be accurate, but accelerating growth typically boosts valuation multiples and stock prices while slowing growth does the opposite.
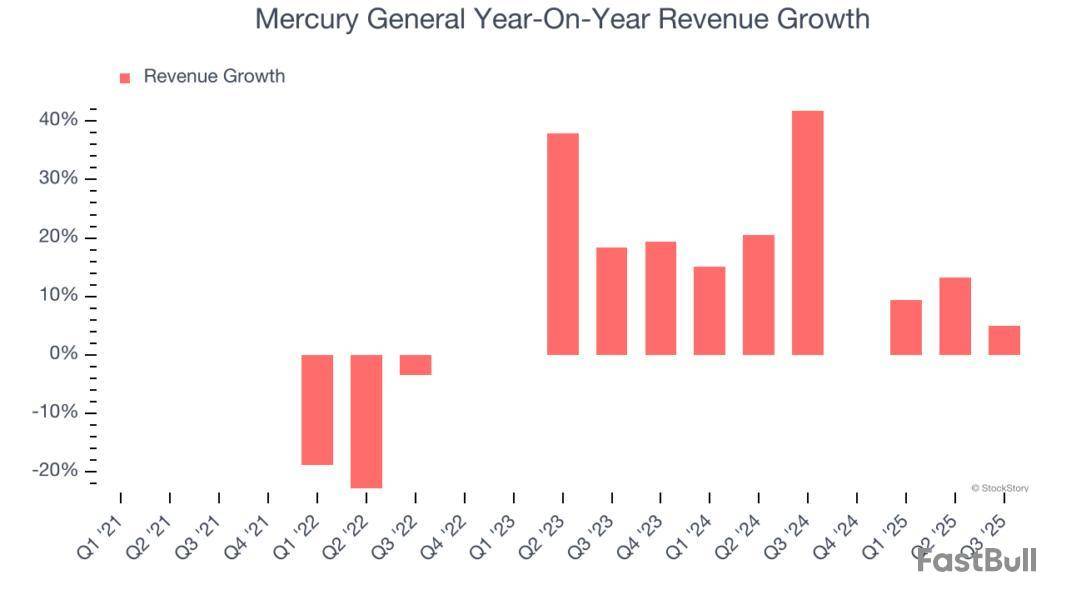
Over the next 12 months, sell-side analysts expect Mercury General’s revenue to rise by 2.4%, a deceleration versus its 15.1% annualized growth for the past two years. This projection doesn't excite us and indicates its products and services will see some demand headwinds.
2. Growing BVPS Reflects Strong Asset Base
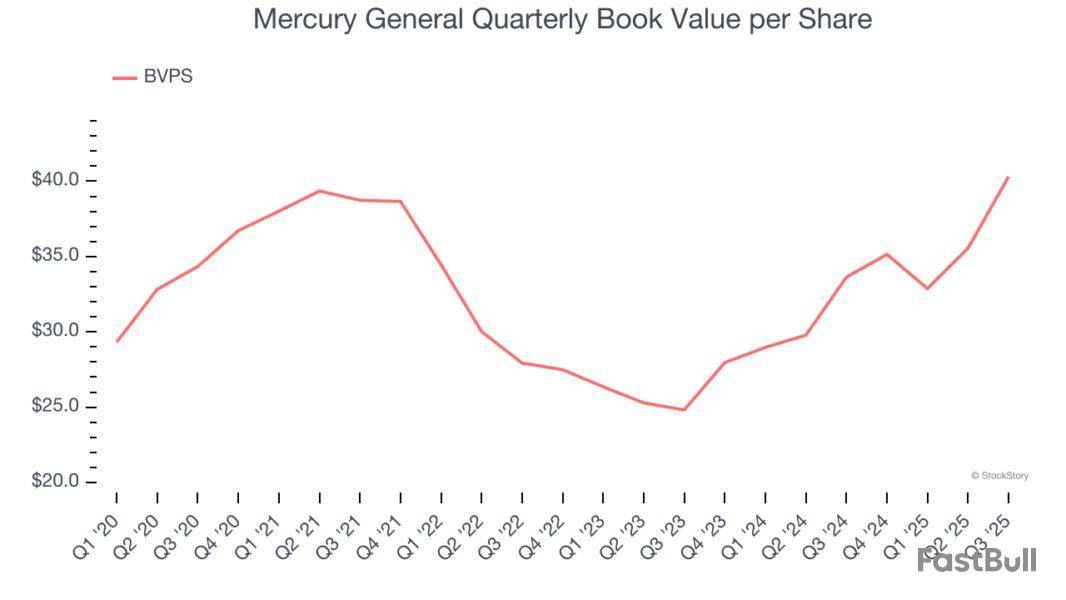
For insurers, book value per share (BVPS) is a vital measure of financial health, representing the total assets available to shareholders after accounting for all liabilities, including policyholder reserves and claims obligations.
Although Mercury General’s BVPS increased by a meager 3.3% annually over the last five years, the good news is that its growth has recently accelerated as BVPS grew at an incredible 27.4% annual clip over the past two years (from $24.82 to $40.30 per share).
3. Previous Growth Initiatives Haven’t Impressed
Return on equity, or ROE, represents the ultimate measure of an insurer's effectiveness, quantifying how well it transforms shareholder investments into profits. Over the long term, insurance companies with robust ROE metrics typically deliver superior shareholder returns through a balanced approach to capital management.
Over the last five years, Mercury General has averaged an ROE of 8.4%, uninspiring for a company operating in a sector where the average shakes out around 12.5%.
Final Judgment
Mercury General isn’t a terrible business, but it isn’t one of our picks. With its shares beating the market recently, the stock trades at 2.1× forward P/B (or $90.58 per share). Beauty is in the eye of the beholder, but our analysis shows the upside isn’t great compared to the potential downside. We're pretty confident there are more exciting stocks to buy at the moment. Let us point you toward the Amazon and PayPal of Latin America.
As the Q3 earnings season comes to a close, it’s time to take stock of this quarter’s best and worst performers in the property & casualty insurance industry, including Mercury General and its peers.
Property & Casualty (P&C) insurers protect individuals and businesses against financial loss from damage to property or from legal liability. This is a cyclical industry, and the sector benefits when there is 'hard market', characterized by strong premium rate increases that outpace loss and cost inflation, resulting in robust underwriting margins. The opposite is true in a 'soft market'. Interest rates also matter, as they determine the yields earned on fixed-income portfolios. On the other hand, P&C insurers face a major secular headwind from the increasing frequency and severity of catastrophe losses due to climate change. Furthermore, the liability side of the business is pressured by 'social inflation'—the trend of rising litigation costs and larger jury awards.
The 33 property & casualty insurance stocks we track reported a strong Q3. As a group, revenues beat analysts’ consensus estimates by 14.7%.
Thankfully, share prices of the companies have been resilient as they are up 5.7% on average since the latest earnings results.
Founded in 1961 and maintaining a network of over 6,300 independent agents across the country, Mercury General is an insurance company that primarily sells automobile insurance policies through independent agents in 11 states, with a strong focus on California.
Mercury General reported revenues of $1.58 billion, up 3.6% year on year. This print exceeded analysts’ expectations by 6.7%. Overall, it was a stunning quarter for the company with a beat of analysts’ EPS and revenue estimates.
Interestingly, the stock is up 17.3% since reporting and currently trades at $93.57.
Pioneering a data-driven approach that rewards good driving habits, Root is a technology-driven auto insurance company that uses mobile apps to acquire customers and data science to price policies based on individual driving behavior.
Root reported revenues of $387.8 million, up 26.9% year on year, outperforming analysts’ expectations by 4.5%. The business had an incredible quarter with a beat of analysts’ EPS and net premiums earned estimates.
Although it had a fine quarter compared its peers, the market seems unhappy with the results as the stock is down 16.7% since reporting. It currently trades at $74.55.
Starting as a small auto insurance company in 1937 with a pioneering focus on high-risk drivers, Progressive is a major auto, property, and commercial insurance provider that offers policies through independent agents, online platforms, and over the phone.
Progressive reported revenues of $22.51 billion, up 14.2% year on year, in line with analysts’ expectations. It was a softer quarter as it posted a significant miss of analysts’ EPS and book value per share estimates.
As expected, the stock is down 6.9% since the results and currently trades at $223.87.
Read our full analysis of Progressive’s results here.
Operating under a unique business model dating back to 1925, Erie Indemnity serves as the attorney-in-fact for Erie Insurance Exchange, managing policy issuance, claims handling, and investment services for this reciprocal insurer.
Erie Indemnity reported revenues of $1.07 billion, up 6.7% year on year. This result missed analysts’ expectations by 1.6%. It was a slower quarter as it also produced a miss of analysts’ revenue estimates and a narrow beat of analysts’ EPS estimates.
The stock is down 10.5% since reporting and currently trades at $277.
Read our full, actionable report on Erie Indemnity here, it’s free for active Edge members.
Founded in 2006 to serve markets where standard insurance coverage falls short, Skyward Specialty Insurance provides customized commercial property, casualty, and health insurance solutions for underserved or specialized market niches.
Skyward Specialty Insurance reported revenues of $382.5 million, up 27.1% year on year. This print topped analysts’ expectations by 14.3%. Overall, it was a stunning quarter as it also produced a solid beat of analysts’ net premiums earned estimates and an impressive beat of analysts’ revenue estimates.
The stock is up 9.8% since reporting and currently trades at $51.10.
What Happened?
A number of stocks jumped in the afternoon session after comments from a key Federal Reserve official hinted at potential interest rate cuts in the near future.
New York Federal Reserve President John Williams stated he sees "room for a further adjustment in the near term" to U.S. monetary policy, signaling to investors that a rate cut could be forthcoming. Speaking at a conference, Williams noted that policy is currently "modestly restrictive" and could be moved closer to a neutral stance. The market reacted swiftly to the news, as lower interest rates have been a primary driver of stock market gains. Following the remarks, the probability of a 25-basis-point rate cut rose significantly, according to CME's FedWatch tool. For financial companies, lower rates can increase the value of their large bond portfolios and stimulate broader economic activity.
The stock market overreacts to news, and big price drops can present good opportunities to buy high-quality stocks.
Among others, the following stocks were impacted:
Zooming In On Prudential (PRU)
Prudential’s shares are not very volatile and have only had 4 moves greater than 5% over the last year. In that context, today’s move indicates the market considers this news meaningful, although it might not be something that would fundamentally change its perception of the business.
The previous big move we wrote about was 22 days ago when the stock gained 2.7% on the news that the company reported third-quarter results that surpassed Wall Street's expectations for both profit and revenue.
The financial services giant posted adjusted earnings of $4.26 per share, easily clearing analysts' consensus estimates of $3.72. This also represented an increase from the $3.48 reported in the same quarter last year. Revenue for the quarter came in at $16.24 billion, which was 14.4% ahead of forecasts, though it marked a 16.7% decline compared to the prior-year period. The results were supported by a significant beat on Net Premiums Earned, which came in at $8.69 billion against an expected $6.73 billion. However, it wasn't all positive, as the company's book value per share of $90.69 missed analyst estimates.
Prudential is down 9.7% since the beginning of the year, and at $106.79 per share, it is trading 17.6% below its 52-week high of $129.52 from November 2024. Investors who bought $1,000 worth of Prudential’s shares 5 years ago would now be looking at an investment worth $1,390.
As the craze of earnings season draws to a close, here’s a look back at some of the most exciting (and some less so) results from Q3. Today, we are looking at property & casualty insurance stocks, starting with Travelers .
Property & Casualty (P&C) insurers protect individuals and businesses against financial loss from damage to property or from legal liability. This is a cyclical industry, and the sector benefits when there is 'hard market', characterized by strong premium rate increases that outpace loss and cost inflation, resulting in robust underwriting margins. The opposite is true in a 'soft market'. Interest rates also matter, as they determine the yields earned on fixed-income portfolios. On the other hand, P&C insurers face a major secular headwind from the increasing frequency and severity of catastrophe losses due to climate change. Furthermore, the liability side of the business is pressured by 'social inflation'—the trend of rising litigation costs and larger jury awards.
The 33 property & casualty insurance stocks we track reported a strong Q3. As a group, revenues beat analysts’ consensus estimates by 3.8%.
In light of this news, share prices of the companies have held steady as they are up 3.2% on average since the latest earnings results.
Tracing its roots back to 1853 when it insured travelers against accidents on steamboats and railroads, Travelers provides a wide range of commercial and personal property and casualty insurance products to businesses, government units, associations, and individuals.
Travelers reported revenues of $12.44 billion, up 4.5% year on year. This print exceeded analysts’ expectations by 0.9%. Overall, it was a satisfactory quarter for the company with a beat of analysts’ EPS estimates but a significant miss of analysts’ book value per share estimates.
Interestingly, the stock is up 7.5% since reporting and currently trades at $289.64.
Is now the time to buy Travelers? Access our full analysis of the earnings results here, it’s free for active Edge members.
Pioneering a data-driven approach that rewards good driving habits, Root is a technology-driven auto insurance company that uses mobile apps to acquire customers and data science to price policies based on individual driving behavior.
Root reported revenues of $387.8 million, up 26.9% year on year, outperforming analysts’ expectations by 4.5%. The business had an incredible quarter with a beat of analysts’ EPS and net premiums earned estimates.
Although it had a fine quarter compared its peers, the market seems unhappy with the results as the stock is down 8.8% since reporting. It currently trades at $81.67.
Is now the time to buy Root? Access our full analysis of the earnings results here, it’s free for active Edge members.
Weakest Q3: Selective Insurance Group
Founded in 1926 during the early days of automobile insurance, Selective Insurance Group is a property and casualty insurance company that sells commercial, personal, and excess and surplus lines insurance products through independent agents.
Selective Insurance Group reported revenues of $138.7 million, down 88.9% year on year, falling short of analysts’ expectations by 52.7%. It was a disappointing quarter as it posted a significant miss of analysts’ revenue and EPS estimates.
Selective Insurance Group delivered the weakest performance against analyst estimates and slowest revenue growth in the group. As expected, the stock is down 3.4% since the results and currently trades at $78.44.
Read our full analysis of Selective Insurance Group’s results here.
Named after the Arctic bowhead whale known for navigating challenging waters, Bowhead Specialty Holdings is a specialty insurance company that provides customized coverage for complex and high-risk commercial sectors.
Bowhead Specialty reported revenues of $143.9 million, up 23.3% year on year. This print beat analysts’ expectations by 1.2%. Overall, it was a strong quarter as it also recorded a beat of analysts’ EPS estimates and a narrow beat of analysts’ revenue estimates.
The stock is up 13.6% since reporting and currently trades at $27.67.
Read our full, actionable report on Bowhead Specialty here, it’s free for active Edge members.
Founded in 1961 and maintaining a network of over 6,300 independent agents across the country, Mercury General is an insurance company that primarily sells automobile insurance policies through independent agents in 11 states, with a strong focus on California.
Mercury General reported revenues of $1.58 billion, up 3.6% year on year. This number topped analysts’ expectations by 6.7%. It was a stunning quarter as it also put up a beat of analysts’ EPS and revenue estimates.
The stock is up 10.5% since reporting and currently trades at $88.13.
Read our full, actionable report on Mercury General here, it’s free for active Edge members.

Auto insurance provider Mercury General beat Wall Street’s revenue expectations in Q3 CY2025, with sales up 4.9% year on year to $1.58 billion. Its GAAP profit of $5.06 per share was significantly above analysts’ consensus estimates.
Is now the time to buy Mercury General? Find out by accessing our full research report, it’s free for active Edge members.
Mercury General (MCY) Q3 CY2025 Highlights:
Company Overview
Founded in 1961 and maintaining a network of over 6,300 independent agents across the country, Mercury General is an insurance company that primarily sells automobile insurance policies through independent agents in 11 states, with a strong focus on California.
Revenue Growth
Big picture, insurers generate revenue from three key sources. The first is the core business of underwriting policies. The second source is income from investing the “float” (premiums collected upfront not yet paid out as claims) in assets such as fixed-income assets and equities. The third is fees from various sources such as policy administration, annuities, or other value-added services. Thankfully, Mercury General’s 10.4% annualized revenue growth over the last five years was solid. Its growth beat the average insurance company and shows its offerings resonate with customers.

Long-term growth is the most important, but within financials, a half-decade historical view may miss recent interest rate changes and market returns. Mercury General’s annualized revenue growth of 15.1% over the last two years is above its five-year trend, suggesting its demand was strong and recently accelerated. 
This quarter, Mercury General reported modest year-on-year revenue growth of 4.9% but beat Wall Street’s estimates by 6.7%.
Net premiums earned made up 94.7% of the company’s total revenue during the last five years, meaning Mercury General lives and dies by its underwriting activities because non-insurance operations barely move the needle.

Our experience and research show the market cares primarily about an insurer’s net premiums earned growth as investment and fee income are considered more susceptible to market volatility and economic cycles.
The 1999 book Gorilla Game predicted Microsoft and Apple would dominate tech before it happened. Its thesis? Identify the platform winners early. Today, enterprise software companies embedding generative AI are becoming the new gorillas. a profitable, fast-growing enterprise software stock that is already riding the automation wave and looking to catch the generative AI next.
Book Value Per Share (BVPS)
Insurance companies are balance sheet businesses, collecting premiums upfront and paying out claims over time. The float – premiums collected but not yet paid out – are invested, creating an asset base supported by a liability structure. Book value captures this dynamic by measuring:
BVPS is essentially the residual value for shareholders.
We therefore consider BVPS very important to track for insurers and a metric that sheds light on business quality. While other (and more commonly known) per-share metrics like EPS can sometimes be lumpy due to reserve releases or one-time items and can be managed or skewed while still following accounting rules, BVPS reflects long-term capital growth and is harder to manipulate.
Mercury General’s BVPS grew at a sluggish 3.3% annual clip over the last five years. However, BVPS growth has accelerated recently, growing by 27.4% annually over the last two years from $24.82 to $40.30 per share.

Key Takeaways from Mercury General’s Q3 Results
It was good to see Mercury General beat analysts’ EPS expectations this quarter. We were also excited its revenue outperformed Wall Street’s estimates by a wide margin. Zooming out, we think this was a solid print. Investors were likely hoping for more, and shares traded down 2.3% to $78.04 immediately following the results.
So should you invest in Mercury General right now? What happened in the latest quarter matters, but not as much as longer-term business quality and valuation, when deciding whether to invest in this stock. We cover that in our actionable full research report which you can read here, it’s free for active Edge members.
Net premiums earned and net income increased in Q3 2025, driven by rate hikes and policy growth, but nine-month net income declined year-over-year due to significant catastrophe losses from California wildfires. Regulatory changes and subrogation recoveries are expected to support future results.
Original document: Mercury General Corporation [MCY] SEC 10-Q Quarterly Report — Nov. 4 2025
Q3 2025 saw a 21.5% year-over-year increase in net income and improved combined ratio, driven by higher premiums and investment income, despite significant catastrophe losses from California wildfires. Substantial subrogation recoveries and reinsurance mitigated losses.
Original document: Mercury General Corporation [MCY] SEC 8-K Current Report — Nov. 4 2025
The risk of loss in trading financial instruments such as stocks, FX, commodities, futures, bonds, ETFs and crypto can be substantial. You may sustain a total loss of the funds that you deposit with your broker. Therefore, you should carefully consider whether such trading is suitable for you in light of your circumstances and financial resources.
No decision to invest should be made without thoroughly conducting due diligence by yourself or consulting with your financial advisors. Our web content might not suit you since we don't know your financial conditions and investment needs. Our financial information might have latency or contain inaccuracy, so you should be fully responsible for any of your trading and investment decisions. The company will not be responsible for your capital loss.
Without getting permission from the website, you are not allowed to copy the website's graphics, texts, or trademarks. Intellectual property rights in the content or data incorporated into this website belong to its providers and exchange merchants.
Not Logged In
Log in to access more features
Log In
Sign Up