• Trade
  • Markets
  • Copy
  • Contests
  • 24/7
  • Calendar
  • Q&A
  • Chats
Screeners
SYMBOL
LAST
BID
ASK
HIGH
LOW
NET CHG.
%CHG.
SPREAD
SOURCE
SPX
S&P 500 Index
7656.97
7656.97
7656.97
7677.02
7636.75
+65.28
+ 0.86%
--
--
DJI
Dow Jones Industrial Average
52573.29
52573.29
52573.29
52720.24
52204.46
+509.19
+ 0.98%
--
--
IXIC
NASDAQ Composite Index
26333.03
26333.03
26333.03
26431.22
26283.11
+251.31
+ 0.96%
--
--
USDX
US Dollar Index
99.080
99.080
99.160
0.000
0
0.000
0.00%
--
--
EURUSD
Euro / US Dollar
1.15657
1.15657
1.15664
1.15965
1.15646
-0.00315
-0.27%
--
--
GBPUSD
Pound Sterling / US Dollar
1.35039
1.35039
1.35050
1.35280
1.35022
-0.00211
-0.16%
--
--
XAUUSD
Gold / US Dollar
4329.17
4329.17
4329.55
4355.21
4326.13
-19.89
-0.46%
--
--
WTI
Light Sweet Crude Oil
98.713
98.713
98.748
99.615
98.274
+2.139
+ 2.21%
--
--

Community Accounts

Signal Accounts
--
Profit Accounts
--
Loss Accounts
--
View More

Become a signal provider

Sell trading signals to earn additional income

View More

Guide to Copy Trading

Get started with ease and confidence

View More

Signal Accounts for Members

All Signal Accounts

Best Return
  • Best Return
  • Best P/L
  • Best MDD
Past 1W
  • Past 1W
  • Past 1M
  • Past 1Y

All Contests

  • All
  • Recommend
  • Stocks
  • Cryptocurrencies
  • Central Banks
  • Trump Updates
  • Featured News
Top News Only
Share

The British Pound Fell Below 1.35 Against The US Dollar, Down 0.14% On The Day

Share

Timor-Leste Stated That The Final Round Of Negotiations With Australia Regarding The Sunrise Gas Field Was Completed Last Week In Canberra, With First Gas Production Scheduled For 2034 Or 2035

Share

Deutsche Bank: It Expects The Federal Reserve To Raise Interest Rates By 25 Basis Points In March 2027, Having Previously Predicted Rate Hikes In September And December 2026

Share

Middle East Conflict Drives Up Energy Prices As Debate Over Rate Hikes Intensifies Within The Bank Of England

Share

Russian Drones Struck A Railway On The Ukraine–Poland Border, Narrowly Avoiding European Leaders Including Boris Johnson

Share

Oman's Energy Minister: We Need To Diversify Export Routes And Find Alternative Export Options, Whether Via Oman Or Yemen

Share

Oman's Energy Minister: The Situation Should Stabilize In The Medium Term

Share

Oman's Energy Minister: Soaring Oil And Liquefied Natural Gas Prices Are Unsustainable For Everyone

Share

Oman's Energy Minister: The Strait Of Hormuz Will Be Opened, But This Is Likely To Be A Short-term Situation

Share

According To Politico: Judge Nichols, Appointed By Trump In Washington, D.C., Blocked The Government's Mail-in Voting Plan, Arguing That The U.S. Postal Service Had No Authority To Implement It

Share

Asian Currencies Generally Weakened Amid Expectations Of Federal Reserve Rate Hikes

Share

Saudi Arabia's Civil Defense Authorities Stated That The Danger Has Passed

Share

Barclays: Dollar May Face Pressure If Fed Holds Steady Or Turns Dovish

Share

Saudi Arabia's Civil Defense Has Issued A Warning That There May Be Danger In The Khamis Mushait And Abha Areas

Share

The Australian Dollar Fell 0.28% Against The US Dollar (AUD/USD) To 0.7148, Hitting Its Lowest Level Since September 2

Share

UBS Group: Gold Investors May Already Be Focusing On The Fed's Next Moves

Share

The SC Crude Oil Futures Contract Surged 12.00% Intraday, Currently Trading At 907.30 Yuan Per Barrel

Share

The Main Polysilicon Futures Contract Rose More Than 4.00% Intraday, Currently Trading At 37,880 Yuan/ton

Share

The SC Crude Oil Futures Contract Surged 11.12% Intraday, Currently Trading At 900.00 Yuan Per Barrel, Marking Its First Surge Since Its Listing

Share

The New Zealand Dollar Fell 0.50% Against The US Dollar (NZD/USD) On The Day, Currently Trading At 0.5783

TIME
ACT
FCST
PREV
IMPACT
U.K. Inflation Rate Expectations

A:--

F: --

P: --

GBPUSD
  • GBPUSD
  • XAUUSD
  • XAGUSD
  • WTI
  • USDX
Russia Key Rate

A:--

F: --

P: --

WTI
  • WTI
  • XAUUSD
  • XAGUSD
  • USDX
India Deposit Gowth YoY

A:--

F: --

P: --

XAUUSD
  • XAUUSD
  • XAGUSD
  • WTI
  • USDX
Brazil CPI YoY (Aug)

A:--

F: --

P: --

XAUUSD
  • XAUUSD
  • XAGUSD
  • WTI
  • USDX
Mexico Industrial Output YoY (Jul)

A:--

F: --

P: --

XAUUSD
  • XAUUSD
  • XAGUSD
  • WTI
  • USDX
U.S. Core CPI YoY (Not SA) (Aug)

A:--

F: --

P: --

XAUUSD
  • XAUUSD
  • XAGUSD
  • WTI
  • USDX
U.S. Core CPI MoM (SA) (Aug)

A:--

F: --

P: --

XAUUSD
  • XAUUSD
  • XAGUSD
  • WTI
  • USDX
U.S. Core CPI (SA) (Aug)

A:--

F: --

P: --

XAUUSD
  • XAUUSD
  • XAGUSD
  • WTI
  • USDX
U.S. CPI MoM (SA) (Aug)

A:--

F: --

P: --

XAUUSD
  • XAUUSD
  • XAGUSD
  • WTI
  • USDX
U.S. CPI YoY (Not SA) (Aug)

A:--

F: --

P: --

XAUUSD
  • XAUUSD
  • XAGUSD
  • WTI
  • USDX
U.S. CPI MoM (Not SA) (Aug)

A:--

F: --

P: --

XAUUSD
  • XAUUSD
  • XAGUSD
  • WTI
  • USDX
U.S. Real Income MoM (SA) (Aug)

A:--

F: --

P: --
USDX
  • USDX
  • XAUUSD
  • XAGUSD
  • WTI
Germany Current Account (Not SA) (Jul)

A:--

F: --

P: --
EURUSD
  • EURUSD
  • XAUUSD
  • XAGUSD
  • WTI
  • USDX
Russia Trade Balance (Jul)

A:--

F: --

P: --

WTI
  • WTI
  • XAUUSD
  • XAGUSD
  • USDX
U.S. UMich Consumer Expectations Index Prelim (Sept)

A:--

F: --

P: --

USDX
  • USDX
  • XAUUSD
  • XAGUSD
  • WTI
U.S. UMich Current Economic Conditions Index Prelim (Sept)

A:--

F: --

P: --

USDX
  • USDX
  • XAUUSD
  • XAGUSD
  • WTI
U.S. UMich Consumer Sentiment Index Prelim (Sept)

A:--

F: --

P: --

USDX
  • USDX
  • XAUUSD
  • XAGUSD
  • WTI
U.S. UMich 1-Year-Ahead Inflation Expectations Prelim (Sept)

A:--

F: --

P: --

XAUUSD
  • XAUUSD
  • XAGUSD
  • WTI
  • USDX
U.S. 5-10 Year-Ahead Inflation Expectations (Sept)

A:--

F: --

P: --

XAUUSD
  • XAUUSD
  • XAGUSD
  • WTI
  • USDX
U.S. Cleveland Fed CPI MoM (Aug)

A:--

F: --

P: --

USDX
  • USDX
  • XAUUSD
  • XAGUSD
  • WTI
Russia CPI YoY (Aug)

A:--

F: --

P: --

WTI
  • WTI
  • XAUUSD
  • XAGUSD
  • USDX
U.S. Weekly Total Oil Rig Count

A:--

F: --

P: --

WTI
  • WTI
  • XAUUSD
  • XAGUSD
  • USDX
U.S. Weekly Total Rig Count

A:--

F: --

P: --

WTI
  • WTI
  • XAUUSD
  • XAGUSD
  • USDX
ECB Chief Economist Lane Speaks
U.S. Budget Balance (Aug)

A:--

F: --

P: --

USDX
  • USDX
  • XAUUSD
  • XAGUSD
  • WTI
ECB President Lagarde Speaks
China, Mainland Social Financing Scale (Aug)

--

F: --

P: --

China, Mainland M0 Money Supply YoY (Aug)

--

F: --

P: --

China, Mainland M1 Money Supply YoY (Aug)

--

F: --

P: --

China, Mainland M2 Money Supply YoY (Aug)

--

F: --

P: --

Japan Industrial Output Final YoY (Jul)

A:--

F: --

P: --

USDJPY
  • USDJPY
  • XAUUSD
  • XAGUSD
  • WTI
  • USDX
Japan Industrial Output Final MoM (Jul)

A:--

F: --

P: --

USDJPY
  • USDJPY
  • XAUUSD
  • XAGUSD
  • WTI
  • USDX
China, Mainland Outstanding Loans Growth YoY (Aug)

--

F: --

P: --

India CPI YoY (Aug)

--

F: --

P: --

Canada National Economic Confidence Index

--

F: --

P: --

Canada Manufacturing Inventory MoM (Jul)

--

F: --

P: --

Canada CPI MoM (Aug)

--

F: --

P: --

Canada CPI YoY (Aug)

--

F: --

P: --

Canada Core CPI YoY (Aug)

--

F: --

P: --

Canada Trimmed CPI YoY (SA) (Aug)

--

F: --

P: --

Canada Manufacturing Unfilled Orders MoM (Jul)

--

F: --

P: --

Canada Manufacturing New Orders MoM (Jul)

--

F: --

P: --

Canada Core CPI MoM (Aug)

--

F: --

P: --

China, Mainland Urban Area Unemployment Rate (Aug)

--

F: --

P: --

China, Mainland Industrial Output YoY (YTD) (Aug)

--

F: --

P: --

U.K. Unemployment Claimant Count (Aug)

--

F: --

P: --

U.K. 3-Month ILO Employment Change (Jul)

--

F: --

P: --

U.K. 3-Month ILO Unemployment Rate (Jul)

--

F: --

P: --

U.K. Unemployment Rate (Aug)

--

F: --

P: --

Saudi Arabia CPI YoY (Aug)

--

F: --

P: --

U.K. Average Weekly Earnings (3-Month Average, Excluding Bonuses) YoY (Jul)

--

F: --

P: --

U.K. Average Weekly Earnings (3-Month Average, Including Bonuses) YoY (Jul)

--

F: --

P: --

France HICP Final MoM (Aug)

--

F: --

P: --

Canada Existing Home Sales MoM (Aug)

--

F: --

P: --

Euro Zone ZEW Economic Sentiment Index (Sept)

--

F: --

P: --

Germany ZEW Economic Sentiment Index (Sept)

--

F: --

P: --

Germany ZEW Current Conditions Index (Sept)

--

F: --

P: --

Euro Zone ZEW Current Conditions Index (Sept)

--

F: --

P: --

Euro Zone Trade Balance (SA) (Jul)

--

F: --

P: --

Euro Zone Trade Balance (Not SA) (Jul)

--

F: --

P: --

Germany 2-Year Schatz Auction Avg. Yield

--

F: --

P: --

Q&A with Experts
    • All
    • Chatrooms
    • Groups
    • Friends
    Atay Duysh flag
    BAY NOOW GOLD
    Atay Duysh flag
    LOTS 40
    Atay Duysh flag
    GO
    Atay Duysh flag
    DOWN
    john flag
    Atay Duysh
    4330
    @Atay Duyshgold is more likely to stay sideways as traders will avoid taking decisive bets before major decisions by central banks
    john flag
    Atay Duysh
    TP 4400
    @Atay DuyshAre you buying gold at the moment bro ?
    Atay Duysh flag
    Я РАБОТАЮ В БАНКЕ
    Atay Duysh flag
    YES BRO
    Atay Duysh flag
    BAY MORE
    Atay Duysh flag
    BRO
    john flag
    Atay Duysh
    Я РАБОТАЮ В БАНКЕ
    @Atay DuyshOh, nice! Banking and finance go hand in hand. What department do you work in?
    john flag
    Atay Duysh
    Я РАБОТАЮ В БАНКЕ
    @Atay Duyshyou think you have the upper hand by working in the bank 😂
    Atay Duysh flag
    john
    @Atay Duyshyou think you have the upper hand by working in the bank 😂
    @john БРАТ ТОЛЬКО ЧТО ЗАКУПИЛИСЬ ЗОЛОТОМ НА 800 ЛОТ
    Atay Duysh flag
    BAY MORE
    Atay Duysh flag
    МОЙ БРАТ В КИТАЕ РАБОТАЕТ СКАЗАЛ КОЕ ЧТО ЗАКУПИТЬСЯ ЗОЛОТОМ ЩАС
    sanjeev flag
    Atay Duysh
    BAY MORE
    @Atay Duysh no bay in gold now.bay gold only above 4374.for now sell gold till below 4363.tgt 4321 to 4317
    Saka the Gunners flag
    sanjeev
    @Atay Duysh no bay in gold now.bay gold only above 4374.for now sell gold till below 4363.tgt 4321 to 4317
    @sanjeevbreak 4300 tgt 4250,
    sanjeev flag
    Saka the Gunners
    @sanjeevbreak 4300 tgt 4250,
    @Saka the Gunners bro one tgt at a time. let 4317 break then 4293/ 4293 breaks then definately towards 4250 to 4244
    Saka the Gunners flag
    sanjeev
    @Saka the Gunners bro one tgt at a time. let 4317 break then 4293/ 4293 breaks then definately towards 4250 to 4244
    @sanjeevok brother
    Eon flag
    Morning guys, the 4309 to 4275 is an interesting level for xauusd. Monitor it diligently
    Type here...
    Add Symbol or Code

      No matching data

      All
      Recommend
      Stocks
      Cryptocurrencies
      Central Banks
      Trump Updates
      Featured News
      • All
      • Russia-Ukraine Conflict
      • Middle East Flashpoint
      • All
      • Russia-Ukraine Conflict
      • Middle East Flashpoint
      Search
      Products

      Charts Free Forever

      Chats Q&A with Experts
      Screeners Economic Calendar Data Tools
      Membership Features
      Data Warehouse Market Trends Institutional Data Policy Rates Macro

      Market Trends

      Market Sentiment Order Book Forex Correlations

      Top Indicators

      Charts Free Forever
      Markets

      News

      24/7 Analysis Education

      Latest Views

      Latest Update

      Signals

      Copy Rankings Latest Signals Become a signal provider AI Rating
      Contests
      Brokers

      Overview Brokers Assessment Rankings Regulators News Claims
      Broker listing Forex Brokers Comparison Tool Live Spread Comparison Scam
      Q&A Complaint Scam Alert Videos Tips to Detect Scam
      More

      Business
      Events
      Careers About Us Advertising Help Center

      White Label

      Broker API

      Data API

      Web Plug-ins

      Affiliate Program

      Awards Institution Evaluation IB Seminar Salon Event Exhibition
      Vietnam Thailand Singapore Dubai
      Fans Party Investment Sharing Session
      FastBull Summit BrokersView Expo
      Recent Searches
        Top Searches
          Markets
          Analysis
          User
          24/7
          Economic Calendar
          Education
          Data
          • Names
          • Latest
          • Prev

          View All

          No data

          Scan to Download

          Faster Charts, Chat Faster!

          Download
          English
          • English
          • Español
          • العربية
          • Bahasa Indonesia
          • Bahasa Melayu
          • Tiếng Việt
          • ภาษาไทย
          • Français
          • Italiano
          • Türkçe
          • Русский язык
          • 简中
          • 繁中
          Open Account
          Search
          Products
          Charts Free Forever
          Markets
          News
          Signals

          Copy Rankings Latest Signals Become a signal provider AI Rating
          Contests
          Brokers

          Overview Brokers Assessment Rankings Regulators News Claims
          Broker listing Forex Brokers Comparison Tool Live Spread Comparison Scam
          Q&A Complaint Scam Alert Videos Tips to Detect Scam
          More

          Business
          Events
          Careers About Us Advertising Help Center

          White Label

          Broker API

          Data API

          Web Plug-ins

          Affiliate Program

          Awards Institution Evaluation IB Seminar Salon Event Exhibition
          Vietnam Thailand Singapore Dubai
          Fans Party Investment Sharing Session
          FastBull Summit BrokersView Expo

          Why a Shrinking MACD Histogram Does Not Confirm a Trend Reversal

          zhan chen
          Summary:

          A rising price can produce smaller positive MACD bars. A full 12, 26, 9 calculation separates zero crossings, divergence and structural confirmation.
          Why a Shrinking MACD Histogram Does Not Confirm a Trend Reversal_1

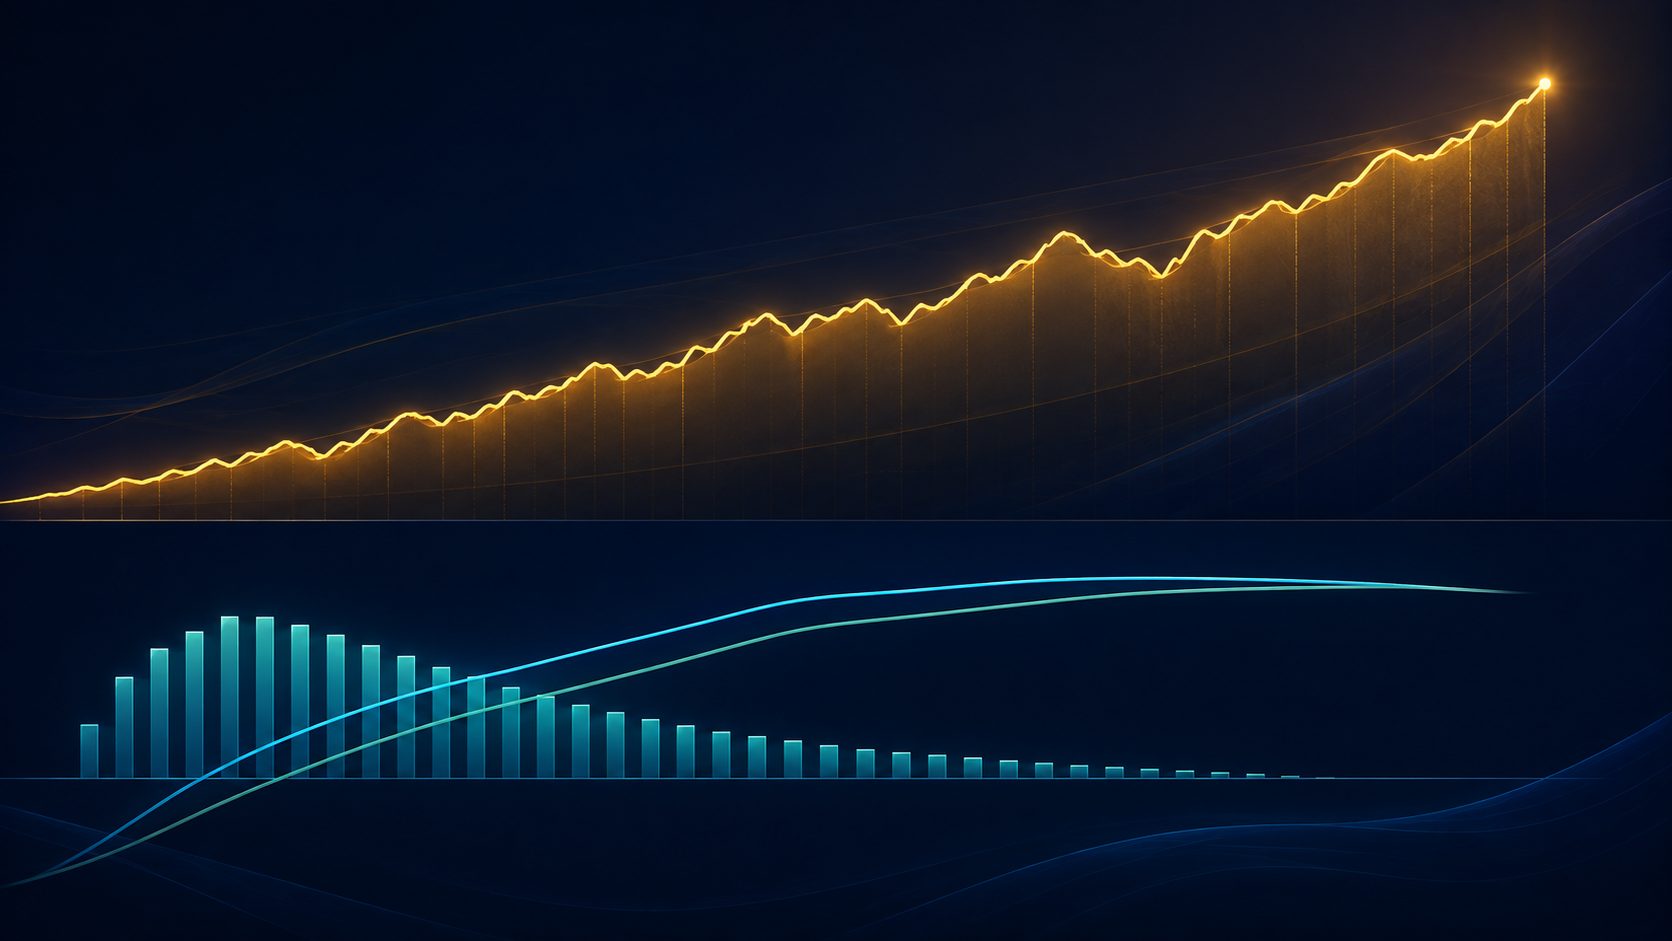
          A shrinking MACD histogram establishes that the distance between two indicator lines is narrowing. It does not, by itself, establish a trend reversal. Price can keep making higher highs while the MACD line rises and positive bars shrink. Negative bars can approach zero while price continues to fall.

          The distinction becomes clearer when three questions are kept separate: which side of zero the MACD line occupies, where it sits relative to its signal line, and whether price has broken its sequence of swing highs and lows.

          Check what the histogram actually plots

          This article uses explicit definitions: the MACD line, also labelled DIF, is the 12-period EMA minus the 26-period EMA. Its signal line, here labelled DEA, is a nine-period EMA of DIF. The histogram is DIF minus DEA. An EMA updates as previous EMA + 2 ÷ (periods + 1) × (current close − previous EMA).

          DIF measures a difference between two smoothed prices; DEA smooths that difference; the histogram measures the remaining gap. It is not volume, net buying orders or the current price return. The guide to moving averages and crossovers explains the first layer of smoothing and its lag.

          If a chart multiplies DIF minus DEA by two, bar height doubles but signs and zero-crossing times stay the same. A different signal-line calculation, or a display that plots DIF itself as bars, changes the interpretation more fundamentally. Colour conventions also differ: they may represent positive and negative values or growth and contraction from the previous bar. Inspect the settings before relying on red and green.

          Two different questions about zero

          ObservationWhat follows from the definitionWhat does not follow
          DIF above zeroThe 12-period EMA exceeds the 26-period EMAThe next close must rise
          Positive histogramDIF exceeds DEADIF must itself be positive
          Shrinking positive barsThe positive gap is narrowingThe uptrend has broken
          Negative bars approaching zeroThe negative gap is narrowingPrice has bottomed

          For example, DIF of −2 and DEA of −3 produce a positive histogram of +1 even though the shorter price average remains below the longer one. Conversely, DIF of +2 and DEA of +3 produce a negative bar of −1 while the shorter average remains above the longer one. A histogram zero crossing and a DIF zero crossing are different events.

          A reproducible example: higher prices, smaller bars

          Assume 40 preceding closes all equal 100, so both price EMAs equal 100 and DIF and DEA equal zero. The next five closes are 103, 106, 109, 112 and 115. Thereafter price rises by one point per period: 116, 117, 118, 119, 120, 121 and 122. Apply the 12, 26 and 9 settings without rounding intermediate values.

          On the first rising period, the fast EMA is 100 + 2/13 × 3, approximately 100.4615. The slow EMA is 100 + 2/27 × 3, approximately 100.2222. DIF is about 0.2393, DEA is 0.2 × DIF, about 0.0479, and the histogram is about 0.1915. Repeating that calculation gives:

          Period after rise beginsCloseDIFDEAHistogram
          71173.80111.97051.8306
          81184.25752.42791.8296
          91194.64642.87161.7748
          101204.97793.29291.6850
          111215.26073.68641.5742
          121225.50204.04951.4525

          Price rises from 117 to 122 and DIF keeps climbing, yet the histogram contracts from 1.8306 to 1.4525. After price switches from three-point gains to one-point gains, DEA gradually catches up with DIF. No price decline is required.

          Calling the histogram a direct measure of price acceleration is therefore too literal. Each close in the table increases by the same point, but the bars still change because the indicator retains a smoothed history. Subtracting the rounded table entries can differ from the displayed histogram by 0.0001; the underlying calculation uses full precision.

          For the bearish mirror image, replace every close with 200 minus that close. The starting level remains 100, while DIF, DEA and the histogram change signs. Price keeps falling as negative bars converge towards zero. Shrinking negative bars alone cannot establish a bottom.

          Let price structure test the reversal hypothesis

          Smaller positive bars can prompt a review of momentum, but the last meaningful pullback low provides different evidence. Suppose price rises from 100 to 110, retreats to 106, then reaches 114. A smaller second histogram peak is a divergence candidate. If 106 holds and subsequent lows keep rising, contraction alone has not broken the uptrend.

          A later break below 106, followed by a rebound that cannot regain the former support and forms a high below 114, supplies a more complete weakening structure. These are invented levels. A brief dip can also reverse, so define an effective break consistently—by a close, a retest or another predetermined rule.

          Structural confirmation usually comes later than the first shrinking bar. Waiting gives up part of the move; acting earlier accepts more risk that the trend will continue. MACD cannot remove that trade-off. Existing holders can use a momentum warning to review protection or additional exposure without treating it as an automatic instruction to reverse positions.

          Why divergence can repeat without a reversal

          A higher price high with a lower indicator high is a familiar bearish divergence description. First decide whether the comparison uses DIF peaks or histogram peaks, and keep that choice consistent. Compare swings of similar scale rather than pairing a complete leg with an isolated gap.

          A strong trend can shift from rapid gains to gentler gains and generate repeated smaller histogram peaks. The smoothed momentum pattern has changed; supply and demand need not have changed enough to reverse price. Repeatedly adding against the trend because divergence persists exposes the position to further extension.

          If price breaks the previous high again while maintaining higher lows, reassess a reversal thesis built on divergence. Conversely, if price has already broken an important structure, a still-positive histogram caused by smoothing should not be used to dismiss that evidence.

          Market data conventions affect the reading

          In FX and spot gold, quote sources, daily session boundaries and missing-data treatment can cause differences. The 12, 26 and 9 settings count bars: a four-hour chart and a daily chart cover different spans of calendar time. A forming bar changes with the latest price, so intrabar contraction may disappear by the close.

          For equities, splits, dividends and price-adjustment choices change the historical series. An untreated discontinuity may produce a large bar without a comparable shift in trading momentum. Continuous futures can also contain roll gaps. If an indicator change coincides with a contract switch, compare it with the individual delivery contract.

          MACD itself contains neither volume nor open interest, so conclusions about capital flows require other evidence. Raw histogram heights are also unsuitable for ranking instruments: the same percentage change in a high-priced metal and a currency pair near one produces different absolute price differences. MACD has no fixed 0–100 range like RSI.

          Available history matters too. A short loaded series and a longer series cropped to the same date can differ because of EMA initialisation. Check warm-up data, particularly for newly listed instruments or a changed feed.

          Range-bound signals still have to cover costs

          When price oscillates around similar levels, the averages converge and DIF and DEA can cross repeatedly. Contraction, zero crossings and expansion may follow one another without a move large enough to cover spreads and fees. Shorter settings react faster but can increase this back-and-forth; longer settings add lag.

          Evaluate a use case with fixed data, settings, close confirmation and invalidation rules, including fees and plausible slippage. One successful reversal says little about the cost of trend extensions and trading ranges. The histogram supplies a calculable change in a gap. Price structure, timeframe and execution costs determine what that change can support.

          Risk Warnings and Disclaimers
          You understand and acknowledge that there is a high degree of risk involved in trading. Following any strategies or investment methods may lead to potential losses. The content on the site is provided by our contributors and analysts for information purposes only. You are solely responsible for determining whether any trading assets, securities, strategy, or any other product is suitable for investing based on your own investment objectives and financial situation.
          Add to Favorites
          Share
          FastBull
          Copyright © 2026 FastBull Ltd

          728 RM B 7/F GEE LOK IND BLDG NO 34 HUNG TO RD KWUN TONG KLN HONG KONG

          TelegramInstagramTwitterfacebooklinkedin
          App Store Google Play Android Windows
          Products
          Charts

          Chats

          Q&A with Experts
          Screeners
          Economic Calendar
          Data
          Tools
          Membership
          Features
          Function
          Markets
          Copy Trading
          Latest Signals
          Contests
          24/7
          Analysis
          Education
          Company
          Careers
          About Us
          Contact Us
          Advertising
          Download FastBull
          Help Center
          Feedback
          User Agreement
          Privacy Policy
          Personal Information Protection Statement
          Business

          White Label

          Broker API

          Data API

          Web Plug-ins

          Poster Maker

          Affiliate Program

          Risk Disclosure

          The risk of loss in trading financial instruments such as stocks, FX, commodities, futures, bonds, ETFs and crypto can be substantial. You may sustain a total loss of the funds that you deposit with your broker. Therefore, you should carefully consider whether such trading is suitable for you in light of your circumstances and financial resources.

          No decision to invest should be made without thoroughly conducting due diligence by yourself or consulting with your financial advisors. Our web content might not suit you since we don't know your financial conditions and investment needs. Our financial information might have latency or contain inaccuracy, so you should be fully responsible for any of your trading and investment decisions. The company will not be responsible for your capital loss.

          Without getting permission from the website, you are not allowed to copy the website's graphics, texts, or trademarks. Intellectual property rights in the content or data incorporated into this website belong to its providers and exchange merchants.

          Not Logged In

          Log in to access more features

          Connect Broker
          Become a signal provider
          Help Center
          Customer Service
          Dark Mode
          Price Up/Down Colors

          Log In

          Sign Up

          Position
          Layout
          Fullscreen
          Default to Chart
          The chart page opens by default when you visit fastbull.com