

Markets
News
Analysis
User
24/7
Economic Calendar
Education
Data
- Names
- Latest
- Prev


Signal Accounts for Members
All Signal Accounts
All Contests
 U.K. Trade Balance Non-EU (SA) (Oct)
A:--
F: --
P: --
U.K. Trade Balance (Oct)A:--
F: --
P: --
U.K. Services Index MoMA:--
F: --
P: --
U.K. Construction Output MoM (SA) (Oct)A:--
F: --
P: --
U.K. Industrial Output YoY (Oct)A:--
F: --
P: --
U.K. Trade Balance (SA) (Oct)A:--
F: --
P: --
U.K. Trade Balance EU (SA) (Oct)A:--
F: --
P: --
U.K. Manufacturing Output YoY (Oct)A:--
F: --
P: --
U.K. GDP MoM (Oct)A:--
F: --
P: --
U.K. GDP YoY (SA) (Oct)A:--
F: --
P: --
U.K. Industrial Output MoM (Oct)A:--
F: --
P: --
U.K. Construction Output YoY (Oct)A:--
F: --
P: --
 France HICP Final MoM (Nov)
A:--
F: --
P: --
 China, Mainland Outstanding Loans Growth YoY (Nov)
A:--
F: --
P: --
China, Mainland M2 Money Supply YoY (Nov)A:--
F: --
P: --
China, Mainland M0 Money Supply YoY (Nov)A:--
F: --
P: --
China, Mainland M1 Money Supply YoY (Nov)A:--
F: --
P: --
 India CPI YoY (Nov)
A:--
F: --
P: --
India Deposit Gowth YoYA:--
F: --
P: --
 Brazil Services Growth YoY (Oct)
A:--
F: --
P: --
 Mexico Industrial Output YoY (Oct)
A:--
F: --
P: --
 Russia Trade Balance (Oct)
A:--
F: --
P: --
 Philadelphia Fed President Henry Paulson delivers a speech
 Canada Building Permits MoM (SA) (Oct)
A:--
F: --
P: --
Canada Wholesale Sales YoY (Oct)A:--
F: --
P: --
Canada Wholesale Inventory MoM (Oct)A:--
F: --
P: --
Canada Wholesale Inventory YoY (Oct)A:--
F: --
P: --
Canada Wholesale Sales MoM (SA) (Oct)A:--
F: --
P: --
 Germany Current Account (Not SA) (Oct)
A:--
F: --
P: --
U.S. Weekly Total Rig CountA:--
F: --
P: --
U.S. Weekly Total Oil Rig CountA:--
F: --
P: --
 Japan Tankan Large Non-Manufacturing Diffusion Index (Q4)
--
F: --
P: --
Japan Tankan Small Manufacturing Outlook Index (Q4)--
F: --
P: --
Japan Tankan Large Non-Manufacturing Outlook Index (Q4)--
F: --
P: --
Japan Tankan Large Manufacturing Outlook Index (Q4)--
F: --
P: --
Japan Tankan Small Manufacturing Diffusion Index (Q4)--
F: --
P: --
Japan Tankan Large Manufacturing Diffusion Index (Q4)--
F: --
P: --
Japan Tankan Large-Enterprise Capital Expenditure YoY (Q4)--
F: --
P: --
U.K. Rightmove House Price Index YoY (Dec)--
F: --
P: --
China, Mainland Industrial Output YoY (YTD) (Nov)--
F: --
P: --
China, Mainland Urban Area Unemployment Rate (Nov)--
F: --
P: --
 Saudi Arabia CPI YoY (Nov)
--
F: --
P: --
 Euro Zone Industrial Output YoY (Oct)
--
F: --
P: --
Euro Zone Industrial Output MoM (Oct)--
F: --
P: --
Canada Existing Home Sales MoM (Nov)--
F: --
P: --
Euro Zone Total Reserve Assets (Nov)--
F: --
P: --
U.K. Inflation Rate Expectations--
F: --
P: --
Canada National Economic Confidence Index--
F: --
P: --
Canada New Housing Starts (Nov)--
F: --
P: --
U.S. NY Fed Manufacturing Employment Index (Dec)--
F: --
P: --
U.S. NY Fed Manufacturing Index (Dec)--
F: --
P: --
Canada Core CPI YoY (Nov)--
F: --
P: --
Canada Manufacturing Unfilled Orders MoM (Oct)--
F: --
P: --
Canada Manufacturing New Orders MoM (Oct)--
F: --
P: --
Canada Core CPI MoM (Nov)--
F: --
P: --
Canada Manufacturing Inventory MoM (Oct)--
F: --
P: --
Canada CPI YoY (Nov)--
F: --
P: --
Canada CPI MoM (Nov)--
F: --
P: --
Canada CPI YoY (SA) (Nov)--
F: --
P: --
Canada Core CPI MoM (SA) (Nov)--
F: --
P: --

No matching data
Latest Views
Latest Views
Trending Topics
Top Columnists
Latest Update
White Label
Data API
Web Plug-ins
Affiliate Program
View All
No data

What Happened?
A number of stocks fell in the afternoon session after the latest U.S. consumer confidence report revealed underlying weakness despite a headline increase, raising concerns about future spending.
While the Conference Board's headline Consumer Confidence Index rose to 97.2 in July, the details painted a more cautious picture for investors. The Present Situation Index, a measure of consumers' assessment of current business and labor market conditions, actually fell. More telling for the sector, the report showed a decline in buying intentions for major discretionary items such as homes, cars, and most appliances. This combination of factors signals potential weakness in future consumer spending, casting a shadow over companies that rely on non-essential purchases.
The stock market overreacts to news, and big price drops can present good opportunities to buy high-quality stocks.
Among others, the following stocks were impacted:
Zooming In On WideOpenWest (WOW)
WideOpenWest’s shares are somewhat volatile and have had 10 moves greater than 5% over the last year. In that context, today’s move indicates the market considers this news meaningful but not something that would fundamentally change its perception of the business.
WideOpenWest is down 29.5% since the beginning of the year, and at $3.41 per share, it is trading 41% below its 52-week high of $5.78 from August 2024. Investors who bought $1,000 worth of WideOpenWest’s shares 5 years ago would now be looking at an investment worth $589.97.

Since January 2025, Lucky Strike has been in a holding pattern, floating around $10.40. The stock also fell short of the S&P 500’s 5.8% gain during that period.
Is there a buying opportunity in Lucky Strike, or does it present a risk to your portfolio? Get the full breakdown from our expert analysts, it’s free.
Why Do We Think Lucky Strike Will Underperform?
We're sitting this one out for now. Here are three reasons why we avoid LUCK and a stock we'd rather own.
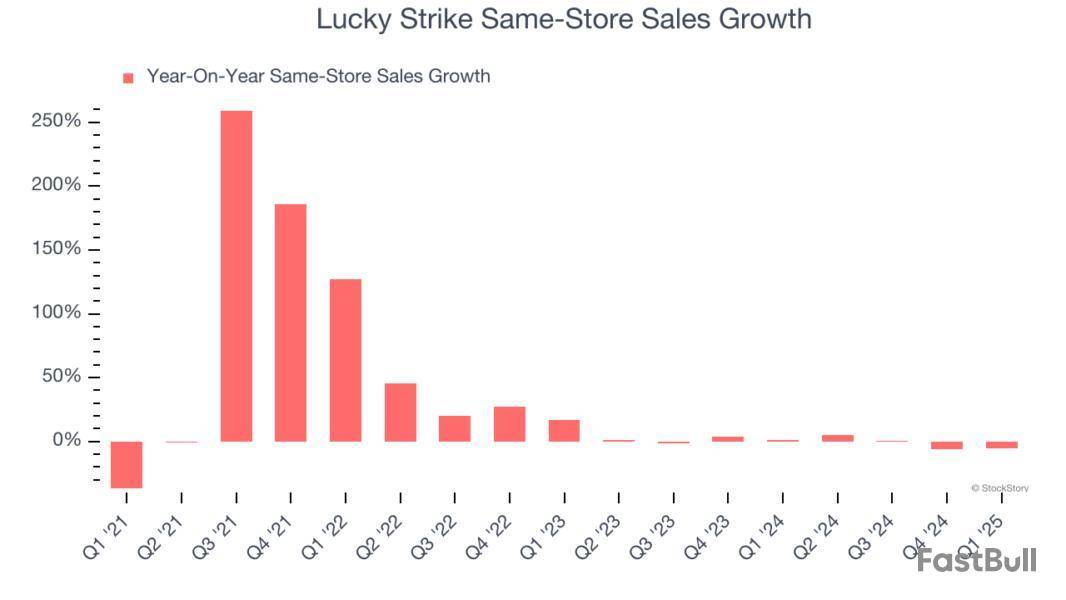
1. Flat Same-Store Sales Indicate Weak Demand
We can better understand Leisure Facilities companies by analyzing their same-store sales. This metric measures the change in sales at brick-and-mortar locations that have existed for at least a year, giving visibility into Lucky Strike’s underlying demand characteristics.
Over the last two years, Lucky Strike failed to grow its same-store sales. This performance was underwhelming and implies there may be increasing competition or market saturation. It also suggests Lucky Strike might have to change its strategy and pricing, which can disrupt operations.
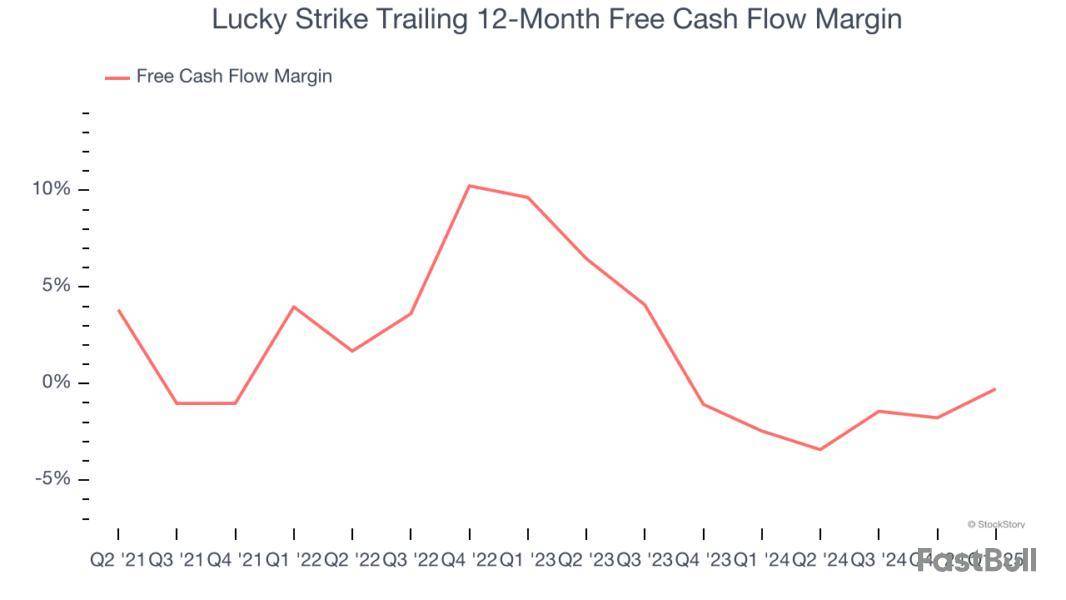
2. Cash Burn Ignites Concerns
If you’ve followed StockStory for a while, you know we emphasize free cash flow. Why, you ask? We believe that in the end, cash is king, and you can’t use accounting profits to pay the bills.
While Lucky Strike posted positive free cash flow this quarter, the broader story hasn’t been so clean. Over the last two years, Lucky Strike’s demanding reinvestments to stay relevant have drained its resources, putting it in a pinch and limiting its ability to return capital to investors. Its free cash flow margin averaged negative 1.3%, meaning it lit $1.33 of cash on fire for every $100 in revenue.
3. Short Cash Runway Exposes Shareholders to Potential Dilution
As long-term investors, the risk we care about most is the permanent loss of capital, which can happen when a company goes bankrupt or raises money from a disadvantaged position. This is separate from short-term stock price volatility, something we are much less bothered by.
Lucky Strike burned through $3.26 million of cash over the last year, and its $2.56 billion of debt exceeds the $79.09 million of cash on its balance sheet. This is a deal breaker for us because indebted loss-making companies spell trouble.
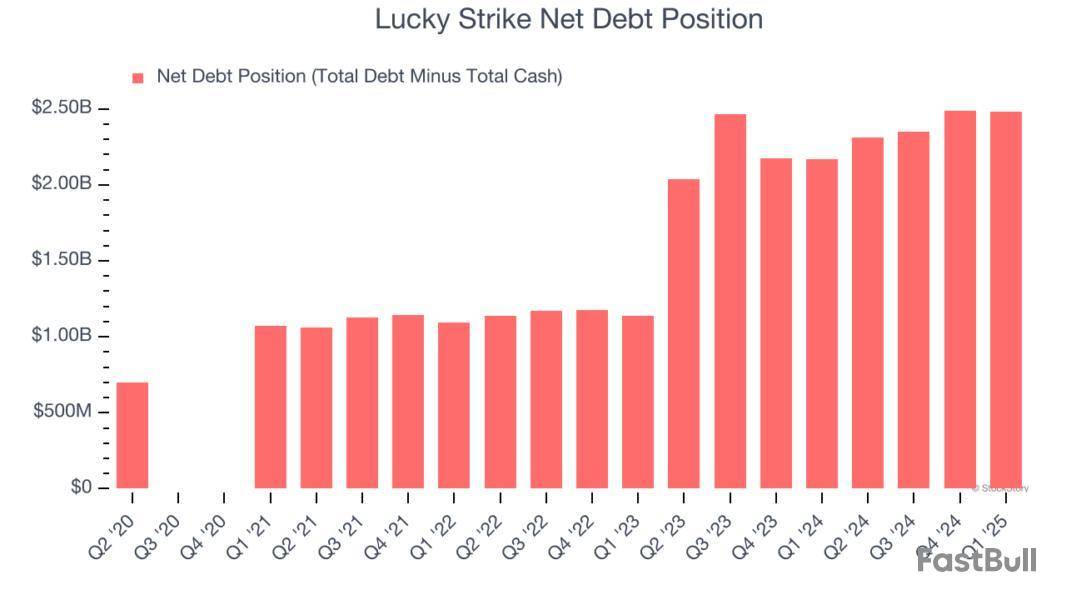
Unless the Lucky Strike’s fundamentals change quickly, it might find itself in a position where it must raise capital from investors to continue operating. Whether that would be favorable is unclear because dilution is a headwind for shareholder returns.
We remain cautious of Lucky Strike until it generates consistent free cash flow or any of its announced financing plans materialize on its balance sheet.
Final Judgment
We see the value of companies helping consumers, but in the case of Lucky Strike, we’re out. With its shares underperforming the market lately, the stock trades at 34.6× forward P/E (or $10.40 per share). This valuation is reasonable, but the company’s shaky fundamentals present too much downside risk. There are better stocks to buy right now. We’d recommend looking at one of our top software and edge computing picks.
Stocks We Like More Than Lucky Strike
Trump’s April 2024 tariff bombshell triggered a massive market selloff, but stocks have since staged an impressive recovery, leaving those who panic sold on the sidelines.
Take advantage of the rebound by checking out our Top 5 Growth Stocks for this month. This is a curated list of our High Quality stocks that have generated a market-beating return of 183% over the last five years (as of March 31st 2025).
Stocks that made our list in 2020 include now familiar names such as Nvidia (+1,545% between March 2020 and March 2025) as well as under-the-radar businesses like the once-small-cap company Comfort Systems (+782% five-year return).
StockStory is growing and hiring equity analyst and marketing roles. Are you a 0 to 1 builder passionate about the markets and AI? See the open roles here.


Earnings results often indicate what direction a company will take in the months ahead. With Q1 behind us, let’s have a look at European Wax Center and its peers.
Leisure facilities companies often sell experiences rather than tangible products, and in the last decade-plus, consumers have slowly shifted their spending from "things" to "experiences". Leisure facilities seek to benefit but must innovate to do so because of the industry's high competition and capital intensity.
The 11 leisure facilities stocks we track reported a mixed Q1. As a group, revenues missed analysts’ consensus estimates by 1.1% while next quarter’s revenue guidance was in line.
Luckily, leisure facilities stocks have performed well with share prices up 23% on average since the latest earnings results.
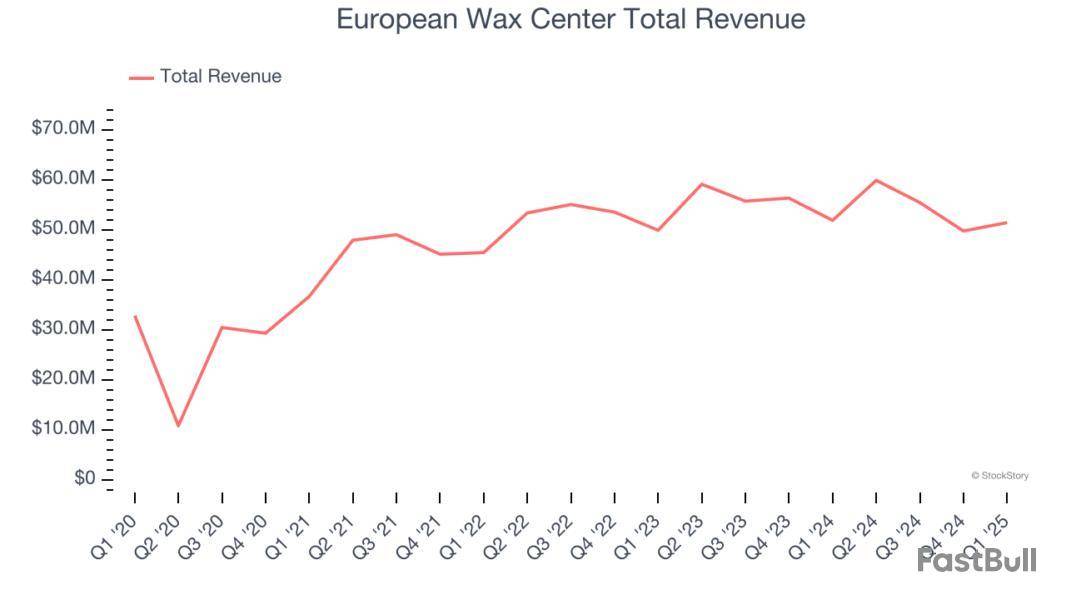
Founded by two siblings, European Wax Center is a beauty and waxing salon chain specializing in professional wax services and skincare products.
European Wax Center reported revenues of $51.43 million, flat year on year. This print exceeded analysts’ expectations by 3.7%. Overall, it was a very strong quarter for the company with an impressive beat of analysts’ EPS estimates and a solid beat of analysts’ adjusted operating income estimates.
Chris Morris, Chairman and CEO of European Wax Center, Inc. stated, “During the first quarter, we made meaningful progress against our strategic priorities and delivered solid financial performance, enabling us to reiterate our full-year outlook. We continue to advance our enhanced, data-rich marketing engine, and guest research is generating valuable insights that will shape our traffic-driving strategies. We're also strengthening our corporate infrastructure to better support franchisees through enhanced tools, resources and action plans, all while maintaining our focus on long-term network health and our goal of achieving net unit growth by the end of 2026.”
European Wax Center scored the biggest analyst estimates beat of the whole group. Unsurprisingly, the stock is up 26.4% since reporting and currently trades at $4.98.
Is now the time to buy European Wax Center? Access our full analysis of the earnings results here, it’s free.
Owner of Ticketmaster and operator of music festival EDC, Live Nation is a company specializing in live event promotion, venue management, and ticketing services for concerts and shows.
Live Nation reported revenues of $3.38 billion, down 11% year on year, falling short of analysts’ expectations by 2.8%. However, the business still had a very strong quarter with a solid beat of analysts’ EPS estimates and an impressive beat of analysts’ EBITDA estimates.
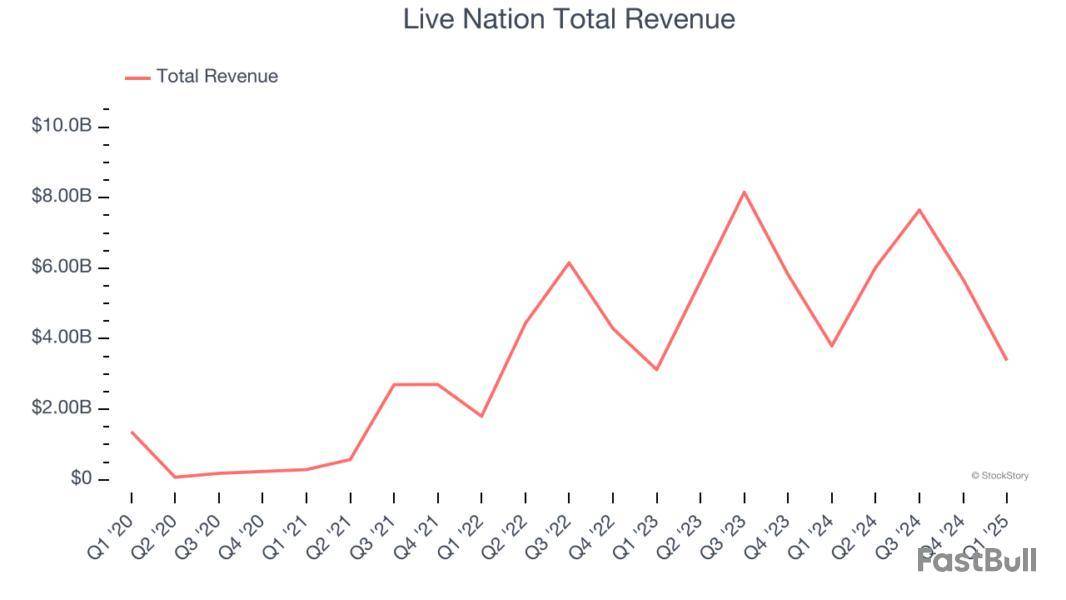
The market seems happy with the results as the stock is up 17.4% since reporting. It currently trades at $154.
Is now the time to buy Live Nation? Access our full analysis of the earnings results here, it’s free.
Born from the transformation of traditional bowling alleys into modern entertainment destinations, Lucky Strike operates bowling alleys and other entertainment venues with upscale amenities, arcade games, and food and beverage services across North America.
Lucky Strike reported revenues of $339.9 million, flat year on year, falling short of analysts’ expectations by 5.5%. It was a disappointing quarter as it posted a significant miss of analysts’ EPS estimates and a miss of analysts’ adjusted operating income estimates.
Interestingly, the stock is up 18.1% since the results and currently trades at $11.24.
Read our full analysis of Lucky Strike’s results here.
Owner of CycleBar, Rumble, and Club Pilates, Xponential Fitness is a boutique fitness brand offering diverse and specialized exercise experiences.
Xponential Fitness reported revenues of $76.88 million, down 3.5% year on year. This print surpassed analysts’ expectations by 1%. Zooming out, it was a mixed quarter as it also logged a solid beat of analysts’ adjusted operating income estimates but a significant miss of analysts’ EPS estimates.
Xponential Fitness achieved the highest full-year guidance raise among its peers. The stock is up 24% since reporting and currently trades at $10.81.
Read our full, actionable report on Xponential Fitness here, it’s free.
Founded by two brothers who purchased a struggling gym, Planet Fitness is a gym franchise that caters to casual fitness users by providing a friendly and inclusive atmosphere.
Planet Fitness reported revenues of $276.7 million, up 11.5% year on year. This result came in 1.2% below analysts' expectations. Taking a step back, it was a mixed quarter as it also recorded a solid beat of analysts’ adjusted operating income estimates but a miss of analysts’ EPS estimates.
Planet Fitness delivered the fastest revenue growth among its peers. The stock is up 11.3% since reporting and currently trades at $113.23.
Read our full, actionable report on Planet Fitness here, it’s free.
Market Update
Thanks to the Fed’s series of rate hikes in 2022 and 2023, inflation has cooled significantly from its post-pandemic highs, drawing closer to the 2% goal. This disinflation has occurred without severely impacting economic growth, suggesting the success of a soft landing. The stock market thrived in 2024, spurred by recent rate cuts (0.5% in September and 0.25% in November), and a notable surge followed Donald Trump’s presidential election win in November, propelling indices to historic highs. Nonetheless, the outlook for 2025 remains clouded by potential trade policy changes and corporate tax discussions, which could impact business confidence and growth. The path forward holds both optimism and caution as new policies take shape.


As the Q1 earnings season wraps, let’s dig into this quarter’s best and worst performers in the leisure facilities industry, including Sphere Entertainment and its peers.
Leisure facilities companies often sell experiences rather than tangible products, and in the last decade-plus, consumers have slowly shifted their spending from "things" to "experiences". Leisure facilities seek to benefit but must innovate to do so because of the industry's high competition and capital intensity.
The 11 leisure facilities stocks we track reported a mixed Q1. As a group, revenues missed analysts’ consensus estimates by 1.1% while next quarter’s revenue guidance was in line.
Luckily, leisure facilities stocks have performed well with share prices up 16.6% on average since the latest earnings results.
Famous for its viral Las Vegas Sphere venue, Sphere Entertainment hosts live entertainment events and distributes content across various media platforms.
Sphere Entertainment reported revenues of $280.6 million, down 12.7% year on year. This print fell short of analysts’ expectations by 5.6%, but it was still a strong quarter for the company with a solid beat of analysts’ EBITDA estimates and an impressive beat of analysts’ EPS estimates.
Executive Chairman and CEO James L. Dolan said, "Our Sphere segment generated positive adjusted operating income in the first quarter as we make progress on our strategic priorities for the business. We remain confident in the opportunities ahead for Sphere and our ability to drive growth this calendar year."
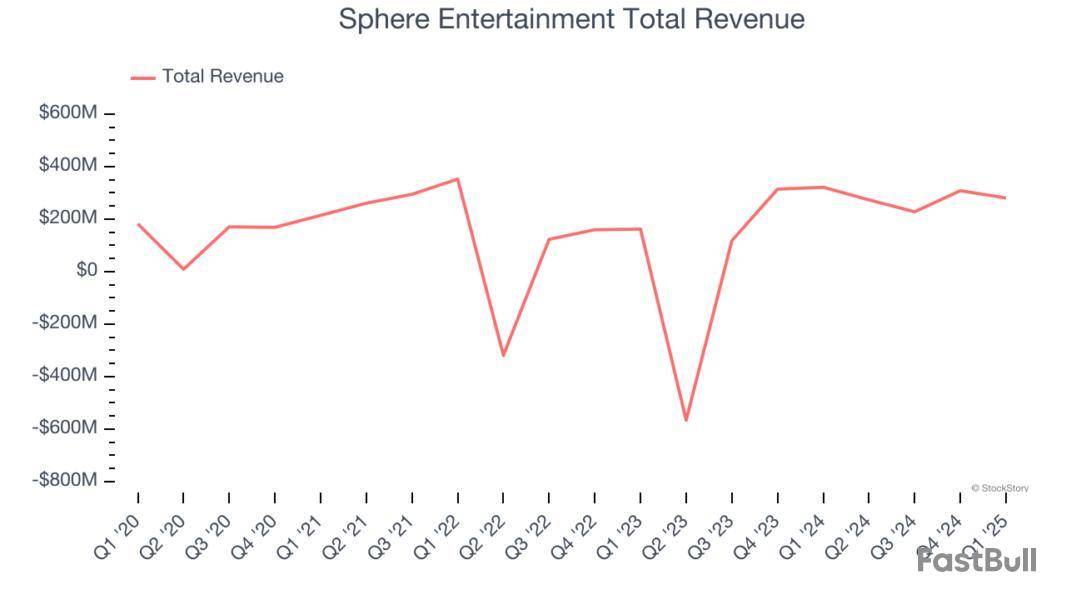
Sphere Entertainment delivered the weakest performance against analyst estimates and slowest revenue growth of the whole group. Interestingly, the stock is up 51.3% since reporting and currently trades at $44.98.
Is now the time to buy Sphere Entertainment? Access our full analysis of the earnings results here, it’s free.
Owner of Ticketmaster and operator of music festival EDC, Live Nation is a company specializing in live event promotion, venue management, and ticketing services for concerts and shows.
Live Nation reported revenues of $3.38 billion, down 11% year on year, falling short of analysts’ expectations by 2.8%. However, the business still had a very strong quarter with an impressive beat of analysts’ EPS estimates and a solid beat of analysts’ EBITDA estimates.

The market seems happy with the results as the stock is up 14.9% since reporting. It currently trades at $150.72.
Is now the time to buy Live Nation? Access our full analysis of the earnings results here, it’s free.
Born from the transformation of traditional bowling alleys into modern entertainment destinations, Lucky Strike operates bowling alleys and other entertainment venues with upscale amenities, arcade games, and food and beverage services across North America.
Lucky Strike reported revenues of $339.9 million, flat year on year, falling short of analysts’ expectations by 5.5%. It was a disappointing quarter as it posted a significant miss of analysts’ EPS estimates and a miss of analysts’ adjusted operating income estimates.
Interestingly, the stock is up 7.1% since the results and currently trades at $10.20.
Read our full analysis of Lucky Strike’s results here.
Formed between the merger of Callaway and Topgolf, Topgolf Callaway sells golf equipment and operates technology-driven golf entertainment venues.
Topgolf Callaway reported revenues of $1.09 billion, down 4.5% year on year. This print beat analysts’ expectations by 2.2%. More broadly, it was a satisfactory quarter as it also produced an impressive beat of analysts’ EPS estimates but full-year EBITDA guidance missing analysts’ expectations significantly.
Topgolf Callaway had the weakest full-year guidance update among its peers. The stock is up 20.3% since reporting and currently trades at $9.53.
Read our full, actionable report on Topgolf Callaway here, it’s free.
Founded by two brothers who purchased a struggling gym, Planet Fitness is a gym franchise that caters to casual fitness users by providing a friendly and inclusive atmosphere.
Planet Fitness reported revenues of $276.7 million, up 11.5% year on year. This number came in 1.2% below analysts' expectations. Zooming out, it was a mixed quarter as it also recorded an impressive beat of analysts’ adjusted operating income estimates but a miss of analysts’ EPS estimates.
Planet Fitness delivered the fastest revenue growth among its peers. The stock is up 8.2% since reporting and currently trades at $110.14.
Read our full, actionable report on Planet Fitness here, it’s free.
Market Update
The Fed’s interest rate hikes throughout 2022 and 2023 have successfully cooled post-pandemic inflation, bringing it closer to the 2% target. Inflationary pressures have eased without tipping the economy into a recession, suggesting a soft landing. This stability, paired with recent rate cuts (0.5% in September 2024 and 0.25% in November 2024), fueled a strong year for the stock market in 2024. The markets surged further after Donald Trump’s presidential victory in November, with major indices reaching record highs in the days following the election. Still, questions remain about the direction of economic policy, as potential tariffs and corporate tax changes add uncertainty for 2025.


Quarterly earnings results are a good time to check in on a company’s progress, especially compared to its peers in the same sector. Today we are looking at AMC Entertainment and the best and worst performers in the leisure facilities industry.
Leisure facilities companies often sell experiences rather than tangible products, and in the last decade-plus, consumers have slowly shifted their spending from "things" to "experiences". Leisure facilities seek to benefit but must innovate to do so because of the industry's high competition and capital intensity.
The 11 leisure facilities stocks we track reported a mixed Q1. As a group, revenues missed analysts’ consensus estimates by 1.1% while next quarter’s revenue guidance was in line.
Luckily, leisure facilities stocks have performed well with share prices up 14.2% on average since the latest earnings results.
With a profile that was raised due to meme stock mania beginning in 2021, AMC Entertainment operates movie theaters primarily in the US and Europe.
AMC Entertainment reported revenues of $862.5 million, down 9.3% year on year. This print fell short of analysts’ expectations by 0.7%, but it was still a strong quarter for the company with a solid beat of analysts’ EBITDA estimates and a decent beat of analysts’ adjusted operating income estimates.
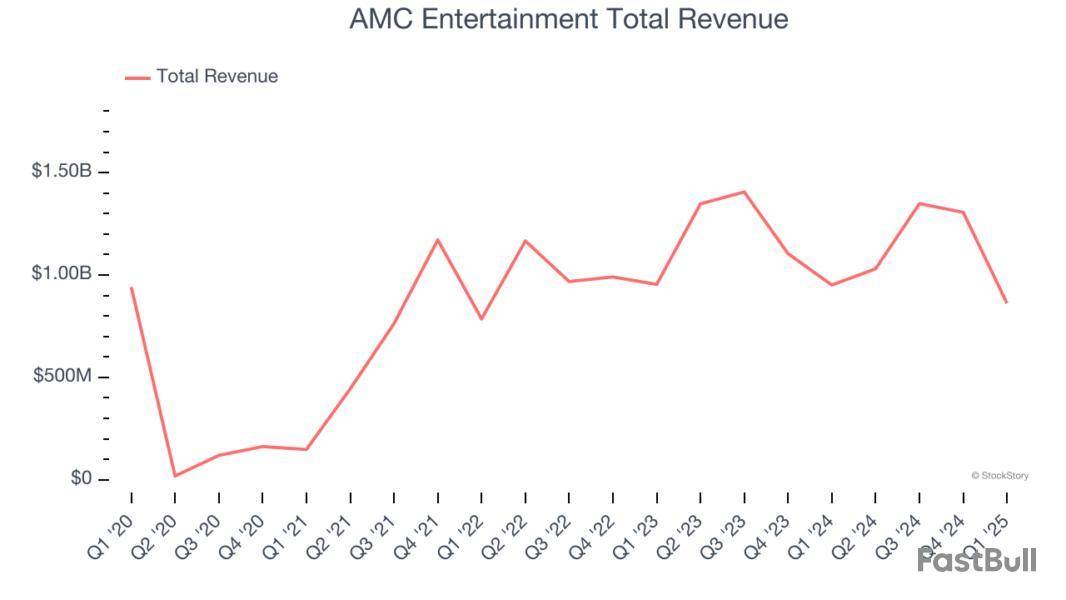
Interestingly, the stock is up 15.1% since reporting and currently trades at $3.12.
Is now the time to buy AMC Entertainment? Access our full analysis of the earnings results here, it’s free.
Owner of Ticketmaster and operator of music festival EDC, Live Nation is a company specializing in live event promotion, venue management, and ticketing services for concerts and shows.
Live Nation reported revenues of $3.38 billion, down 11% year on year, falling short of analysts’ expectations by 2.8%. However, the business still had a very strong quarter with a solid beat of analysts’ EPS estimates and an impressive beat of analysts’ EBITDA estimates.

The market seems happy with the results as the stock is up 9.9% since reporting. It currently trades at $144.21.
Is now the time to buy Live Nation? Access our full analysis of the earnings results here, it’s free.
Born from the transformation of traditional bowling alleys into modern entertainment destinations, Lucky Strike operates bowling alleys and other entertainment venues with upscale amenities, arcade games, and food and beverage services across North America.
Lucky Strike reported revenues of $339.9 million, flat year on year, falling short of analysts’ expectations by 5.5%. It was a disappointing quarter as it posted a significant miss of analysts’ EPS estimates and a miss of analysts’ adjusted operating income estimates.
Interestingly, the stock is up 5.6% since the results and currently trades at $10.05.
Read our full analysis of Lucky Strike’s results here.
Famous for its viral Las Vegas Sphere venue, Sphere Entertainment hosts live entertainment events and distributes content across various media platforms.
Sphere Entertainment reported revenues of $280.6 million, down 12.7% year on year. This number lagged analysts' expectations by 5.6%. In spite of that, it was a strong quarter as it put up an impressive beat of analysts’ EBITDA estimates and a solid beat of analysts’ EPS estimates.
Sphere Entertainment had the weakest performance against analyst estimates and slowest revenue growth among its peers. The stock is up 43.3% since reporting and currently trades at $42.60.
Read our full, actionable report on Sphere Entertainment here, it’s free.
Founded by a former game parlor and bar operator, Dave & Buster’s operates a chain of arcades providing immersive entertainment experiences.
Dave & Buster's reported revenues of $567.7 million, down 3.5% year on year. This result met analysts’ expectations. Taking a step back, it was a slower quarter as it recorded a significant miss of analysts’ EPS estimates and a slight miss of analysts’ same-store sales estimates.
The stock is up 16.7% since reporting and currently trades at $30.20.
Read our full, actionable report on Dave & Buster's here, it’s free.
Market Update
As a result of the Fed’s rate hikes in 2022 and 2023, inflation has come down from frothy levels post-pandemic. The general rise in the price of goods and services is trending towards the Fed’s 2% goal as of late, which is good news. The higher rates that fought inflation also didn't slow economic activity enough to catalyze a recession. So far, soft landing. This, combined with recent rate cuts (half a percent in September 2024 and a quarter percent in November 2024) have led to strong stock market performance in 2024. The icing on the cake for 2024 returns was Donald Trump’s victory in the U.S. Presidential Election in early November, sending major indices to all-time highs in the week following the election. Still, debates around the health of the economy and the impact of potential tariffs and corporate tax cuts remain, leaving much uncertainty around 2025.
728 RM B 7/F GEE LOK IND BLDG NO 34 HUNG TO RD KWUN TONG KLN HONG KONG


White Label
Data API
Web Plug-ins
Poster Maker
Affiliate Program
The risk of loss in trading financial instruments such as stocks, FX, commodities, futures, bonds, ETFs and crypto can be substantial. You may sustain a total loss of the funds that you deposit with your broker. Therefore, you should carefully consider whether such trading is suitable for you in light of your circumstances and financial resources.
No decision to invest should be made without thoroughly conducting due diligence by yourself or consulting with your financial advisors. Our web content might not suit you since we don't know your financial conditions and investment needs. Our financial information might have latency or contain inaccuracy, so you should be fully responsible for any of your trading and investment decisions. The company will not be responsible for your capital loss.
Without getting permission from the website, you are not allowed to copy the website's graphics, texts, or trademarks. Intellectual property rights in the content or data incorporated into this website belong to its providers and exchange merchants.
Not Logged In
Log in to access more features

FastBull Membership
Not yet
Purchase


Log In
Sign Up


