Markets
News
Analysis
User
24/7
Economic Calendar
Education
Data
- Names
- Latest
- Prev


Signal Accounts for Members
All Signal Accounts
All Contests


U.K. Trade Balance Non-EU (SA) (Oct)A:--
F: --
P: --
U.K. Trade Balance (Oct)A:--
F: --
P: --
U.K. Services Index MoMA:--
F: --
P: --
U.K. Construction Output MoM (SA) (Oct)A:--
F: --
P: --
U.K. Industrial Output YoY (Oct)A:--
F: --
P: --
U.K. Trade Balance (SA) (Oct)A:--
F: --
P: --
U.K. Trade Balance EU (SA) (Oct)A:--
F: --
P: --
U.K. Manufacturing Output YoY (Oct)A:--
F: --
P: --
U.K. GDP MoM (Oct)A:--
F: --
P: --
U.K. GDP YoY (SA) (Oct)A:--
F: --
P: --
U.K. Industrial Output MoM (Oct)A:--
F: --
P: --
U.K. Construction Output YoY (Oct)A:--
F: --
P: --
France HICP Final MoM (Nov)A:--
F: --
P: --
China, Mainland Outstanding Loans Growth YoY (Nov)A:--
F: --
P: --
China, Mainland M2 Money Supply YoY (Nov)A:--
F: --
P: --
China, Mainland M0 Money Supply YoY (Nov)A:--
F: --
P: --
China, Mainland M1 Money Supply YoY (Nov)A:--
F: --
P: --
India CPI YoY (Nov)A:--
F: --
P: --
India Deposit Gowth YoYA:--
F: --
P: --
Brazil Services Growth YoY (Oct)A:--
F: --
P: --
Mexico Industrial Output YoY (Oct)A:--
F: --
P: --
Russia Trade Balance (Oct)A:--
F: --
P: --
Philadelphia Fed President Henry Paulson delivers a speech
Canada Building Permits MoM (SA) (Oct)A:--
F: --
P: --
Canada Wholesale Sales YoY (Oct)A:--
F: --
P: --
Canada Wholesale Inventory MoM (Oct)A:--
F: --
P: --
Canada Wholesale Inventory YoY (Oct)A:--
F: --
P: --
Canada Wholesale Sales MoM (SA) (Oct)A:--
F: --
P: --
Germany Current Account (Not SA) (Oct)A:--
F: --
P: --
U.S. Weekly Total Rig CountA:--
F: --
P: --
U.S. Weekly Total Oil Rig CountA:--
F: --
P: --
Japan Tankan Large Non-Manufacturing Diffusion Index (Q4)--
F: --
P: --
Japan Tankan Small Manufacturing Outlook Index (Q4)--
F: --
P: --
Japan Tankan Large Non-Manufacturing Outlook Index (Q4)--
F: --
P: --
Japan Tankan Large Manufacturing Outlook Index (Q4)--
F: --
P: --
Japan Tankan Small Manufacturing Diffusion Index (Q4)--
F: --
P: --
Japan Tankan Large Manufacturing Diffusion Index (Q4)--
F: --
P: --
Japan Tankan Large-Enterprise Capital Expenditure YoY (Q4)--
F: --
P: --
U.K. Rightmove House Price Index YoY (Dec)--
F: --
P: --
China, Mainland Industrial Output YoY (YTD) (Nov)--
F: --
P: --
China, Mainland Urban Area Unemployment Rate (Nov)--
F: --
P: --
Saudi Arabia CPI YoY (Nov)--
F: --
P: --
Euro Zone Industrial Output YoY (Oct)--
F: --
P: --
Euro Zone Industrial Output MoM (Oct)--
F: --
P: --
Canada Existing Home Sales MoM (Nov)--
F: --
P: --
Euro Zone Total Reserve Assets (Nov)--
F: --
P: --
U.K. Inflation Rate Expectations--
F: --
P: --
Canada National Economic Confidence Index--
F: --
P: --
Canada New Housing Starts (Nov)--
F: --
P: --
U.S. NY Fed Manufacturing Employment Index (Dec)--
F: --
P: --
U.S. NY Fed Manufacturing Index (Dec)--
F: --
P: --
Canada Core CPI YoY (Nov)--
F: --
P: --
Canada Manufacturing Unfilled Orders MoM (Oct)--
F: --
P: --
Canada Manufacturing New Orders MoM (Oct)--
F: --
P: --
Canada Core CPI MoM (Nov)--
F: --
P: --
Canada Manufacturing Inventory MoM (Oct)--
F: --
P: --
Canada CPI YoY (Nov)--
F: --
P: --
Canada CPI MoM (Nov)--
F: --
P: --
Canada CPI YoY (SA) (Nov)--
F: --
P: --
Canada Core CPI MoM (SA) (Nov)--
F: --
P: --


No matching data
Latest Views
Latest Views
Trending Topics
Top Columnists
Latest Update
White Label
Data API
Web Plug-ins
Affiliate Program
View All

No data
Litecoin (LTC) is back in the spotlight as bullish momentum sweeps across the crypto market. After months of volatility and sideways action, Litecoin is showing signs of strength, pushing above key technical levels and attracting fresh investor interest. The broader market recovery, fueled by optimism in Bitcoin and Ethereum, has created favorable conditions for altcoins to regain traction, and Litecoin could be one of the biggest beneficiaries.
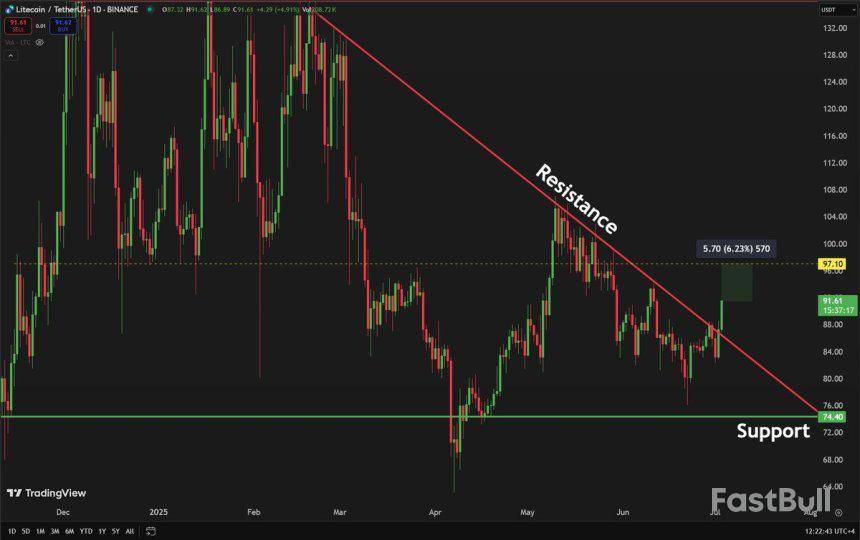
Top analyst Carl Runefelt recently shared a technical analysis highlighting a major development: Litecoin has broken above a key level on the daily chart. This breakout is a critical technical signal, suggesting a potential trend reversal after weeks of consolidation and indecision. While resistance remains overhead, analysts believe that a confirmed reclaim of this level as support could trigger an expansive phase for LTC, opening the door to strong upside moves.
As institutional interest in crypto grows and macroeconomic conditions stabilize, assets like Litecoin—known for speed, low fees, and high liquidity—may attract attention from traders and investors seeking asymmetric returns. With momentum on its side and market sentiment shifting, the coming days will be crucial to determine whether Litecoin can turn this breakout into a full-scale rally.
Litecoin Bullish Momentum And ETF Hopes Fuel Rally
Litecoin (LTC) is gaining bullish traction as price action strengthens and investor sentiment improves across the crypto market. Currently trading above $90, Litecoin has broken out of its downward trend, signaling renewed buying interest and technical strength. This move is particularly significant, given months of sideways consolidation and the broader market’s gradual recovery.
According to Carl Runefelt, Litecoin has decisively broken above its descending resistance on the daily chart—a bullish technical setup that could pave the way for further gains. Runefelt believes the next target is $97.10, a level that, if reached and held, could mark the start of a new upward leg for LTC. The recent breakout has reignited interest in Litecoin’s medium-term prospects, especially as traders look for altcoins with momentum and untapped upside.
Adding to the optimism is speculation surrounding a potential Litecoin spot Exchange-Traded Fund (ETF). According to Bloomberg, the probability of approval for a Litecoin spot ETF by October 2 (local time) has risen to an impressive 95%. Such a product would offer institutional investors a new and regulated vehicle to gain exposure to LTC, potentially unlocking significant inflows.
With favorable technicals and strong fundamentals aligning, Litecoin appears poised for a breakout. The coming days will be critical as bulls aim to confirm support above $90 and push toward the $97.10 resistance. If ETF approval expectations continue to build alongside broader market momentum, Litecoin could emerge as one of the top-performing altcoins of the current cycle.
LTC Price Action: Key Levels To Reclaim
Litecoin (LTC) is showing strong bullish momentum after breaking above a key descending resistance level on the daily chart. As seen in the chart, LTC surged over 4% in the last session, closing at $91.23. This breakout follows weeks of tight consolidation near the $85 zone and signals growing interest as market sentiment improves across the board.
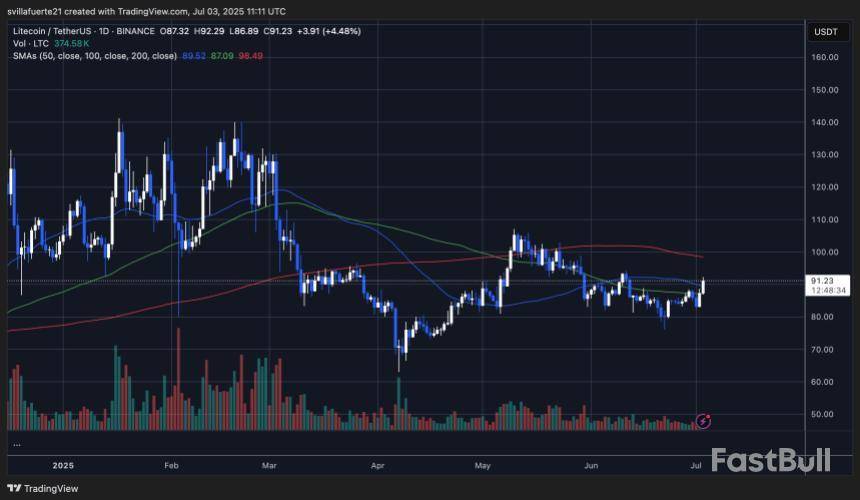
Price has now moved decisively above the 50-day and 100-day moving averages, which have acted as resistance in recent weeks. The next challenge lies at the 200-day moving average, currently near $98.50, which aligns closely with the analyst-projected target of $97.10. Reclaiming that level would confirm a full trend reversal and open the door to testing the $100 psychological level.
Volume has also picked up, supporting the breakout and suggesting that buyers are stepping in. If bulls maintain momentum and consolidate above $90, Litecoin could confirm a shift in market structure and set the stage for a broader rally. On the downside, any rejection at the 200-day MA could trigger a retest of the $87–$89 support area.
Featured image from Dall-E, chart from TradingView
With a clear break above the 50-day Exponential Moving Average, XRP has finally broken through one of its most important resistance levels. The 50 EMA has kept XRP stuck in an uninspired sideways channel and consistently rejected price rallies for months, acting as a lid on any significant upside. But this new action marks a shift in the tide and possibly the beginning of a real recovery.
The innovation goes beyond mere technical interest. Breaking through this barrier could signal the start of a long-term bull run for XRP given its lengthy stagnation. The 50 EMA has historically been used to draw a line between bullish and bearish sentiment, and its recovery is frequently one of the first indications that the market is ready to resume taking risks. Chart by TradingView">
XRP is making a strong statement with today's close above $2.28: the sellers are finally losing ground. Additionally volume makes the move seem more credible. The increase in trading activity indicates that this is not merely a lone short squeeze or a one-time spike brought on by a lack of liquidity.
The Relative Strength Index (RSI) ascent to 57 indicates that buyers seem dedicated and that momentum is firmly shifting. XRP's price action is compressing above all of the major moving averages, which is particularly encouraging. If this rally can sustain momentum, a golden cross — a bullish crossover of shorter-term EMAs above long-term ones — could occur. The 100 and 200 EMAs are both within striking distance.
Regaining $2.50 and ultimately retesting the psychological $3 level are the next goals, which are obvious. Now, that structural resistance has finally been broken, XRP has made it possible for a true reversal. This breakout could mark the beginning of a long-awaited comeback, making it more than just a technical footnote.
Dogecoin's push
Following weeks of sluggish price movement, Dogecoin has at last provided a much-needed jolt of optimism. As of right now, DOGE has clearly surpassed its 26 EMA on the daily chart, which is a crucial technical milestone that might pave the way to a more extensive recovery. Dogecoin repeatedly failed to regain short-term moving averages as it moved lower in a controlled downtrend for the majority of June.
Due to this ongoing weakness, the meme asset was unable to generate any bullish momentum and was trapped below its 26 EMA. Today's candle is different, though, as it broke above this dynamic resistance with a healthy 2.3% gain and an increase in volume, indicating that sidelined buyers were participating.
A similar pattern has historically been seen at the start of DOGE rallies: a steady grind into the 26 EMA followed by a breakout candle that changes the market's sentiment from neutral to cautiously optimistic. Regaining the 26 EMA was obviously the first step in putting an end to the string of lower highs that have dogged the asset since May, even though the price is still trading below the heavier-weighted 50 and 100 EMAs, which are still overhead barriers. Also getting better are technical momentum indicators.
The daily RSI has risen to 51, returning to neutral territory but escaping the oversold state. Because of this DOGE has more time to run before any overbought signals appear. The $0.19-$0.20 range, where the 50 EMA and 100 EMA are convergent with horizontal resistance from early June, are the next important levels to keep an eye on.
It would be possible for Dogecoin to retest the psychologically significant $0.22 region if it were to break through this band. Dogecoin is showing signs of life at last. Although one bullish candle does not ensure a long-term reversal, this breakout above the 26 EMA is an important technical development that could contribute to the restoration of momentum and confidence in DOGE's upside potential.
Ethereum secures breakthrough
Ethereum just produced its biggest breakout in months, breaking through the $2,600 barrier for the first time since May. Following weeks of consolidation and low conviction price action, this surge is more than just a transient technical reaction; it is an obvious indication that momentum is finally turning back in favor of the bulls.
Now ETH has closed a daily candle above all of its major moving averages after grinding sideways between the 50 and 100 EMAs for the majority of June. Among these is the 200 EMA, which since mid-June had been limiting attempts to rise. It is critical to break through this level because it not only turns a significant structural resistance into support but also indicates that market players are prepared to assume greater risk in the hope of future gains.
A significant increase in volume coincides with the breakout, which is a crucial indicator that this is more than a passing squeeze. There is still potential for the rally to continue before the market becomes overbought, as indicated by the RSI's strong move into bullish territory and its approach to 58.
Now that $2,600 has been reclaimed, traders ought to be focusing on the upcoming key resistance levels. The next psychological barrier, if the current momentum holds, is $3,000, which would represent a complete recovery from the decline that began in late March.
Even though this breakout is clearly positive, traders should remain vigilant because a retest of the $2,500-$2,550 range could confirm support. The case for a sustained upward move would be strengthened if buyers recovered from such a pullback.
The Dogecoin price may be setting up for a significant rally as a technical analyst identifies a bullish breakout above the 50-day trendline. After months of compressed price action, the meme coin now appears poised to conclude its downtrend, igniting fresh optimism within the crypto community.
Dogecoin Price Set For Game-Changing Rally
Trader Tardigrade, a crypto market analyst, announced in an X (formerly Twitter) post on July 1 that the Dogecoin price has just broken above a critical 50-day descending trendline on its daily chart. With this new development, the analyst anticipates the potential start of a powerful upward price movement soon.
Notably, the trendline breakout marks a significant shift in momentum for Dogecoin, which had been locked in a consistent downtrend over several weeks. The leading meme coin is currently trading at $0.17, having declined by almost 10% over the past month, according to CoinMarketCap.
With the potential end of this market downturn in sight, Trader Tardigrade suggests that DOGE’s microstructure is now beginning to show early signs of a bullish reversal pattern. In his price chart, the analyst notes that Dogecoin established a higher low, followed by a higher high after its breakout above the long-standing trendline.
More recently, a second higher low has formed, reinforcing the possibility that a new uptrend is underway. This structure, characterized by successively higher highs and lows, is often seen as the earliest confirmation that buyers could be regaining control of the market.
The breakout is also especially significant because it follows an extended period of lower lows and lower highs, with the 50-day trendline acting as a strong resistance barrier throughout. With that resistance now breached and early signs of a bullish market structure developing, Trader Tardigrade is increasingly optimistic about Dogecoin’s near-term prospects. If the current trend persists, it could signal the start of a sustained rally for the meme coin.
Analyst Says Dogecoin Below $0.2 Is Free
In a separate analysis, market expert Kaleo disclosed that Dogecoin’s current price below $0.20 presents a strong accumulation opportunity, implying that the meme coin is significantly undervalued when compared to its potential upside. Backing his view with a chart, the analyst projected that the Dogecoin price may be on the verge of a major breakout, with possible upside targets indicating a surge toward $1.5 and possibly beyond $ 3.50.
Kaleo’s chart analysis highlights strong similarities between Dogecoin’s current market structure, following the April 2024 Bitcoin halving, and the 2020 breakout that preceded the meme coin’s historic bull run. In 2020, Dogecoin traded sideways within a Falling Wedge pattern for months before a breakout triggered a parabolic surge to fresh ATHs. The current price action exhibits a nearly identical setup, with the meme coin now emerging from a similar multi-year Falling Wedge, potentially setting the stage for another historic bull rally.
In a recent post on X, Michael Steinbach highlighted that Toncoin’s current price is at $2.80, which he considers one of the most exciting levels of the year. With momentum building, Steinbach noted that traders everywhere are now asking the same question: Is a breakout finally underway, or is a sharp sell-off just around the corner?
Toncoin Locked In A Narrow Range Between $2.70 And $2.80
Analyzing the daily chart, Michael Steinbach points out that Toncoin has been locked in a tight range between $2.70 as support and $2.80 as resistance for several weeks now. He warns that jumping into the market without a clear plan is a recipe for losses, especially when others are already navigating these well-defined zones with precision.
He highlights the RSI sitting at 39, a relatively weak position. While it’s not yet in oversold territory, Steinbach notes that buyers may be holding off for deeper levels. Back in April, a strong rebound occurred from below 30, making the 30–32 zone a critical area to watch for potential bullish reactions.
In terms of risk, Steinbach warns that a break below the $2.70 support could hand control over to the bears. If that level fails, the next downside targets to watch are $2.50 and, in a worst-case scenario, $2.00. He reminds traders that repeated tests of a support zone tend to weaken it over time, and when it finally cracks, the fallout can come fast.
Whether watching for a breakout or a breakdown, having a plan is essential. Reacting after the crowd moves rarely pays off; it’s the calm, pre-planned decisions that give traders the edge when volatility strikes.
Breakout Or Pullback? Define The Setup Before Entering
In outlining the bullish scenario, the analyst noted that if Toncoin manages to secure a daily close above the $2.80 resistance, momentum could quickly follow through. This breakout could open the path toward $3.00, with an extended target near $3.40, representing a potential 26% gain from current levels. That’s the kind of upside savvy traders prepare for.
So, what’s the key takeaway? According to the analyst, successful trading doesn’t rely on gut feeling; it requires well-defined triggers. That means either entering on a confirmed breakout above $2.80 with a stop-loss just below, or stepping back and waiting for a pullback that aligns with RSI signals. The focus should always be on minimizing risk while allowing profits room to grow.
As for now, the analyst sees the trend as sideways to slightly bearish. Until the chart sends a crystal-clear signal, the best approach is patience — no FOMO trades, no blind bets, just disciplined setups.
Long‑term holders of Bitcoin may need to see a fresh high around $140,000 before they enjoy the same kind of profits they saw earlier this cycle.
According to CryptoQuant, that price point lines up with past peaks in realized gains for those who have kept their coins untouched for at least six months.
‘Market Magnet’ Theory
CryptoQuant used the Market Value to Realized Value (MVRV) ratio to track how deep in profit holders are right now. Based on reports, the average realized profit for long‑term holders stands at about 220%.
That sounds healthy. But in March and December 2024, holders were sitting on roughly 300% and 350% gains, respectively.
The gap between today’s 220% and those earlier highs is what Darkfost, a CryptoQuant contributor, calls a form of “market magnet.” Many are calling for $140,000 BTC so that unrealized profits match the cycle’s top levels.
Profit‑Taking Trends
Long‑term investors have been selling as Bitcoin flirts with new highs. Recent data shows that these holders have driven much of the selling pressure in the past few weeks.
The average cost basis for this group — the realized price — is near $33,800. That means anyone buying before six months ago would need Bitcoin to reach $33,800 just to break even.
And to hit the profit levels of March and December 2024, BTC must climb to $140,000. This dynamic pushes some traders to lock in gains early, while others hold on for bigger moves. Super Majority Still In The Green
Based on reports, a super majority of Bitcoin investors are sitting on unrealized profits worth a combined $2.5 trillion. That number reflects the overall strength of the market’s recent rally.
Even so, many investors remain confident that fresh buying can soak up any waves of profit‑taking. The current phase feels like a pause.
Buyers and sellers are sizing each other up. The question now is whether demand will pick up enough to drive that magnet‑level price.Cycle Outlook And Next Steps
Analysts said that Bitcoin looks ready for a post‑breakout retest after breaking a multi‑week downtrend that began in mid‑May.
They added that the bull run might only have several months left before a final surge and then a change in trend.
If this view holds, that final push could be the moment when BTC nears or even hits $140,000. After that, history suggests a sharp peak and then a cool-down.
Featured image from Imagen, chart from TradingView
White Label
Data API
Web Plug-ins
Poster Maker
Affiliate Program
The risk of loss in trading financial instruments such as stocks, FX, commodities, futures, bonds, ETFs and crypto can be substantial. You may sustain a total loss of the funds that you deposit with your broker. Therefore, you should carefully consider whether such trading is suitable for you in light of your circumstances and financial resources.
No decision to invest should be made without thoroughly conducting due diligence by yourself or consulting with your financial advisors. Our web content might not suit you since we don't know your financial conditions and investment needs. Our financial information might have latency or contain inaccuracy, so you should be fully responsible for any of your trading and investment decisions. The company will not be responsible for your capital loss.
Without getting permission from the website, you are not allowed to copy the website's graphics, texts, or trademarks. Intellectual property rights in the content or data incorporated into this website belong to its providers and exchange merchants.
Not Logged In
Log in to access more features

FastBull Membership
Not yet
Purchase
Log In
Sign Up