• Trade
  • Markets
  • Copy
  • Contests
  • News
  • 24/7
  • Calendar
  • Q&A
  • Chats
Trending
Screeners
SYMBOL
LAST
BID
ASK
HIGH
LOW
NET CHG.
%CHG.
SPREAD
SPX
S&P 500 Index
6827.42
6827.42
6827.42
6899.86
6801.80
-73.58
-1.07%
--
DJI
Dow Jones Industrial Average
48458.04
48458.04
48458.04
48886.86
48334.10
-245.98
-0.51%
--
IXIC
NASDAQ Composite Index
23195.16
23195.16
23195.16
23554.89
23094.51
-398.69
-1.69%
--
USDX
US Dollar Index
97.950
98.030
97.950
98.500
97.950
-0.370
-0.38%
--
EURUSD
Euro / US Dollar
1.17394
1.17409
1.17394
1.17496
1.17192
+0.00011
+ 0.01%
--
GBPUSD
Pound Sterling / US Dollar
1.33707
1.33732
1.33707
1.33997
1.33419
-0.00148
-0.11%
--
XAUUSD
Gold / US Dollar
4299.39
4299.39
4299.39
4353.41
4257.10
+20.10
+ 0.47%
--
WTI
Light Sweet Crude Oil
57.233
57.485
57.233
58.011
56.969
-0.408
-0.71%
--

Community Accounts

Signal Accounts
--
Profit Accounts
--
Loss Accounts
--
View More

Become a signal provider

Sell trading signals to earn additional income

View More

Guide to Copy Trading

Get started with ease and confidence

View More

Signal Accounts for Members

All Signal Accounts

Best Return
  • Best Return
  • Best P/L
  • Best MDD
Past 1W
  • Past 1W
  • Past 1M
  • Past 1Y

All Contests

  • All
  • Trump Updates
  • Recommend
  • Stocks
  • Cryptocurrencies
  • Central Banks
  • Featured News
Top News Only
Share

USA Embassy In Lithuania: Maria Kalesnikava Is Not Going To Vilnius

Share

USA Embassy In Lithuania: Other Prisoners Are Being Sent From Belarus To Ukraine

Share

Ukraine President Zelenskiy: Five Ukrainians Released By Belarus In US-Brokered Deal

Share

USA Vilnius Embassy: USA Stands Ready For "Additional Engagement With Belarus That Advances USA Interests"

Share

USA Vilnius Embassy: Belarus, USA, Other Citizens Among The Prisoners Released Into Lithuania

Share

USA Vilnius Embassy: USA Will Continue Diplomatic Efforts To Free The Remaining Political Prisoners In Belarus

Share

USA Vilnius Embassy: Belarus Releases 123 Prisoners Following Meeting Of President Trump's Envoy Coale And Belarus President Lukashenko

Share

USA Vilnius Embassy: Masatoshi Nakanishi, Aliaksandr Syrytsa Are Among The Prisoners Released By Belarus

Share

USA Vilnius Embassy: Maria Kalesnikava And Viktor Babaryka Are Among The Prisoners Released By Belarus

Share

USA Vilnius Embassy: Nobel Peace Prize Laureate Ales Bialiatski Is Among The Prisoners Released By Belarus

Share

Belarusian Presidential Administration Telegram Channel: Lukashenko Has Pardoned 123 Prisoners As Part Of Deal With US

Share

Two Local Syrian Officials: Joint US-Syrian Military Patrol In Central Syria Came Under Fire From Unknown Assailants

Share

Israeli Military Says It Targeted 'Key Hamas Terrorist' In Gaza City

Share

Rwanda's Actions In Eastern Drc Are A Clear Violation Of Washington Accords Signed By President Trump - Secretary Of State Rubio

Share

Israeli Military Issues Evacuation Warning In Southern Lebanon Village Ahead Of Strike - Spokesperson On X

Share

Belarusian State Media Cites US Envoy Coale As Saying He Discussed Ukraine And Venezuela With Lukashenko

Share

Belarusian State Media Cites US Envoy Coale As Saying That US Removes Sanctions On Belarusian Potassium

Share

Thai Prime Minister: No Ceasefire Agreement With Cambodia

Share

US, Ukraine To Discuss Ceasefire In Berlin Ahead Of European Summit

Share

Incoming Czech Prime Minister Babis: Czech Republic Will Not Take On Guarantees For Ukraine Financing, European Commission Must Find Alternatives

TIME
ACT
FCST
PREV
U.K. Trade Balance Non-EU (SA) (Oct)

A:--

F: --

P: --

U.K. Trade Balance (Oct)

A:--

F: --

P: --

U.K. Services Index MoM

A:--

F: --

P: --

U.K. Construction Output MoM (SA) (Oct)

A:--

F: --

P: --

U.K. Industrial Output YoY (Oct)

A:--

F: --

P: --

U.K. Trade Balance (SA) (Oct)

A:--

F: --

P: --

U.K. Trade Balance EU (SA) (Oct)

A:--

F: --

P: --

U.K. Manufacturing Output YoY (Oct)

A:--

F: --

P: --

U.K. GDP MoM (Oct)

A:--

F: --

P: --

U.K. GDP YoY (SA) (Oct)

A:--

F: --

P: --

U.K. Industrial Output MoM (Oct)

A:--

F: --

P: --

U.K. Construction Output YoY (Oct)

A:--

F: --

P: --

France HICP Final MoM (Nov)

A:--

F: --

P: --

China, Mainland Outstanding Loans Growth YoY (Nov)

A:--

F: --

P: --

China, Mainland M2 Money Supply YoY (Nov)

A:--

F: --

P: --

China, Mainland M0 Money Supply YoY (Nov)

A:--

F: --

P: --

China, Mainland M1 Money Supply YoY (Nov)

A:--

F: --

P: --

India CPI YoY (Nov)

A:--

F: --

P: --

India Deposit Gowth YoY

A:--

F: --

P: --

Brazil Services Growth YoY (Oct)

A:--

F: --

P: --

Mexico Industrial Output YoY (Oct)

A:--

F: --

P: --

Russia Trade Balance (Oct)

A:--

F: --

P: --

Philadelphia Fed President Henry Paulson delivers a speech
Canada Building Permits MoM (SA) (Oct)

A:--

F: --

P: --

Canada Wholesale Sales YoY (Oct)

A:--

F: --

P: --

Canada Wholesale Inventory MoM (Oct)

A:--

F: --

P: --

Canada Wholesale Inventory YoY (Oct)

A:--

F: --

P: --

Canada Wholesale Sales MoM (SA) (Oct)

A:--

F: --

P: --

Germany Current Account (Not SA) (Oct)

A:--

F: --

P: --

U.S. Weekly Total Rig Count

A:--

F: --

P: --

U.S. Weekly Total Oil Rig Count

A:--

F: --

P: --

Japan Tankan Large Non-Manufacturing Diffusion Index (Q4)

--

F: --

P: --

Japan Tankan Small Manufacturing Outlook Index (Q4)

--

F: --

P: --

Japan Tankan Large Non-Manufacturing Outlook Index (Q4)

--

F: --

P: --

Japan Tankan Large Manufacturing Outlook Index (Q4)

--

F: --

P: --

Japan Tankan Small Manufacturing Diffusion Index (Q4)

--

F: --

P: --

Japan Tankan Large Manufacturing Diffusion Index (Q4)

--

F: --

P: --

Japan Tankan Large-Enterprise Capital Expenditure YoY (Q4)

--

F: --

P: --

U.K. Rightmove House Price Index YoY (Dec)

--

F: --

P: --

China, Mainland Industrial Output YoY (YTD) (Nov)

--

F: --

P: --

China, Mainland Urban Area Unemployment Rate (Nov)

--

F: --

P: --

Saudi Arabia CPI YoY (Nov)

--

F: --

P: --

Euro Zone Industrial Output YoY (Oct)

--

F: --

P: --

Euro Zone Industrial Output MoM (Oct)

--

F: --

P: --

Canada Existing Home Sales MoM (Nov)

--

F: --

P: --

Euro Zone Total Reserve Assets (Nov)

--

F: --

P: --

U.K. Inflation Rate Expectations

--

F: --

P: --

Canada National Economic Confidence Index

--

F: --

P: --

Canada New Housing Starts (Nov)

--

F: --

P: --

U.S. NY Fed Manufacturing Employment Index (Dec)

--

F: --

P: --

U.S. NY Fed Manufacturing Index (Dec)

--

F: --

P: --

Canada Core CPI YoY (Nov)

--

F: --

P: --

Canada Manufacturing Unfilled Orders MoM (Oct)

--

F: --

P: --

Canada Manufacturing New Orders MoM (Oct)

--

F: --

P: --

Canada Core CPI MoM (Nov)

--

F: --

P: --

Canada Manufacturing Inventory MoM (Oct)

--

F: --

P: --

Canada CPI YoY (Nov)

--

F: --

P: --

Canada CPI MoM (Nov)

--

F: --

P: --

Canada CPI YoY (SA) (Nov)

--

F: --

P: --

Canada Core CPI MoM (SA) (Nov)

--

F: --

P: --

Q&A with Experts
    • All
    • Chatrooms
    • Groups
    • Friends
    Connecting
    .
    .
    .
    Type here...
    Add Symbol or Code

      No matching data

      All
      Trump Updates
      Recommend
      Stocks
      Cryptocurrencies
      Central Banks
      Featured News
      • All
      • Russia-Ukraine Conflict
      • Middle East Flashpoint
      • All
      • Russia-Ukraine Conflict
      • Middle East Flashpoint
      Search
      Products

      Charts Free Forever

      Chats Q&A with Experts
      Screeners Economic Calendar Data Tools
      Membership Features
      Data Warehouse Market Trends Institutional Data Policy Rates Macro

      Market Trends

      Market Sentiment Order Book Forex Correlations

      Top Indicators

      Charts Free Forever
      Markets

      News

      News Analysis 24/7 Columns Education
      From Institutions From Analysts
      Topics Columnists

      Latest Views

      Latest Views

      Trending Topics

      Top Columnists

      Latest Update

      Signals

      Copy Rankings Latest Signals Become a signal provider AI Rating
      Contests
      Brokers

      Overview Brokers Assessment Rankings Regulators News Claims
      Broker listing Forex Brokers Comparison Tool Live Spread Comparison Scam
      Q&A Complaint Scam Alert Videos Tips to Detect Scam
      More

      Business
      Events
      Careers About Us Advertising Help Center

      White Label

      Data API

      Web Plug-ins

      Affiliate Program

      Awards Institution Evaluation IB Seminar Salon Event Exhibition
      Vietnam Thailand Singapore Dubai
      Fans Party Investment Sharing Session
      FastBull Summit BrokersView Expo
      Recent Searches
        Top Searches
          Markets
          News
          Analysis
          User
          24/7
          Economic Calendar
          Education
          Data
          • Names
          • Latest
          • Prev

          View All

          No data

          Scan to Download

          Faster Charts, Chat Faster!

          Download App
          English
          • English
          • Español
          • العربية
          • Bahasa Indonesia
          • Bahasa Melayu
          • Tiếng Việt
          • ภาษาไทย
          • Français
          • Italiano
          • Türkçe
          • Русский язык
          • 简中
          • 繁中
          Open Account
          Search
          Products
          Charts Free Forever
          Markets
          News
          Signals

          Copy Rankings Latest Signals Become a signal provider AI Rating
          Contests
          Brokers

          Overview Brokers Assessment Rankings Regulators News Claims
          Broker listing Forex Brokers Comparison Tool Live Spread Comparison Scam
          Q&A Complaint Scam Alert Videos Tips to Detect Scam
          More

          Business
          Events
          Careers About Us Advertising Help Center

          White Label

          Data API

          Web Plug-ins

          Affiliate Program

          Awards Institution Evaluation IB Seminar Salon Event Exhibition
          Vietnam Thailand Singapore Dubai
          Fans Party Investment Sharing Session
          FastBull Summit BrokersView Expo

          Illicit $8B crypto market Xinbi incorporated in Colorado: Elliptic

          Cointelegraph
          1inch / Tether
          +5.20%
          AAVE / Tether
          +3.31%
          Fusionist / Tether
          +0.41%
          Alchemy Pay / Tether
          +5.34%

          A Colorado-incorporated firm has been linked to a Chinese illicit marketplace that has served scammers in Southeast Asia and has been used to channel billions of dollars worth of crypto.

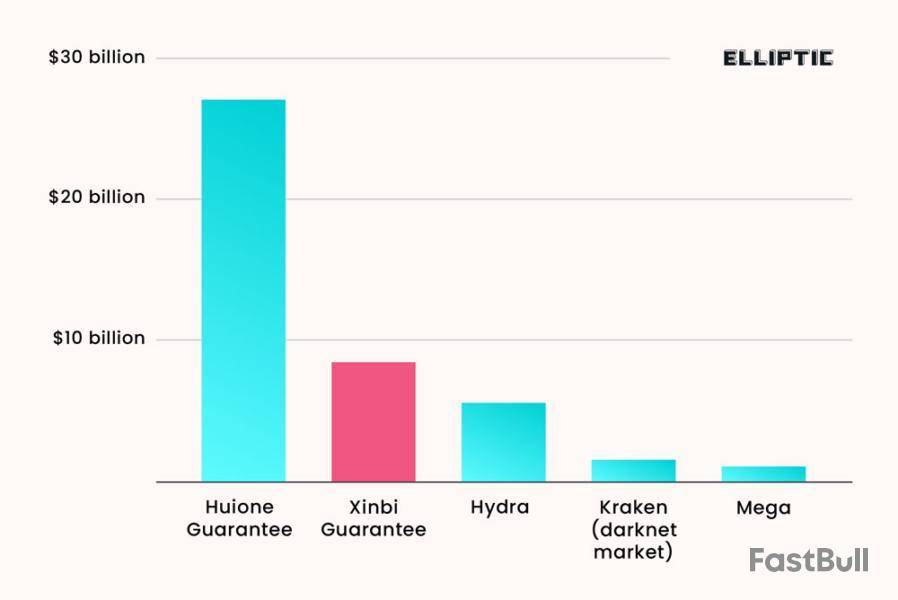
          The marketplace, called Xinbi Guarantee, has received $8.4 billion, primarily in Tether stablecoin transactions to date, blockchain security firm Elliptic reported on May 13.

          Merchants on the Chinese-language, Telegram-based illicit marketplace sell technology, personal data, and money laundering services to Southeast Asian scammers who target victims using pig butchering scams.

          On its website, Xinbi describes itself as an “investment and capital guarantee group company” and claims to operate through Xinbi Co. Ltd, a Colorado-incorporated company incorporated in 2022.

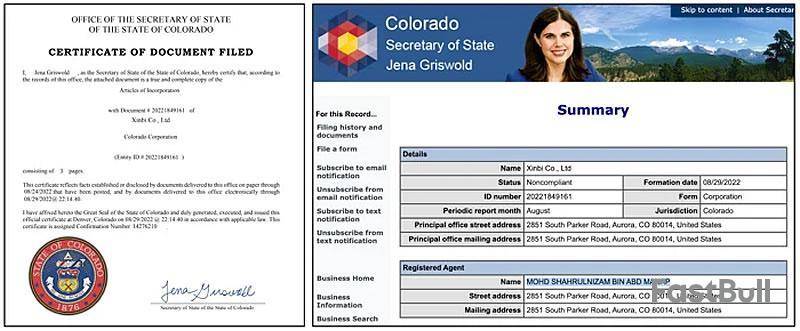
          “In January 2025, the corporation was updated to ‘Delinquent’ for failing to file a periodic report,” Elliptic reported.

          Key services offered on the black marketplace are money laundering services, which are the largest category, as well as technology such as Starlink equipment for scammers, stolen personal data for targeting victims and fake IDs and other fraudulent documents.

          Xinbi is the second-largest illicit online marketplace discovered so far, with transaction volume growing rapidly. Q4 2024 saw over $1 billion transacted, and evidence links the platform to North Korean hackers laundering stolen funds, the Elliptic researchers said.

          Elliptic identified thousands of crypto addresses used by Xinbi Guarantee and the merchants on it, and stated that the $8.4 billion in transactions “should be considered as lower bounds of the true volume of transactions on the platform.”

          The platform, which has 233,000 users, operates on a “guarantee model,” requiring vendor deposits to prevent fraud.

          Second to Huione Guarantee

          In July 2024, Elliptic exposed a similar Telegram-based Chinese marketplace known as Huione Guarantee.

          The firm found that the wider Huione Group of companies had facilitated over $98 billion in crypto transactions.

          In early May, it was designated by the US Treasury as a money-laundering operation and was to be severed from the US banking system.

          These platforms also provide a window into a “China-based underground banking system,” based around stablecoins and other digital payments, “which is being leveraged for money laundering on a significant scale,” Elliptic concluded.

          Risk Warnings and Disclaimers
          You understand and acknowledge that there is a high degree of risk involved in trading. Following any strategies or investment methods may lead to potential losses. The content on the site is provided by our contributors and analysts for information purposes only. You are solely responsible for determining whether any trading assets, securities, strategy, or any other product is suitable for investing based on your own investment objectives and financial situation.
          Add to Favorites
          Share

          DeFi Development Corp adds 172,670 SOL, boosting total holdings over $100 million

          The Block
          1inch / Tether
          +5.20%
          AAVE / Tether
          +3.31%
          Fusionist / Tether
          +0.41%
          Alchemy Pay / Tether
          +5.34%

          DeFi Development Corp., a real estate software firm that has shifted its focus to building a Solana-focused treasury, purchased 172,670 SOL, worth roughly $23.6 million, bringing its total Solana holdings to over $100 million.

          The company announced Tuesday that it made the latest Solana purchase at an average price of $136.81, marking its 10th acquisition. It now holds a total of 595,988 SOL, worth about $102.7 million, including staking rewards.

          The purchase follows its $24 million private placement, which closed Tuesday. The company said it plans to use the proceeds for general corporate purposes, including "continued accumulation of Solana."

          DeFi Development Corp., formerly known as Janover, rebranded and shifted its focus to crypto after a team of former Kraken executives acquired a majority stake in the company in April.

          As part of its Solana push, the company announced last week that it had agreed to acquire an undisclosed Solana validator business for $3.5 million, enabling it to self-stake its SOL holdings.

          The company's stock closed up 2.53% on the Nasdaq on Tuesday and rose 5.67% in after-hours trading, according to Yahoo Finance. It changed its ticker to "DFDV" from "JNVR" earlier this month.

          Solana's price rose 6.7% to $180.3 at press time, according to The Block's SOL price page. It has a market capitalization of $93.6 billion, making it the sixth-largest cryptocurrency.

          Disclaimer: The Block is an independent media outlet that delivers news, research, and data. As of November 2023, Foresight Ventures is a majority investor of The Block. Foresight Ventures invests in other companies in the crypto space. Crypto exchange Bitget is an anchor LP for Foresight Ventures. The Block continues to operate independently to deliver objective, impactful, and timely information about the crypto industry. Here are our current financial disclosures.

          © 2025 The Block. All Rights Reserved. This article is provided for informational purposes only. It is not offered or intended to be used as legal, tax, investment, financial, or other advice.

          Risk Warnings and Disclaimers
          You understand and acknowledge that there is a high degree of risk involved in trading. Following any strategies or investment methods may lead to potential losses. The content on the site is provided by our contributors and analysts for information purposes only. You are solely responsible for determining whether any trading assets, securities, strategy, or any other product is suitable for investing based on your own investment objectives and financial situation.
          Add to Favorites
          Share

          Bitcoin Breaks $100K Again as Macroeconomic Conditions Turn Favorable: Bitfinex Alpha

          CryptoPotato
          1inch / Tether
          +5.20%
          AAVE / Tether
          +3.31%
          Fusionist / Tether
          +0.41%
          Alchemy Pay / Tether
          +5.34%

          For the first time in more than three months, bitcoin (BTC) has reclaimed $100,000, rallying to a level just 3.6% shy of its all-time high (ATH). This surge comes as tariff tensions between China and the United States ease off, and macroeconomic conditions become positive again.

          According to a report from the crypto exchange Bitfinex, favorable macroeconomic conditions and significant institutional demand can keep BTC on a positive trajectory in the meantime. Analysts said that with macro catalysts returning to the forefront, BTC will continue to display relative strength compared with equities and other risk assets.Bitcoin Reclaims $100K

          One development driving the confidence that has returned to the market is the Federal Reserve’s positive comments on the rate trajectory around the U.S. tariff situation. The comments’ positivity has created a backdrop that has strengthened bitcoin’s recovery and set the stage for a renewed push to new ATHs.

          Per Bitfinex analysts, China has paused retaliatory tariffs against the U.S., following “backchannel progress” between both countries. The market now faces reduced geopolitical tail risk and ongoing fiscal support, and with rate cuts still on the table, risk assets, led by BTC, could perform well.

          Bitcoin’s resurgence has triggered a fresh wave of capital inflows,revivingmarket liquidity and participation. Some investors are re-entering the market, while others are de-risking and taking profits. Bitfinex said the renewed capital inflow is evident in the realized cap. This metric measures the aggregate cost basis of all coins in circulation and tells how much capital enters the market over time.

          Bitcoin’s realized cap has hit an ATH of $889 billion, rising by 2.1% in the past 30 days. This indicates a sharp uptick in net inflows, reinforcing analysts’ belief that bitcoin’s recent gains are driven by fresh liquidity and not speculative rotation. While BTC hovered below the $75,000 range, more than 5 million coins were at an unrealized loss; however, the price recovery has reduced that number to 0.7 million.Institutional Demand Becomes Steady

          In addition to bitcoin’s realized cap hitting a new ATH, U.S. spot Bitcoin exchange-traded funds (ETFs) have recorded massive inflows in the last two weeks.

          Inflow patterns observed by analysts suggest that ETF flows arebecomingde-correlated from short-term pullbacks. The demand signals steady allocation from market participants, not opportunistic buying, driven by portfolio mandates, not retail speculation.

          Risk Warnings and Disclaimers
          You understand and acknowledge that there is a high degree of risk involved in trading. Following any strategies or investment methods may lead to potential losses. The content on the site is provided by our contributors and analysts for information purposes only. You are solely responsible for determining whether any trading assets, securities, strategy, or any other product is suitable for investing based on your own investment objectives and financial situation.
          Add to Favorites
          Share

          Ethereum Price Pops Above $2,700 — Rally Gains Traction Once More

          NewsBTC
          1inch / Tether
          +5.20%
          AAVE / Tether
          +3.31%
          Fusionist / Tether
          +0.41%
          Alchemy Pay / Tether
          +5.34%

          Ethereum price extended its increase above the $2,700 zone. ETH is now correcting gains and might revisit the $2,575 support zone.

          • Ethereum started a fresh increase and cleared the $2,700 resistance.
          • The price is trading above $2,620 and the 100-hourly Simple Moving Average.
          • There was a break above a connecting bearish trend line with resistance at $2,450 on the hourly chart of ETH/USD (data feed via Kraken).
          • The pair could find bids near $2,575 and start a fresh increase in the near term.

          Ethereum Price Restarts Rally

          Ethereum price remained supported and started a fresh increase above $2,550, beating Bitcoin. ETH gained pace for a move above the $2,620 resistance zone.

          There was a break above a connecting bearish trend line with resistance at $2,450 on the hourly chart of ETH/USD. The bulls were able to push the price above the $2,700 resistance zone. A high was formed at $2,736 and the price is now correcting gains.

          There was a minor decline below the 23.6% Fib retracement level of the upward move from the $2,416 swing low to the $2,736 high. However, the bulls are still active above $2,620.

          Ethereum price is now trading above $2,640 and the 100-hourly Simple Moving Average. On the upside, the price seems to be facing hurdles near the $2,720 level. The next key resistance is near the $2,735 level. The first major resistance is near the $2,750 level.

          A clear move above the $2,750 resistance might send the price toward the $2,840 resistance. An upside break above the $2,840 resistance might call for more gains in the coming sessions. In the stated case, Ether could rise toward the $2,880 resistance zone or even $2,950 in the near term.

          Another Pullback In ETH?

          If Ethereum fails to clear the $2,720 resistance, it could start a fresh downside correction. Initial support on the downside is near the $2,600 level. The first major support sits near the $2,575 zone and the 50% Fib retracement level of the upward move from the $2,416 swing low to the $2,736 high.

          A clear move below the $2,575 support might push the price toward the $2,500 support. Any more losses might send the price toward the $2,420 support level in the near term. The next key support sits at $2,350.

          Technical Indicators

          Hourly MACD – The MACD for ETH/USD is losing momentum in the bullish zone.

          Hourly RSI – The RSI for ETH/USD is now above the 50 zone.

          Major Support Level – $2,720

          Major Resistance Level – $2,575

          Risk Warnings and Disclaimers
          You understand and acknowledge that there is a high degree of risk involved in trading. Following any strategies or investment methods may lead to potential losses. The content on the site is provided by our contributors and analysts for information purposes only. You are solely responsible for determining whether any trading assets, securities, strategy, or any other product is suitable for investing based on your own investment objectives and financial situation.
          Add to Favorites
          Share

          Bitcoin Price In Pause Mode While ETH Powers Higher — What’s Next?

          NewsBTC
          1inch / Tether
          +5.20%
          AAVE / Tether
          +3.31%
          Fusionist / Tether
          +0.41%
          Alchemy Pay / Tether
          +5.34%

          Bitcoin price started a fresh increase and tested the $105,000 zone. BTC is now consolidating gains while Ethereum rallied toward the $2,750 resistance.

          • Bitcoin started a strong increase and settled above the $102,500 resistance zone.
          • The price is trading above $103,000 and the 100 hourly Simple moving average.
          • There is a new connecting bullish trend line with support at $103,650 on the hourly chart of the BTC/USD pair (data feed from Kraken).
          • The pair could start another increase if it clears the $105,000 zone.

          Bitcoin Price Consolidates Gains

          Bitcoin price started a fresh increase from the $100,500 support zone. BTC formed a base and was able to clear the $102,000 resistance zone. The bulls even pushed the price above $103,200.

          The pair spiked toward $105,000. A high was formed at $104,980 and the price is now correcting gains. There was a move below the 23.6% Fib retracement level of the upward move from the $100,772 swing low to the $104,980 high.

          Bitcoin is now trading above $103,500 and the 100 hourly Simple moving average. There is also a new connecting bullish trend line with support at $103,650 on the hourly chart of the BTC/USD pair.

          On the upside, immediate resistance is near the $104,500 level. The first key resistance is near the $105,000 level. The next key resistance could be $105,500. A close above the $105,500 resistance might send the price further higher. In the stated case, the price could rise and test the $106,800 resistance level. Any more gains might send the price toward the $108,000 level.

          More Losses In BTC?

          If Bitcoin fails to rise above the $105,000 resistance zone, it could start another downside correction. Immediate support on the downside is near the $103,500 level. The first major support is near the $102,850 level and the 50% Fib retracement level of the upward move from the $100,772 swing low to the $104,980 high.

          The next support is now near the $101,750 zone. Any more losses might send the price toward the $100,200 support in the near term. The main support sits at $98,800.

          Technical indicators:

          Hourly MACD – The MACD is now losing pace in the bullish zone.

          Hourly RSI (Relative Strength Index) – The RSI for BTC/USD is now above the 50 level.

          Major Support Levels – $103,500, followed by $102,850.

          Major Resistance Levels – $105,000 and $105,500.

          Risk Warnings and Disclaimers
          You understand and acknowledge that there is a high degree of risk involved in trading. Following any strategies or investment methods may lead to potential losses. The content on the site is provided by our contributors and analysts for information purposes only. You are solely responsible for determining whether any trading assets, securities, strategy, or any other product is suitable for investing based on your own investment objectives and financial situation.
          Add to Favorites
          Share

          Buyers Take Control: Indicator That Predicted Previous Bitcoin Rallies Fires Again

          NewsBTC
          1inch / Tether
          +5.20%
          AAVE / Tether
          +3.31%
          Fusionist / Tether
          +0.41%
          Alchemy Pay / Tether
          +5.34%

          Bitcoin has been able to climb above the $104,000 level, following a notable double-digit increase over the past week. At the time of writing, BTC trades at $104,271, narrowing the gap to its all-time high of $109,000.

          This recent price surge is not occurring in isolation. Instead, it appears closely tied to broader macroeconomic developments, most notably, the recent easing of trade tensions between the US and China, with both countries reducing tariffs on certain imports and exports.

          Market participants have responded positively to these policy shifts, signaling renewed risk appetite across traditional and digital asset markets.

          Bitcoin’s rally over the weekend reflects this optimism, with analysts identifying key technical indicators pointing toward rising buyer strength. One such indicator, the Taker Buy Sell Ratio, is gaining attention for marking previous turning points in Bitcoin’s price history.

          Bitcoin Taker Buy-Sell Ratio Signals Renewed Bullish Control

          CryptoQuant contributor G a a h highlighted that the Taker Buy Sell Ratio, a metric measuring the ratio of market buy orders to sell orders, has climbed to a significant threshold of 1.02. Historically, similar levels have coincided with crucial inflection points in Bitcoin’s price movement.

          Bitcoin Taker Buy Sell Ratio

          For instance, this metric reached comparable highs during the late 2022 lows between $15,000 and $20,000, and again in October 2023 as Bitcoin broke through the $30,000 resistance level.

          According to G a a h, this recent breakout above the 1.00 line reflects an increase in aggressive buying activity, with market takers once again asserting short-term control. This suggests upward momentum may persist in the near term.

          However, the analyst also cautioned that these same conditions have previously been followed by volatility spikes, marking both the start and reversal of market trends. The analyst wrote:

          It’s worth noting that in previous periods, this same level has coincided with reversal zones or strong volatility, marking both the start and end of trends. We are therefore facing a scenario where buyer appetite could continue to drive BTC towards new highs.

          Realized Price Trends Confirm Ongoing Market Strength

          In a separate analysis, CryptoQuant analyst Crypto Dan examined Bitcoin’s realized price, a metric that reflects the average purchase price of all circulating BTC, as a tool to gauge market sentiment and directional strength.

          Bitcoin’s realized price.

          According to the report, the realized price is still on the rise, indicating that investors are increasingly accumulating BTC at higher prices. This trend differs significantly from previous cycles, where a reversal in the realized price preceded steep corrections.

          Crypto Dan attributes the current rise to institutional inflows, particularly through spot Bitcoin ETFs and corporate balance sheet purchases. These channels have brought in sustained capital, elevating the average acquisition price and reinforcing market structure.

          As institutional players continue to allocate capital into Bitcoin, the realized price trend suggests that the ongoing rally may have more room to extend. With macroeconomic support from tariff reductions and on-chain indicators flashing green, the broader setup remains constructive for Bitcoin’s continued strength in the near term.

          Featured image created with DALL-E, Chart from TradingView

          Risk Warnings and Disclaimers
          You understand and acknowledge that there is a high degree of risk involved in trading. Following any strategies or investment methods may lead to potential losses. The content on the site is provided by our contributors and analysts for information purposes only. You are solely responsible for determining whether any trading assets, securities, strategy, or any other product is suitable for investing based on your own investment objectives and financial situation.
          Add to Favorites
          Share

          Etoro prices Nasdaq debut at $52, surpassing expectations

          The Block
          1inch / Tether
          +5.20%
          AAVE / Tether
          +3.31%
          Fusionist / Tether
          +0.41%
          Alchemy Pay / Tether
          +5.34%

          Crypto and equities trading platform eToro announced today that its Nasdaq initial public offering saw "upsized" pricing of shares at $52 per share, reflecting stronger-than-expected demand.

          The company's IPO involves around 11.9 million Class A common shares, half of which is to be sold by eToro while the other half will be offered by existing shareholders, according to a Tuesday release.

          The trading platform previously expected the IPO price to fall between $46 and $50 per share, which is an earlier valuation that the market has now surpassed. The IPO is anticipated to raise approximately $310 million in capital for the company. With the IPO, eToro has a valuation of $4.2 billion, Fortune reported.

          The shares are scheduled to start trading on the Nasdaq Global Select Market on Wednesday, while the offering is expected to close the following day. The company's stock will trade under the ticker "ETOR."

          According to a CNBC report, eToro initially applied for its IPO in March, but temporarily halted its plans as President Donald Trump's tariff announcements caused market uncertainties. This also affected other companies, such as Klarna and StubHub.

          Following its successful IPO, eToro joins a small group of crypto-affiliated companies in the U.S. that have gone public, including crypto exchange Coinbase and several bitcoin mining companies.

          Other crypto companies, such as stablecoin issuer Circle and Hong Kong's Animoca Brands, are also preparing to go public this year.

          Disclaimer: The Block is an independent media outlet that delivers news, research, and data. As of November 2023, Foresight Ventures is a majority investor of The Block. Foresight Ventures invests in other companies in the crypto space. Crypto exchange Bitget is an anchor LP for Foresight Ventures. The Block continues to operate independently to deliver objective, impactful, and timely information about the crypto industry. Here are our current financial disclosures.

          © 2025 The Block. All Rights Reserved. This article is provided for informational purposes only. It is not offered or intended to be used as legal, tax, investment, financial, or other advice.

          Risk Warnings and Disclaimers
          You understand and acknowledge that there is a high degree of risk involved in trading. Following any strategies or investment methods may lead to potential losses. The content on the site is provided by our contributors and analysts for information purposes only. You are solely responsible for determining whether any trading assets, securities, strategy, or any other product is suitable for investing based on your own investment objectives and financial situation.
          Add to Favorites
          Share
          FastBull
          Copyright © 2025 FastBull Ltd

          728 RM B 7/F GEE LOK IND BLDG NO 34 HUNG TO RD KWUN TONG KLN HONG KONG

          TelegramInstagramTwitterfacebooklinkedin
          App Store Google Play Google Play
          Products
          Charts

          Chats

          Q&A with Experts
          Screeners
          Economic Calendar
          Data
          Tools
          Membership
          Features
          Function
          Markets
          Copy Trading
          Latest Signals
          Contests
          News
          Analysis
          24/7
          Columns
          Education
          Company
          Careers
          About Us
          Contact Us
          Advertising
          Help Center
          Feedback
          User Agreement
          Privacy Policy
          Business

          White Label

          Data API

          Web Plug-ins

          Poster Maker

          Affiliate Program

          Risk Disclosure

          The risk of loss in trading financial instruments such as stocks, FX, commodities, futures, bonds, ETFs and crypto can be substantial. You may sustain a total loss of the funds that you deposit with your broker. Therefore, you should carefully consider whether such trading is suitable for you in light of your circumstances and financial resources.

          No decision to invest should be made without thoroughly conducting due diligence by yourself or consulting with your financial advisors. Our web content might not suit you since we don't know your financial conditions and investment needs. Our financial information might have latency or contain inaccuracy, so you should be fully responsible for any of your trading and investment decisions. The company will not be responsible for your capital loss.

          Without getting permission from the website, you are not allowed to copy the website's graphics, texts, or trademarks. Intellectual property rights in the content or data incorporated into this website belong to its providers and exchange merchants.

          Not Logged In

          Log in to access more features

          FastBull Membership

          Not yet

          Purchase

          Become a signal provider
          Help Center
          Customer Service
          Dark Mode
          Price Up/Down Colors

          Log In

          Sign Up

          Position
          Layout
          Fullscreen
          Default to Chart
          The chart page opens by default when you visit fastbull.com