• Trade
  • Markets
  • Copy
  • Contests
  • News
  • 24/7
  • Calendar
  • Q&A
  • Chats
Screeners
SYMBOL
LAST
ASK
BID
HIGH
LOW
NET CHG.
%CHG.
SPREAD
SPX
S&P 500 Index
6969.02
6969.02
6969.02
6992.83
6870.81
-9.01
-0.13%
--
DJI
Dow Jones Industrial Average
49071.55
49071.55
49071.55
49292.81
48597.22
+55.96
+ 0.11%
--
IXIC
NASDAQ Composite Index
23685.11
23685.11
23685.11
23840.55
23232.78
-172.33
-0.72%
--
USDX
US Dollar Index
96.410
96.490
96.410
96.560
96.240
+0.440
+ 0.46%
--
EURUSD
Euro / US Dollar
1.19189
1.19197
1.19189
1.19743
1.18947
-0.00513
-0.43%
--
GBPUSD
Pound Sterling / US Dollar
1.37494
1.37503
1.37494
1.38142
1.37313
-0.00599
-0.43%
--
XAUUSD
Gold / US Dollar
5214.63
5214.97
5214.63
5450.83
5112.26
-161.68
-3.01%
--
WTI
Light Sweet Crude Oil
64.458
64.488
64.458
65.611
63.409
-0.794
-1.22%
--

Community Accounts

Signal Accounts
--
Profit Accounts
--
Loss Accounts
--
View More

Become a signal provider

Sell trading signals to earn additional income

View More

Guide to Copy Trading

Get started with ease and confidence

View More

Signal Accounts for Members

All Signal Accounts

Best Return
  • Best Return
  • Best P/L
  • Best MDD
Past 1W
  • Past 1W
  • Past 1M
  • Past 1Y

All Contests

  • All
  • Trump Updates
  • Recommend
  • Stocks
  • Cryptocurrencies
  • Central Banks
  • Featured News
Top News Only
Share

Tokyo Gas Executive: We Are Concerned About Rising Long-Term Interest Rates

Share

[Chinese Ambassador To The US: People-to-People Exchanges Help China And The US Build A New Way Of Coexisting In The New Era] On The 28th Local Time, Chinese Ambassador To The US Xie Feng Said At An Event In Philadelphia That People-to-people Exchanges Should Serve As A Bridge, A Medium, And A Mirror To Help China And The US Build A New Way Of Coexisting In The New Era. Xie Feng Attended The 2026 "Happy Chinese New Year" Concert And "Hello! China" Tourism Promotion Event Jointly Organized By The China National Tourist Office In New York And The Philadelphia Orchestra. In His Speech, He Said That China And The US Are Currently Exploring A New Way Of Coexisting In The New Era, A Long And Arduous Task That Requires Both Sides To Continuously Strengthen The Bonds Of People-to-people Exchanges And Inject A Continuous Stream Of Positive Energy Into China-US Relations

Share

Dollar/Yen Extends Gain, Last Up 154.04

Share

Australia's S&P/ASX 200 Index Closes Down 0.7% At 8869.10 Points

Share

Colombia's Central Bank Expected To Raise Interest Rate For First Time Since 2023

Share

White House Official - President Trump Not Indicating USA Would Decertify Canadian Built Airplanes In Operation

Share

Finance Minister: Japan Carefully Considering Implications Of Consumption Tax Suspension

Share

METI - Japan's Dec Oil Imports Rise 17.7% Year-On-Year

Share

The White House Announced That President Trump Will Attend A Policy Meeting At 2 P.m. ET On Friday (3 A.m. Beijing Time The Following Day) And Sign An Executive Order At 11 A.m. ET On Friday (midnight Saturday Beijing Time)

Share

According To The Japan Exchange Website, From 10:21:49 To 10:31:59 Beijing Time On January 30, 2026, The Osaka Exchange Activated Its Circuit Breaker Mechanism For Platinum Futures, Temporarily Suspending Trading. This Was Due To A Sharp Drop In Global Platinum Prices, With The Decline Reaching The 10% Limit Set By The Previous Day. The Circuit Breaker Mechanism Is A Measure Taken By Exchanges To Cope With Severe Market Volatility, Aiming To Temporarily Restrict Or Suspend Trading To Encourage Investors To Remain Calm. This Was The First Time The Circuit Breaker Mechanism For Platinum Futures Had Been Activated Since December 30, 2025, Starting At 10:21 AM Beijing Time And Lasting For 10 Minutes

Share

Hsi Down 498 Pts, Hsti Down 105 Pts, Cspc Pharma Down Over 12%, Shk Ppt, Huabao Intl Hit New Highs

Share

Citi Expects Cn 2026 Econ Growth Target To Be Set At 4.5-5%, Below Forecast

Share

India's NIFTY IT Index Down 1.5%

Share

India's Nifty Bank Futures Down 0.26% In Pre-Open Trade

Share

India's Nifty 50 Index Down 0.67% In Pre-Open Trade

Share

India 10-Year Benchmark Government Bond Yield At 6.7042%, Previous Close 6.6984%

Share

Indian Rupee Opens At 91.9125 Per USA Dollar, Little Changed From 91.9550 Previous Close

Share

《Hibor》1-Month Hibor Down To 2.61%, Sinking For 6 Days Logging 1-Month Low

Share

Citi Predicts Cn Allocation To Push Copper To Usd15-16K/ Ton In Coming Weeks, But Rather Unlikely To Sustain

Share

Spot Platinum Extends Declines, Last Down Over 5% At $2453.60/Oz

TIME
ACT
FCST
PREV
U.S. Exports (Nov)

A:--

F: --

P: --

U.S. Factory Orders MoM (Excl. Defense) (Nov)

A:--

F: --

P: --

U.S. Factory Orders MoM (Nov)

A:--

F: --

P: --
U.S. Wholesale Sales MoM (SA) (Nov)

A:--

F: --

P: --

U.S. Factory Orders MoM (Excl. Transport) (Nov)

A:--

F: --

P: --
U.S. Non-Defense Capital Durable Goods Orders Revised MoM (Excl. Aircraft) (SA) (Nov)

A:--

F: --

P: --
U.S. EIA Weekly Natural Gas Stocks Change

A:--

F: --

P: --

Brazil CAGED Net Payroll Jobs (Dec)

A:--

F: --

P: --

U.S. Weekly Treasuries Held by Foreign Central Banks

A:--

F: --

P: --

South Korea Industrial Output MoM (SA) (Dec)

A:--

F: --

P: --

South Korea Services Output MoM (Dec)

A:--

F: --

P: --

South Korea Retail Sales MoM (Dec)

A:--

F: --

P: --

Japan Tokyo CPI YoY (Excl. Food & Energy) (Jan)

A:--

F: --

P: --

Japan Tokyo CPI MoM (Excl. Food & Energy) (Jan)

A:--

F: --

P: --

Japan Unemployment Rate (Dec)

A:--

F: --

P: --

Japan Tokyo CPI YoY (Jan)

A:--

F: --

P: --

Japan Jobs to Applicants Ratio (Dec)

A:--

F: --

P: --

Japan Tokyo CPI MoM (Jan)

A:--

F: --

P: --

Japan Tokyo Core CPI YoY (Jan)

A:--

F: --

P: --

Japan Retail Sales YoY (Dec)

A:--

F: --

P: --
Japan Industrial Inventory MoM (Dec)

A:--

F: --

P: --

Japan Retail Sales (Dec)

A:--

F: --

P: --

Japan Retail Sales MoM (SA) (Dec)

A:--

F: --

P: --
Japan Large-Scale Retail Sales YoY (Dec)

A:--

F: --

P: --

Japan Industrial Output Prelim MoM (Dec)

A:--

F: --

P: --

Japan Industrial Output Prelim YoY (Dec)

A:--

F: --

P: --

Australia PPI YoY (Q4)

A:--

F: --

P: --

Australia PPI QoQ (Q4)

A:--

F: --

P: --

Japan Construction Orders YoY (Dec)

A:--

F: --

P: --

Japan New Housing Starts YoY (Dec)

A:--

F: --

P: --

France GDP Prelim YoY (SA) (Q4)

--

F: --

P: --

Turkey Trade Balance (Dec)

--

F: --

P: --

France PPI MoM (Dec)

--

F: --

P: --

Germany Unemployment Rate (SA) (Jan)

--

F: --

P: --

Germany GDP Prelim YoY (Not SA) (Q4)

--

F: --

P: --

Germany GDP Prelim QoQ (SA) (Q4)

--

F: --

P: --

Germany GDP Prelim YoY (Working-day Adjusted) (Q4)

--

F: --

P: --

Italy GDP Prelim YoY (SA) (Q4)

--

F: --

P: --

U.K. M4 Money Supply (SA) (Dec)

--

F: --

P: --

U.K. M4 Money Supply YoY (Dec)

--

F: --

P: --

U.K. M4 Money Supply MoM (Dec)

--

F: --

P: --

U.K. Mortgage Lending (Dec)

--

F: --

P: --

U.K. Mortgage Approvals (Dec)

--

F: --

P: --

Italy Unemployment Rate (SA) (Dec)

--

F: --

P: --

Euro Zone Unemployment Rate (Dec)

--

F: --

P: --

Euro Zone GDP Prelim QoQ (SA) (Q4)

--

F: --

P: --

Euro Zone GDP Prelim YoY (SA) (Q4)

--

F: --

P: --

Italy PPI YoY (Dec)

--

F: --

P: --

India Deposit Gowth YoY

--

F: --

P: --

Mexico GDP Prelim YoY (Q4)

--

F: --

P: --

Brazil Unemployment Rate (Dec)

--

F: --

P: --

South Africa Trade Balance (Dec)

--

F: --

P: --

Germany CPI Prelim YoY (Jan)

--

F: --

P: --

Germany CPI Prelim MoM (Jan)

--

F: --

P: --

Germany HICP Prelim YoY (Jan)

--

F: --

P: --

Germany HICP Prelim MoM (Jan)

--

F: --

P: --

U.S. PPI YoY (Dec)

--

F: --

P: --

U.S. PPI MoM (SA) (Dec)

--

F: --

P: --

Canada GDP MoM (SA) (Nov)

--

F: --

P: --

Canada GDP YoY (Nov)

--

F: --

P: --

Q&A with Experts
    • All
    • Chatrooms
    • Groups
    • Friends
    john flag
    srinivas
    @srinivasthanks bro for the snippet I can now dive dip into it
    EuroTrader flag
    srinivas
    @srinivas if you observe those two lows currently price left they smooth causing a sigh of relief
    EuroTrader flag
    srinivas flag
    NEWBIE
    @NEWBIEno it's a raw calculation of volume
    EuroTrader flag
    srinivas
    @srinivasalot of traders are in right now trusting that price has turned from those lows since it reacted there before
    ling sun flag
    Let me ask you a different question: Will a weaker dollar have a positive impact on US debt? Will Mr. Trump be happy? Will the US benefit?
    money888 flag
    Is there no chance for it to rise to 5450 today?
    john flag
    ling sun
    @ling sunso the dollar fell mostly due to shifting rate expectations, softer US growth outlook, and capital moving into risk assets and not just because the US has a lot of debt. Debt is a long-term pressure, but interest rates and global money flow drive short-term USD moves
    EuroTrader flag
    srinivas
    @srinivas now thats where smart money traders come in and take avantage off those liquidity
    srinivas flag
    EuroTrader
    @EuroTraderwhat i believe and what market does are different. i don't want to believe anything. i try to be neutral and stay away from my inherent bias.
    john flag
    money888
    Is there no chance for it to rise to 5450 today?
    @money888anything can happen but let the market call the shots
    NEWBIE flag
    EuroTrader
    @EuroTrader My thoughts exactly, if you are using VWAP, wouldn't the others as well? Just another tool to manipulate you
    money888 flag
    EuroTrader
    I bought in at 5189. Can I hold onto it?
    EuroTrader flag
    srinivas
    @srinivasthats fine but if you look at the market form an algo perspective you will see what am talking about
    ling sun flag
    john
    I understand now.
    john flag
    ling sun
    Let me ask you a different question: Will a weaker dollar have a positive impact on US debt? Will Mr. Trump be happy? Will the US benefit?
    @ling sunYes… but indirectly.The US debt is mostly in USD, so a weaker dollar does not reduce the nominal debt.
    EuroTrader flag
    srinivas
    @srinivasi personally am more off a reactive trader i do not trade based on absolute predictions
    EuroTrader flag
    srinivas
    @srinivasso what do you believe if i may ask
    EuroTrader flag
    money888
    @money888 where is your sl and TP in the market if i may ask
    srinivas flag
    EuroTrader
    @EuroTraderi don't have an opinion when it comes to trading. as my opinion is my bias. it's subjective. so i block that thought
    Type here...
    Add Symbol or Code

      No matching data

      All
      Trump Updates
      Recommend
      Stocks
      Cryptocurrencies
      Central Banks
      Featured News
      • All
      • Russia-Ukraine Conflict
      • Middle East Flashpoint
      • All
      • Russia-Ukraine Conflict
      • Middle East Flashpoint
      Search
      Products

      Charts Free Forever

      Chats Q&A with Experts
      Screeners Economic Calendar Data Tools
      Membership Features
      Data Warehouse Market Trends Institutional Data Policy Rates Macro

      Market Trends

      Market Sentiment Order Book Forex Correlations

      Top Indicators

      Charts Free Forever
      Markets

      News

      News Analysis 24/7 Columns Education
      From Institutions From Analysts
      Topics Columnists

      Latest Views

      Latest Views

      Trending Topics

      Top Columnists

      Latest Update

      Signals

      Copy Rankings Latest Signals Become a signal provider AI Rating
      Contests
      Brokers

      Overview Brokers Assessment Rankings Regulators News Claims
      Broker listing Forex Brokers Comparison Tool Live Spread Comparison Scam
      Q&A Complaint Scam Alert Videos Tips to Detect Scam
      More

      Business
      Events
      Careers About Us Advertising Help Center

      White Label

      Data API

      Web Plug-ins

      Affiliate Program

      Awards Institution Evaluation IB Seminar Salon Event Exhibition
      Vietnam Thailand Singapore Dubai
      Fans Party Investment Sharing Session
      FastBull Summit BrokersView Expo
      Recent Searches
        Top Searches
          Markets
          News
          Analysis
          User
          24/7
          Economic Calendar
          Education
          Data
          • Names
          • Latest
          • Prev

          View All

          No data

          Scan to Download

          Faster Charts, Chat Faster!

          Download App
          English
          • English
          • Español
          • العربية
          • Bahasa Indonesia
          • Bahasa Melayu
          • Tiếng Việt
          • ภาษาไทย
          • Français
          • Italiano
          • Türkçe
          • Русский язык
          • 简中
          • 繁中
          Open Account
          Search
          Products
          Charts Free Forever
          Markets
          News
          Signals

          Copy Rankings Latest Signals Become a signal provider AI Rating
          Contests
          Brokers

          Overview Brokers Assessment Rankings Regulators News Claims
          Broker listing Forex Brokers Comparison Tool Live Spread Comparison Scam
          Q&A Complaint Scam Alert Videos Tips to Detect Scam
          More

          Business
          Events
          Careers About Us Advertising Help Center

          White Label

          Data API

          Web Plug-ins

          Affiliate Program

          Awards Institution Evaluation IB Seminar Salon Event Exhibition
          Vietnam Thailand Singapore Dubai
          Fans Party Investment Sharing Session
          FastBull Summit BrokersView Expo

          Gold Could Face Price Pressure, but Long-Term Outlook Positive — Market Talk

          Dow Jones Newswires
          Micro 10-Year Yield Futures JAN6
          +0.47%
          Micro 10-Year Yield Futures FEB6
          +0.78%
          Micro 2-Year Yield Futures JAN6
          +2.05%
          Micro 5-Year Yield Futures JAN6
          0.00%
          Micro 5-Year Yield Futures FEB6
          0.00%

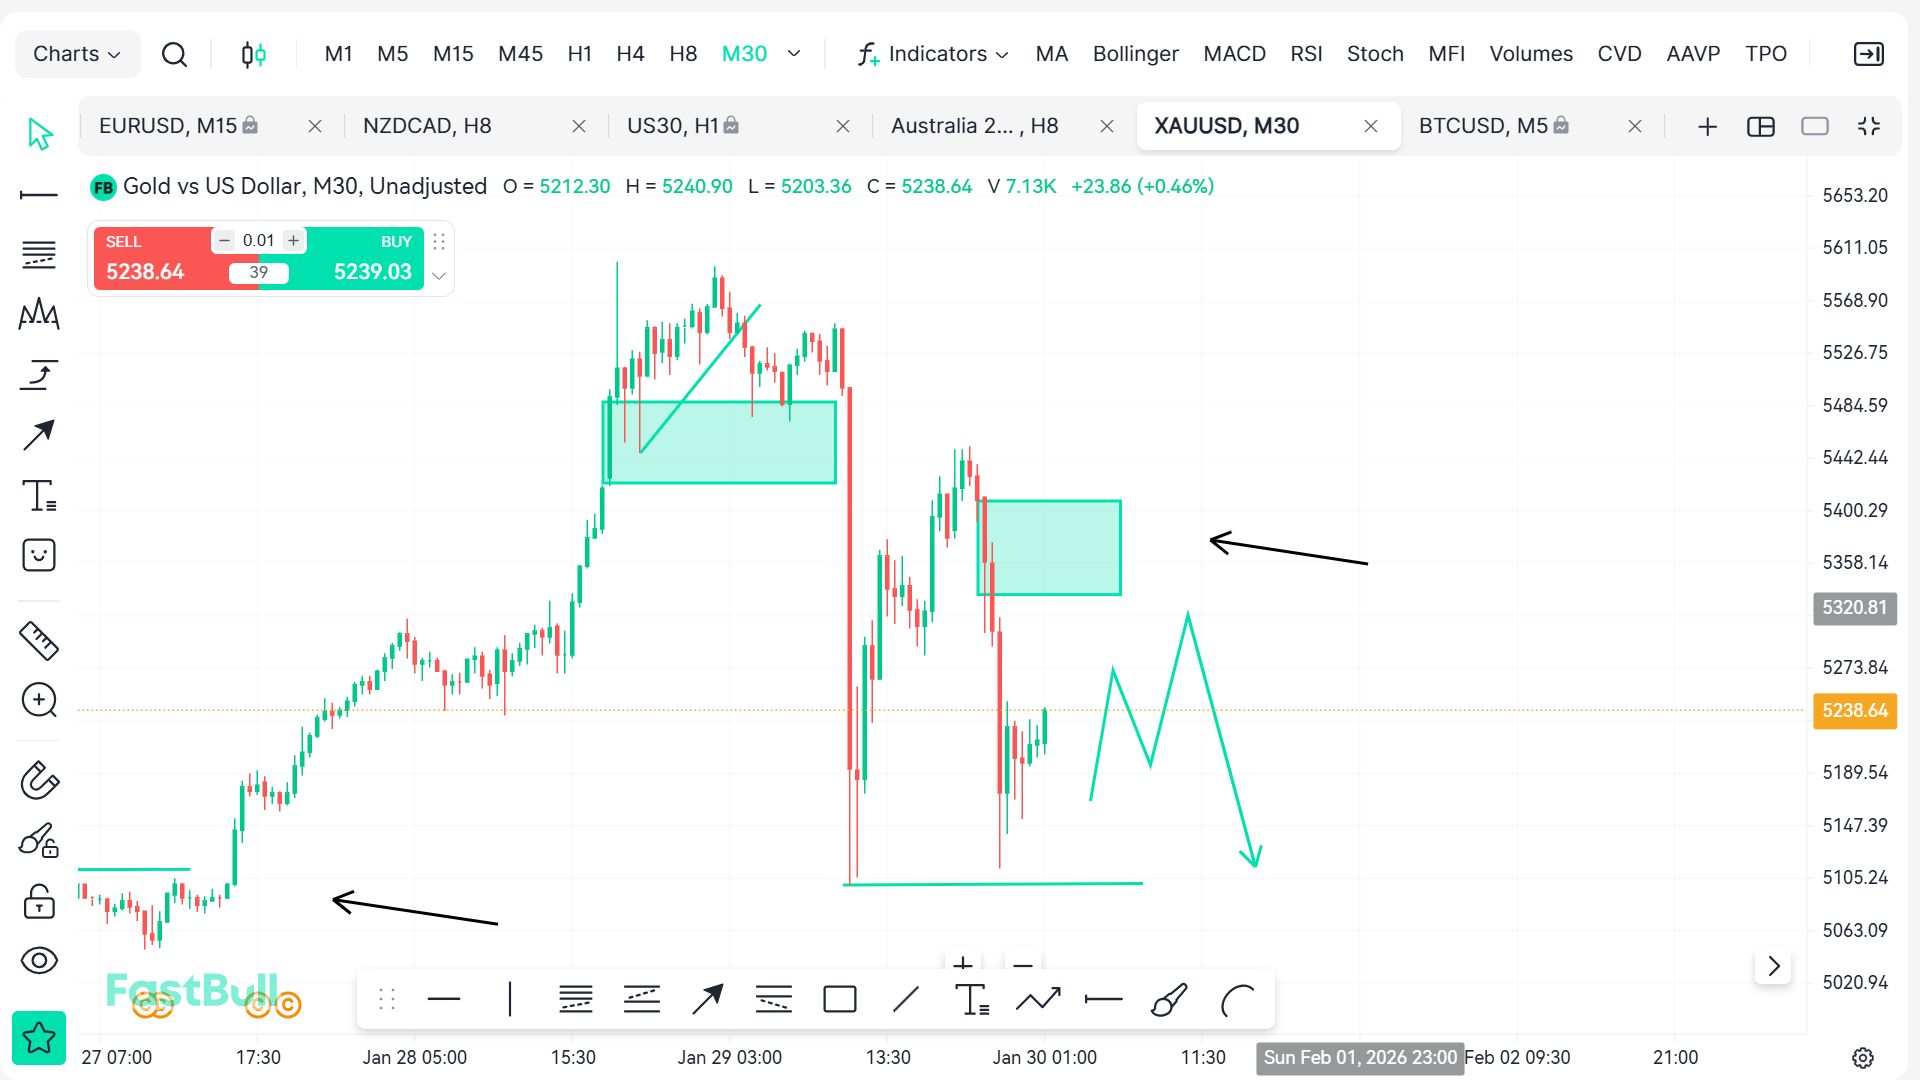
          Gold prices may come under pressure in the short term, but their long-term outlook remains positive, UBS Global Research's Joni Teves says in a note. Concerns about the Fed's independence, rising geopolitical tensions and broader political uncertainty are supporting prices of the precious metal, she says. While gold's medium- to long-term risk remains to the upside, the precious-metals specialist prefers to stay on the sidelines for now. "Short-term price action is starting to get excessive, in our view, and the risk of an interim correction is rising," she says. Spot gold is down 3.9% at $5,161.91/oz. (tracy.qu@wsj.com)

          Risk Warnings and Disclaimers
          You understand and acknowledge that there is a high degree of risk involved in trading. Following any strategies or investment methods may lead to potential losses. The content on the site is provided by our contributors and analysts for information purposes only. You are solely responsible for determining whether any trading assets, securities, strategy, or any other product is suitable for investing based on your own investment objectives and financial situation.
          Add to Favorites
          Share

          Gold, Silver Slide on Prospects of Warsh Becoming Next Fed Chair — Market Talk

          Dow Jones Newswires
          Micro 10-Year Yield Futures JAN6
          +0.47%
          Micro 10-Year Yield Futures FEB6
          +0.78%
          Micro 2-Year Yield Futures JAN6
          +2.05%
          Micro 5-Year Yield Futures JAN6
          0.00%
          Micro 5-Year Yield Futures FEB6
          0.00%

          Gold and silver slide on prospects that Kevin Warsh will be selected by President Trump to be the next head of the Federal Reserve, analysts say. Gold and silver are pulling back on rumors of Warsh's appointment as next Fed chair, Maybank analysts say in a FX Research & Strategy report. "Warsh has been a long-time critic of ultra-loose monetary policy and is a former Fed Governor so market could be pricing in how his appointment could affect the future policy path," the analysts add. Spot gold slips 3.6% to $5,184.21/oz; spot silver is down 5.0% at $109.97/oz. (ronnie.harui@wsj.com)

          Risk Warnings and Disclaimers
          You understand and acknowledge that there is a high degree of risk involved in trading. Following any strategies or investment methods may lead to potential losses. The content on the site is provided by our contributors and analysts for information purposes only. You are solely responsible for determining whether any trading assets, securities, strategy, or any other product is suitable for investing based on your own investment objectives and financial situation.
          Add to Favorites
          Share

          Chinalco, Rio Tinto to Buy Control of Brazilian Aluminum Maker CBA — Update

          Dow Jones Newswires
          Micro 10-Year Yield Futures JAN6
          +0.47%
          Micro 10-Year Yield Futures FEB6
          +0.78%
          Micro 2-Year Yield Futures JAN6
          +2.05%
          Micro 5-Year Yield Futures JAN6
          0.00%
          Micro 5-Year Yield Futures FEB6
          0.00%

          By Rhiannon Hoyle

          Aluminum Corp. of China and Rio Tinto agreed to buy a majority stake in Companhia Brasileira de Aluminio for about $900 million.

          Chinalco subsidiary Chalco and Rio Tinto will acquire the nearly 69% stake in CBA from Brazilian conglomerate Votorantim for roughly 4.69 billion reais, equivalent to $903.5 million. The shareholding will be bought via a joint venture that will be 67% owned by the Chinese metals giant, the acquirers said in separate statements Friday.

          The purchase comes amid a pickup in dealmaking in the metals and mining industry, as both Chinese and Western companies seek to expand their footprints through acquisitions.

          Aluminum is expected to face a shortage in the coming years, as demand rises and new smelters become more difficult to build. The metal is widely used in the manufacturing of electric vehicles, jet engines and cell phones, among other things.

          For Chalco, the acquisition "is aligned with the company's strategic direction of optimizing its global industrial layout and holds significant importance," it said.

          CBA, Brazil's oldest established aluminum company, operates three bauxite mines that together produce around 2 million metric tons annually. It also has an aluminum operation in Sao Paulo that includes an alumina refinery, an aluminum smelter and other processing facilities.

          Rio Tinto said the joint venture will tap into complementary expertise to "unlock the next phase of growth at CBA." Chinalco has an 11% stake in Rio Tinto.

          The deal price of 10.50 reais a share in cash represents a 21% premium to CBA's 20-day weighted-average trading price, Rio Tinto said. Once the deal is completed, the joint venture will begin a mandatory tender offer for the remaining shares in CBA not held by Votorantim, it said.

          For the Anglo-Australian company, the world's second-biggest miner by market value, the deal reflects a "strategy to deliver value for shareholders by extending our low-carbon, renewable-powered aluminum footprint in rapidly growing markets," said aluminum chief Jérôme Pécresse.

          "It also provides the opportunity to grow our bauxite and alumina supply chain in the Atlantic region," he said.

          Rio Tinto is meantime considering a possible combination with rival Glencore that could transform it into the world's largest miner with a market value of more than $200 billion.

          Write to Rhiannon Hoyle at rhiannon.hoyle@wsj.com

          Risk Warnings and Disclaimers
          You understand and acknowledge that there is a high degree of risk involved in trading. Following any strategies or investment methods may lead to potential losses. The content on the site is provided by our contributors and analysts for information purposes only. You are solely responsible for determining whether any trading assets, securities, strategy, or any other product is suitable for investing based on your own investment objectives and financial situation.
          Add to Favorites
          Share

          London Metal Exchange Resumes Trade After Technical Glitch — Update

          Dow Jones Newswires
          Micro 10-Year Yield Futures JAN6
          +0.47%
          Micro 10-Year Yield Futures FEB6
          +0.78%
          Micro 2-Year Yield Futures JAN6
          +2.05%
          Micro 5-Year Yield Futures JAN6
          0.00%
          Micro 5-Year Yield Futures FEB6
          0.00%

          By David Winning and Kimberley Kao

          The London Metal Exchange delayed the start of trading on Friday due to technical issues, temporarily stifling activity as commodities markets experience one of their wildest weeks.

          Trading on the LME, which sets benchmark prices for a range of commodities including copper and aluminum, was offline for roughly one hour. The LME's electronic platform usually starts trading at 1.00 a.m. London time.

          The outage happened after days of intense volatility in metals markets as traders responded to triggers such as the threat of U.S. military action against Iran and renewed tariff threats by the White House against allies including South Korea and Canada.

          Copper prices have jumped to a record high as a weaker dollar and demand for physical assets fuels a buying frenzy. On Thursday, three-month copper futures on the LME surged by as much as 10% at their peak.

          The LME outage was the second to roil a major exchange in as many months. In late November, CME Group wasn't able to offer trading in futures tied to U.S. stock indexes, Treasurys, crude oil and more for over 10 hours because a data center that it relied on had overheated.

          Write to Kimberley Kao at kimberley.kao@wsj.com

          Risk Warnings and Disclaimers
          You understand and acknowledge that there is a high degree of risk involved in trading. Following any strategies or investment methods may lead to potential losses. The content on the site is provided by our contributors and analysts for information purposes only. You are solely responsible for determining whether any trading assets, securities, strategy, or any other product is suitable for investing based on your own investment objectives and financial situation.
          Add to Favorites
          Share

          Iron Ore Edges Up in Volatile Trading — Market Talk

          Dow Jones Newswires
          Micro 10-Year Yield Futures JAN6
          +0.47%
          Micro 10-Year Yield Futures FEB6
          +0.78%
          Micro 2-Year Yield Futures JAN6
          +2.05%
          Micro 5-Year Yield Futures JAN6
          0.00%
          Micro 5-Year Yield Futures FEB6
          0.00%

          Iron ore edges higher in the Asia session, reversing earlier losses in a volatile start to the day. As China's steel mills enter the off-peak season, Nanhua Futures analysts expect to see weakness in both supply and demand for the steelmaking material. However, they view downside for iron ore as limited given that steel market dynamics remain relatively supportive and the overall industrial chain remains profitable. The most-traded iron-ore contract on the Dalian Commodity Exchange is 0.25% higher at CNY793.0 a ton. (tracy.qu@wsj.com)

          Risk Warnings and Disclaimers
          You understand and acknowledge that there is a high degree of risk involved in trading. Following any strategies or investment methods may lead to potential losses. The content on the site is provided by our contributors and analysts for information purposes only. You are solely responsible for determining whether any trading assets, securities, strategy, or any other product is suitable for investing based on your own investment objectives and financial situation.
          Add to Favorites
          Share

          Copper Reverses Gains as Metals Retreat

          Trading Economics
          Micro 10-Year Yield Futures JAN6
          +0.47%
          Micro 10-Year Yield Futures FEB6
          +0.78%
          Micro 2-Year Yield Futures JAN6
          +2.05%
          Micro 5-Year Yield Futures JAN6
          0.00%
          Micro 5-Year Yield Futures FEB6
          0.00%

          Copper futures dropped more than 3% to around $6 per pound on Friday, reversing a sharp rally from the previous session amid a broad retreat across the metals complex.

          Investors locked in profits after copper, gold, silver, and other metals surged to record levels, while a nascent rebound in the dollar added further pressure.

          Market participants also reassessed the fundamentals behind the recent speculative rally, which had been driven in part by expectations of higher long-term demand amid limited supply following decades of underinvestment in new mining projects.

          Demand projections are supported by surging investment in data centers and the electrification infrastructure needed for AI services and electric vehicle charging stations.

          Recurring tariff threats from US President Donald Trump further amplified the rise in metal prices, as investors sought hard assets amid economic uncertainty and deteriorating confidence in the dollar.

          Risk Warnings and Disclaimers
          You understand and acknowledge that there is a high degree of risk involved in trading. Following any strategies or investment methods may lead to potential losses. The content on the site is provided by our contributors and analysts for information purposes only. You are solely responsible for determining whether any trading assets, securities, strategy, or any other product is suitable for investing based on your own investment objectives and financial situation.
          Add to Favorites
          Share

          Gold’s record inflows from Asian ETFs seen by some as warning

          Moneycontrol
          Micro 10-Year Yield Futures JAN6
          +0.47%
          Micro 10-Year Yield Futures FEB6
          +0.78%
          Micro 2-Year Yield Futures JAN6
          +2.05%
          Micro 5-Year Yield Futures JAN6
          0.00%
          Micro 5-Year Yield Futures FEB6
          0.00%

          Asian investors are pouring record amounts into gold exchange-traded funds, leading some to question whether the rally in bullion is getting close to topping out.

          Precious metals ETFs listed in the region have attracted $7.1 billion in net inflows in January, with a number drawing in all-time amounts of capital, according to data compiled by Bloomberg. The biggest gains were seen by funds listed in China that cater to retail investors, with Huaan Yifu Gold ETF alone luring in $1.9 billion.

          The price of bullion has skyrocketed is recent weeks, with the yellow metal advancing more than 20% since the start of January, despite a pullback on Friday. High levels of buying by retail investors is often seen as a sign a rally is in its later stages and an asset is overvalued.

          “We have been major gold bulls in this cycle,” buying both gold-mining stocks and ETFs, said Nick Ferres, chief investment officer at Vantage Point Asset Management in Singapore. “However, the recent price action has become rapid, emotional and non-linear, which is a warning sign that the trend is extended tactically.”

          Gold’s breakneck rally has been underpinned by elevated central-bank purchases and inflows into bullion-backed ETFs. Total holdings in gold-backed funds rose every month last year except May, according to World Gold Council data. Precious metals have also benefited from a switch away from the dollar due to unpredictable US policymaking and increasing American isolation.

          Amid other warnings signs, gold’s relative strength index has climbed to about 90, above the level of 70 that is taken to indicate a pullback is overdue. A successful outcome from policies set by the Trump administration would accelerate economic growth, leading to higher interest rates and a stronger US dollar, pushing gold lower, the World Gold Council said in its 2026 outlook published last month.

          Among other China-listed funds that have seen sizable inflows in January, the ChinaAMC Gold ETF drew in $420 million, while the GF Shanghai Gold ETF attracted $191.4 million, both set for records, data compiled by Bloomberg show.

          Some silver-focused Asian ETFs are also heading for monthly inflow records. South Korea-listed Samsung KODEX Silver Futures Special Asset ETF has gained $231.6 million in net inflows for January, also set for a record.

          Subscriptions Halted

          In another sign of frenzied demand, China’s only pure-play silver fund — the UBS SDIC Silver Futures Fund LOF — paused subscriptions on Wednesday and halted trading Friday, after massive inflows drove the fund to an elevated premium over its underlying assets.

          Asset management companies are set to respond to the rising demand for gold ETFs by bringing new products to the market, according to Bloomberg Intelligence.

          “ETF issuers are likely to tap demand for safe-haven assets with more gold-related funds,” analysts Rebecca Sin and Michelle Leung wrote in a research note. “Hong Kong, which offers tools ranging from low-cost physical tracking to leveraged futures and mining equities, has two new listings this week as it seeks to strengthen its position as a gold trading hub.”

          Risk Warnings and Disclaimers
          You understand and acknowledge that there is a high degree of risk involved in trading. Following any strategies or investment methods may lead to potential losses. The content on the site is provided by our contributors and analysts for information purposes only. You are solely responsible for determining whether any trading assets, securities, strategy, or any other product is suitable for investing based on your own investment objectives and financial situation.
          Add to Favorites
          Share
          FastBull
          Copyright © 2026 FastBull Ltd

          728 RM B 7/F GEE LOK IND BLDG NO 34 HUNG TO RD KWUN TONG KLN HONG KONG

          TelegramInstagramTwitterfacebooklinkedin
          App Store Google Play Google Play
          Products
          Charts

          Chats

          Q&A with Experts
          Screeners
          Economic Calendar
          Data
          Tools
          Membership
          Features
          Function
          Markets
          Copy Trading
          Latest Signals
          Contests
          News
          Analysis
          24/7
          Columns
          Education
          Company
          Careers
          About Us
          Contact Us
          Advertising
          Help Center
          Feedback
          User Agreement
          Privacy Policy
          Personal Information Protection Statement
          Business

          White Label

          Data API

          Web Plug-ins

          Poster Maker

          Affiliate Program

          Risk Disclosure

          The risk of loss in trading financial instruments such as stocks, FX, commodities, futures, bonds, ETFs and crypto can be substantial. You may sustain a total loss of the funds that you deposit with your broker. Therefore, you should carefully consider whether such trading is suitable for you in light of your circumstances and financial resources.

          No decision to invest should be made without thoroughly conducting due diligence by yourself or consulting with your financial advisors. Our web content might not suit you since we don't know your financial conditions and investment needs. Our financial information might have latency or contain inaccuracy, so you should be fully responsible for any of your trading and investment decisions. The company will not be responsible for your capital loss.

          Without getting permission from the website, you are not allowed to copy the website's graphics, texts, or trademarks. Intellectual property rights in the content or data incorporated into this website belong to its providers and exchange merchants.

          Not Logged In

          Log in to access more features

          Connect Broker
          Become a signal provider
          Help Center
          Customer Service
          Dark Mode
          Price Up/Down Colors

          Log In

          Sign Up

          Position
          Layout
          Fullscreen
          Default to Chart
          The chart page opens by default when you visit fastbull.com