Markets
News
Analysis
User
24/7
Economic Calendar
Education
Data
- Names
- Latest
- Prev


Signal Accounts for Members
All Signal Accounts
All Contests


Japan Tankan Small Manufacturing Outlook Index (Q4)A:--
F: --
P: --
Japan Tankan Large Non-Manufacturing Outlook Index (Q4)A:--
F: --
P: --
Japan Tankan Large Manufacturing Outlook Index (Q4)A:--
F: --
P: --
Japan Tankan Small Manufacturing Diffusion Index (Q4)A:--
F: --
P: --
Japan Tankan Large Manufacturing Diffusion Index (Q4)A:--
F: --
P: --
Japan Tankan Large-Enterprise Capital Expenditure YoY (Q4)A:--
F: --
P: --
U.K. Rightmove House Price Index YoY (Dec)A:--
F: --
P: --
China, Mainland Industrial Output YoY (YTD) (Nov)A:--
F: --
P: --
China, Mainland Urban Area Unemployment Rate (Nov)A:--
F: --
P: --
Saudi Arabia CPI YoY (Nov)A:--
F: --
P: --
Euro Zone Industrial Output YoY (Oct)A:--
F: --
P: --
Euro Zone Industrial Output MoM (Oct)A:--
F: --
P: --
Canada Existing Home Sales MoM (Nov)A:--
F: --
P: --
Canada National Economic Confidence IndexA:--
F: --
P: --
Canada New Housing Starts (Nov)A:--
F: --
U.S. NY Fed Manufacturing Employment Index (Dec)A:--
F: --
P: --
U.S. NY Fed Manufacturing Index (Dec)A:--
F: --
P: --
Canada Core CPI YoY (Nov)A:--
F: --
P: --
Canada Manufacturing Unfilled Orders MoM (Oct)A:--
F: --
P: --
U.S. NY Fed Manufacturing Prices Received Index (Dec)A:--
F: --
P: --
U.S. NY Fed Manufacturing New Orders Index (Dec)A:--
F: --
P: --
Canada Manufacturing New Orders MoM (Oct)A:--
F: --
P: --
Canada Core CPI MoM (Nov)A:--
F: --
P: --
Canada Trimmed CPI YoY (SA) (Nov)A:--
F: --
P: --
Canada Manufacturing Inventory MoM (Oct)A:--
F: --
P: --
Canada CPI YoY (Nov)A:--
F: --
P: --
Canada CPI MoM (Nov)A:--
F: --
P: --
Canada CPI YoY (SA) (Nov)A:--
F: --
P: --
Canada Core CPI MoM (SA) (Nov)A:--
F: --
P: --
Canada CPI MoM (SA) (Nov)A:--
F: --
P: --
Federal Reserve Board Governor Milan delivered a speech
U.S. NAHB Housing Market Index (Dec)--
F: --
P: --
Australia Composite PMI Prelim (Dec)--
F: --
P: --
Australia Services PMI Prelim (Dec)--
F: --
P: --
Australia Manufacturing PMI Prelim (Dec)--
F: --
P: --
Japan Manufacturing PMI Prelim (SA) (Dec)--
F: --
P: --
U.K. 3-Month ILO Employment Change (Oct)--
F: --
P: --
U.K. Unemployment Claimant Count (Nov)--
F: --
P: --
U.K. Unemployment Rate (Nov)--
F: --
P: --
U.K. 3-Month ILO Unemployment Rate (Oct)--
F: --
P: --
U.K. Average Weekly Earnings (3-Month Average, Including Bonuses) YoY (Oct)--
F: --
P: --
U.K. Average Weekly Earnings (3-Month Average, Excluding Bonuses) YoY (Oct)--
F: --
P: --
France Services PMI Prelim (Dec)--
F: --
P: --
France Composite PMI Prelim (SA) (Dec)--
F: --
P: --
France Manufacturing PMI Prelim (Dec)--
F: --
P: --
Germany Services PMI Prelim (SA) (Dec)--
F: --
P: --
Germany Manufacturing PMI Prelim (SA) (Dec)--
F: --
P: --
Germany Composite PMI Prelim (SA) (Dec)--
F: --
P: --
Euro Zone Composite PMI Prelim (SA) (Dec)--
F: --
P: --
Euro Zone Services PMI Prelim (SA) (Dec)--
F: --
P: --
Euro Zone Manufacturing PMI Prelim (SA) (Dec)--
F: --
P: --
U.K. Services PMI Prelim (Dec)--
F: --
P: --
U.K. Manufacturing PMI Prelim (Dec)--
F: --
P: --
U.K. Composite PMI Prelim (Dec)--
F: --
P: --
Euro Zone ZEW Economic Sentiment Index (Dec)--
F: --
P: --
Germany ZEW Current Conditions Index (Dec)--
F: --
P: --
Germany ZEW Economic Sentiment Index (Dec)--
F: --
P: --
Euro Zone Trade Balance (Not SA) (Oct)--
F: --
P: --
Euro Zone ZEW Current Conditions Index (Dec)--
F: --
P: --
Euro Zone Trade Balance (SA) (Oct)--
F: --
P: --
U.S. Retail Sales MoM (Excl. Automobile) (SA) (Oct)--
F: --
P: --


No matching data
Latest Views
Latest Views
Trending Topics
Top Columnists
Latest Update
White Label
Data API
Web Plug-ins
Affiliate Program
View All

No data
It's essential to seek opportunities where demand is high and prices are favorable if you want to turn a small investment into a substantial return. The real game-changers of today are hidden below the $1 mark. These are high-growth tokens with giant potential that could make regular buyers millionaires faster than Elon Musk can tweet. Here are four tokens under $1 that have the potential to surpass ADA and XRP, with LILPEPE leading the way.
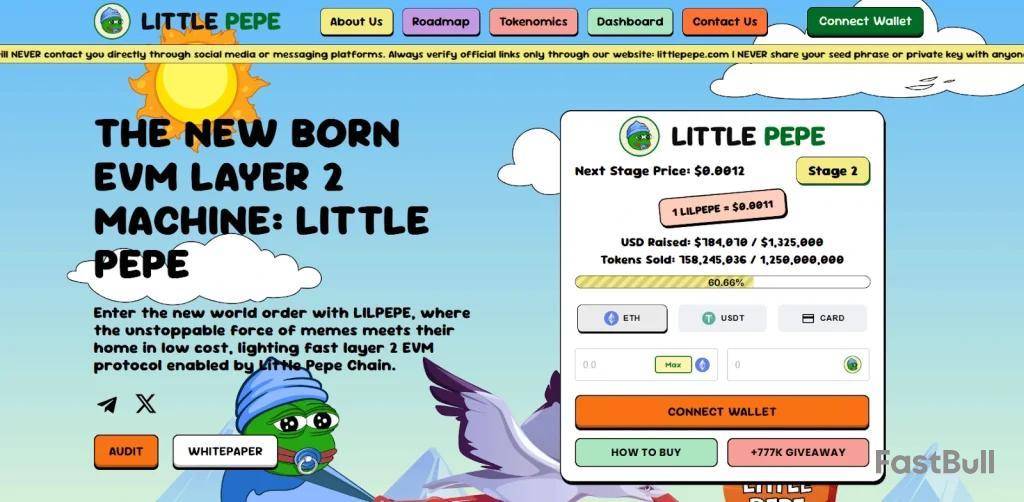
LILPEPE—The Meme King Meets a New Era of Blockchain Power
Enter the new world order with LILPEPE, where memes aren’t just for laughs—they’re building empires. Backed by its blazing-fast Layer 2 EVM-compatible chain, Little Pepe is blending community hype with actual technical utility.
Here’s why deep-pocketed investors are piling in, and why you should pay attention:
But that’s not all.
LILPEPE is fueling its meme-powered rocket with a massive giveaway worth $770,000. Ten lucky winners will each receive $77,000 in LILPEPE tokens. If you needed a sign to jump in, this is it. With 0% transaction tax, ultra-low fees, and lightning-fast finality, the Little Pepe Chain is designed to handle high volumes while providing developers and degens with the tools they need. It’s not just another meme token—it’s the future of fun meets function. Buy now before this rocket takes off.
Kaspa —High-Speed Layer 1 on Fire
Kaspa is over more than just a loser. People are interested in Kaspa, a Proof-of-Work Layer 1 network, because of its GHOSTDAG protocol, which enables blocks to coexist and process simultaneously. As a result? Because of this, transfers occur almost instantly, making it one of the most scalable blockchains available. Currently trading under $0.20, KAS has seen a strong surge in adoption. With increasing miner support and exchange listings, analysts are targeting a run-up to $2 or even $5 before the next bull market peak. This investment represents a substantial bet for those seeking tech-driven growth potential in their portfolio.
Dogecoin —The Meme OG That Won’t Quit
DOGE may be considered the grandfather of meme coins, but it's still worth considering. Still trading under $0.10 at times, it remains one of the most volatile and widely recognized cryptocurrencies worldwide. Musk persistently suggests using DOGE for payments in Tesla and even X (formerly Twitter), causing the coin to surge with every hint. With growing merchant acceptance and renewed community excitement, a return to its all-time high of $0.74—or even a new peak—could easily make today’s buyers millionaires if they hold long enough.
Shiba Inu —The Underdog That Built Its Ecosystem
SHIB has long shed its image as “just another DOGE copy.” With the launch of Shibarium, its Layer 2 network, SHIB now offers serious utility—lower fees, higher speeds, and room for dApps and NFTs. Trading at a fraction of a penny, even a tiny move upward, can deliver monstrous gains. Analysts believe SHIB could increase by 50x its current price during the next altseason, especially if crypto adoption goes mainstream, with memecoins at the forefront.
Final Thoughts—Don’t Sleep on These Underdog Titans
While ADA and XRP are moving slowly and lagging in the market, LILPEPE, KAS, DOGE, and SHIB are building momentum in real-time. However, it's essential to acknowledge that LILPEPE dominates this list. Its meme-driven virality, Layer 2 infrastructure, and exploding presale traction make it a top contender for 2025’s most significant breakout. And with only 33% of Stage 3 tokens left and a clear path to 191x gains, the time to buy is now. If you miss this opportunity, you'll find yourself observing passively as LILPEPE dominates timelines, exchanges, and potentially even the metaverse. This is your opportunity to transform spare change into life-changing money. Buy LILPEPE Now — before the price jumps to $0.0013 and the rocket lifts off.
A significant stash of Dogecoin has landed on the online trading app Robinhood. According to blockchain tracker Whale Alert, 155,000,000 DOGE (worth nearly $24.6 million) were transferred from an unknown wallet to Robinhood within the last 13 hours.
Whale Alert reported the large transaction: "155,000,000 DOGE worth $24,611,763 transferred from unknown wallet to Robinhood."
Whale Alert@whale_alertJun 23, 2025🚨 155,000,000 #DOGE (24,611,763 USD) transferred from unknown wallet to #Robinhoodhttps://t.co/VkuCoa7CPy
The move coincides with a recent surge in DOGE’s price, as the broader crypto market saw a relief rally following the brutal sell-off over the weekend.
Crypto prices traded in green during early Asian trading hours Tuesday, following a significant recovery witnessed across key altcoins on Monday and erasing most of the weekend's losses.
Dogecoin surged as much as 10%, reaching a high of $0.1677 in early Tuesday trading. According to CoinMarketCap, Dogecoin was up 7% in the last 24 hours, trading at $0.163 at press time.
While the reason for the move to Robinhood remains unknown, deposits to exchanges often imply an intent to sell. The move might also be mere reshuffling of funds.
DOGE price
Dogecoin has steadily declined since reaching a high of $0.206 on June 11. As a result, Dogecoin marked just two days in green out of 12 owing to the drop. The Dogecoin price reversed on Monday after hitting support at Sunday's low of $0.142, and the price swiftly rebounded.
The relief rally is likely to face selling at $0.17. If the price retreats below this level, the bears will attempt to bring Dogecoin down below $0.14. If they succeed, DOGE may drop to $0.10.
In contrast, if buyers move the price over $0.17, Dogecoin might reach the 50-day SMA at $0.19. Sellers will seek to defend the 50-day SMA and keep the Dogecoin price around the $0.14 to $0.21 range for a while.
By Adriano Marchese
Mastercard is adopting Fiserv's blockchain-based token across the range of its products, allowing merchants and shoppers to use digital assets for transactions.
The payment card services company said Tuesday that it has expanded its partnership with Fiserv to integrate its new FIUSD token across Mastercard products and services.
The move aims to expand stablecoin adoption and utility for their shared customers, granting them access to a new interoperable digital asset services for banking and payments.
A stablecoin is a type of cryptocurrency designed to maintain a stable value by being pegged to a reference asset such as the U.S. dollar.
The new partnership with Fiserv, a payments and financial technology, will allow consumers and merchants to transition between tradition methods of payment, such as fiat currencies, and FIUSD.
Chiro Aikat, co-president of Americas at Mastercard said the company seeks to create an ecosystem that bridges traditional financial services with digital assets.
Write to Adriano Marchese at adriano.marchese@wsj.com
Bitcoin rallied above $105,000 in mid-morning European trading on Tuesday, clawing back losses sustained over the weekend after dipping below six figures for the first time since May. Yet the respite may prove fleeting, says veteran technician Quantum Ascend (@quantum_ascend).
Bitcoin Price Mirrors 2021
On side-by-side charts of the current cycle and the 2021-to-2024 arc, the analyst argued that Bitcoin is “the same exact pattern—run-up, one high, back down, second high,” followed by an ABC corrective sequence that in 2021 bottomed only after a second, deeper flush. “Gut says no,” he told viewers when asked whether last Friday’s sell-off had already marked capitulation. “We’ve been talking about this ABC since March… people were calling for new lows; I said nope, we got five waves at the top, we got an ABC and then we go— and that’s when the alts take off.”
His base case now envisions a relief rally toward the $107,000–$108,000 band—the level where a trend-line projected from the two post-halving peaks intersects—before a final leg lower drives price into what he calls the “pain box” sandwiched between the 0.702 and 0.618 Fibonacci retracements of the entire rally from last October’s $58,000 breakout. In 2021 that zone ultimately wicked to the exact 0.618, a move he believes could repeat, implying spot levels between roughly $96,500 and $92,000. “This measurement fits the parameter now… if it wants to turn around and rip, great,” he conceded, “but there’s still a very good chance that was not the end.”
Internally, the analyst parses the current drop as the developing C-wave of a larger flat, subdividing into a classic five-wave impulse. Wave three, he notes, appears complete; wave four “could come up high,” granting altcoins a short-lived pop, “but hopefully, again, sooner than later, we roll over.” He cites 2021’s July fractal, when Bitcoin bounced 20% before sliding a final time, as a psychological template. “When there’s a big news narrative event,” he observed, “we’ll get a little relief—people think it’s done—then wham, one more thing to scare retail.”
Macro sentiment, he argues, remains fragile. The Chicago Mercantile Exchange gap at $92,000 is drawing “average-retail” bids, a setup he characterises as a “washing machine” in which professional money fronts liquidity only to fade it. “Retail is just a washing machine, man… that buy isn’t going to get filled,” he warned. Still, he reiterated long-term optimism, revealing he “hammered some buys” during Monday’s dip and advising his followers to dollar-cost average—“not financial advice”—through the turbulence.
Quantum Ascend’s upside target for the ensuing impulsive advance is comparatively restrained: $132,000, a level he says enjoys “two pieces of confluence” and would coincide with “the alts moment” when Bitcoin dominance finally cracks. “We will eventually work our way back up near the top of this B-wave… flag a little, and then boom,” he predicted, referencing November 2021’s so-called “Trump pump” that ignited a multisector altcoin surge.
For now, traders watch the 0.702–0.618 pocket and the mooted relief ceiling at $108,000. Should Bitcoin slice through support without that interim bounce, the analyst says, the flush could conclude “sooner than later,” clearing the runway for what he calls “the next few months—our moment.” In his sign-off he urged viewers to “be an adult, live through it,” but also confessed palpable excitement: “I feel really good about where we’re at.” Whether the market shares his confidence will likely become clear once the final C-wave verdict arrives—perhaps, he hopes, within the week.
At press time, BTC traded at $105,077.
Story Highlights
Polygon has a mind-blowing Layer-2 scaling solution project for Ethereum, which is primarily designed to address slow speeds and the network’s high transaction fees.
As a result, Polygon is seen as a revolutionary framework for developers and users, as it attracts by offering a more efficient Ethereum experience, which is the reason contributing to POL’s price value, too.
Through, POL, which is its native token (formerly MATIC), is utilized for transaction fees and network governance, in the framwork of interconnected Ethereum-compatible blockchain networks.
Its use case makes it an attractive altcoin, and even its token POL price is attracting attention. The coin is expected to show a surge in the coming sessions, but it would require a technical eye to understand.
Therefore, if you are curious about whether the POL price can rebound to $1. Will Polygon go up? And is Polygon a good investment? We bring our Polygon Price Prediction for 2025 – 2030 to explore the POL price prediction.
Table of contents
Overview
| Cryptocurrency | |
| Token | |
| Price | |
| Market Cap | |
| Trading Volume | |
| Circulating Supply | |
| All-time High | $1.29 Mar 14, 2024 |
| All-time Low | $0.1533 Apr 07, 2025 |
Polygon Price Prediction 2025
As evident on the POL/USD daily chart on COINBASE, its price has been down more than 75% since December 2024, and Q1 2025 played a significant role in pushing it deep down the well.
However, in April of Q2 2025, bullish forces revived and took it to the 0.236 level-based resistance in mid-May. Despite the efforts, the Polygon was still very low and was among the list of altcoins that showed muted growth in Q2 compared to other altcoins.
However, the muted growth was brief as mid-May to June bears pushed its price back to April's low, which shows that the asset strongly lacks bullish conviction in the short term.
The POL price could pull below $0.1000 if bearish forces continue downward pressure.
All these circumstances occurred during Donald Trump's presidential start in 2025, and by H1 so far, the market participants have witnessed multiple wars, resulting in bearish dominance.
The recent Israel-Iran agreement was the most significant factor that pushed altcoins like POL's price in June.
However, on June 24th, POL saw a 7% intraday rise with a ceasefire announcement, which reignited people's expectations. Therefore, if the conditions improve, the 0.236 Fibonacci level could be retested in June or July.
If it clears that $0.4572 level in June or July, the odds of clearing Fibo are 0.50, 0.786, and the 1.0 level could be retested by the end of 2025.
Additionally, RSI has reached oversold territory, and with the recent intraday rise, RSI has reversed, too. It shows that the Bullish sentiment is increasing in the short term.
Also, read our Ethereum Price Prediction 2025-2030
Polygon Price Prediction 2026 - 2030
| Year | Potential Low ($) | Potential Average ($) | Potential High ($) |
| 2026 | $0.18870 | $0.47179 | $0.75488 |
| 2027 | $0.30194 | $0.75488 | $1.20782 |
| 2028 | $0.48311 | $1.20782 | $1.93252 |
| 2029 | $0.77297 | $1.93252 | $3.09205 |
| 2030 | $1.23676 | $3.09205 | $4.94729 |
Polygon Price Action 2026
Anticipating further expansion, MATIC’s potential high for 2026 is projected to be $0.75488, while the potential low is estimated at $0.18870, resulting in an average price of $0.47179.
POL Price Prediction 2027
MATIC crypto can make a potential high of $1.20782 in 2027, with a potential low of $0.30194, leading to an average price of $0.75488.
Polygon Crypto Price Forecast 2028
As the POL price progresses, the potential high price for 2028 is projected to be $1.93252, with a potential low of $0.48311, resulting in an average price of $1.20782.
MATIC Coin Price Projection 2029
Polygon coin price potential high for 2029 could be $3.09205, while a potential low of $0.77297, with an average price of $1.93252.
Polygon Price Prediction 2030
With an established position in the market, POL’s potential high for 2030 is projected to be $4.94729. On the flip side, a potential low of $1.23676 will result in an average price of $3.09205.
Market Analysis
| Firm Name | 2025 | 2026 | 2030 |
| CoinCodex | $ 0.71 | $ 0.50 | $ 0.90 |
| Binance | $0.24 | $0.26 | $0.31 |
| Flitpay | $6.25 | $4 | $10.4 |
CoinPedia’s MATIC Price Prediction
Coinpedia's price prediction for Polygon is bullish, suggesting the MATIC crypto price may reach new swing highs and possibly surpass its all-time high in the near future.
The Polygon Price Forecast 2025 predicts a swing high of $0.47181, with an average price of $0.29488.
| Year | 2025 |
| Potential Low | $0.11795 |
| Potential Average | $0.29488 |
| Potential High | $0.47181 |
FAQs
Is MATIC a good investment?Yes, it is a profitable investment, but the digital asset should be under due consideration for the long term.
How high can Polygon MATIC price go by 2025?According to our MATIC price prediction, the altcoin could reach a maximum of $0.47181 by 2025. With a potential surge, the price could go as high as $4.94731 by 2030.
Is Polygon better than Solana?While it is not a direct apples-to-apples comparison, as one is a layer-2 and the other is a layer-1.
How high can Polygon MATIC transactions go?At its best, it can process 65,000 transactions per second.
Why Polygon is faster than Ethereum?The major functionality of this altcoin is to enable the multichain Ethereum ecosystem. It provides a network that offers interoperability between previous and present infrastructure scenarios of Ethereum.
Can polygon hit $100?As per our MATIC price prediction, $100 dollars target is possible over the next 18 years.
Has MATIC changed to POL?Yes, MATIC has been upgraded to POL as the network token for Polygon.
MATIC
BINANCE
White Label
Data API
Web Plug-ins
Poster Maker
Affiliate Program
The risk of loss in trading financial instruments such as stocks, FX, commodities, futures, bonds, ETFs and crypto can be substantial. You may sustain a total loss of the funds that you deposit with your broker. Therefore, you should carefully consider whether such trading is suitable for you in light of your circumstances and financial resources.
No decision to invest should be made without thoroughly conducting due diligence by yourself or consulting with your financial advisors. Our web content might not suit you since we don't know your financial conditions and investment needs. Our financial information might have latency or contain inaccuracy, so you should be fully responsible for any of your trading and investment decisions. The company will not be responsible for your capital loss.
Without getting permission from the website, you are not allowed to copy the website's graphics, texts, or trademarks. Intellectual property rights in the content or data incorporated into this website belong to its providers and exchange merchants.
Not Logged In
Log in to access more features

FastBull Membership
Not yet
Purchase
Log In
Sign Up