Markets
News
Analysis
User
24/7
Economic Calendar
Education
Data
- Names
- Latest
- Prev


Signal Accounts for Members
All Signal Accounts
All Contests


France Trade Balance (SA) (Oct)A:--
F: --
Euro Zone Employment YoY (SA) (Q3)A:--
F: --
Canada Part-Time Employment (SA) (Nov)A:--
F: --
P: --
Canada Unemployment Rate (SA) (Nov)A:--
F: --
P: --
Canada Full-time Employment (SA) (Nov)A:--
F: --
P: --
Canada Labor Force Participation Rate (SA) (Nov)A:--
F: --
P: --
Canada Employment (SA) (Nov)A:--
F: --
P: --
U.S. PCE Price Index MoM (Sept)A:--
F: --
P: --
U.S. Personal Income MoM (Sept)A:--
F: --
P: --
U.S. Core PCE Price Index MoM (Sept)A:--
F: --
P: --
U.S. PCE Price Index YoY (SA) (Sept)A:--
F: --
P: --
U.S. Core PCE Price Index YoY (Sept)A:--
F: --
P: --
U.S. Personal Outlays MoM (SA) (Sept)A:--
F: --
U.S. 5-10 Year-Ahead Inflation Expectations (Dec)A:--
F: --
P: --
U.S. Real Personal Consumption Expenditures MoM (Sept)A:--
F: --
U.S. Weekly Total Rig CountA:--
F: --
P: --
U.S. Weekly Total Oil Rig CountA:--
F: --
P: --
U.S. Consumer Credit (SA) (Oct)A:--
F: --
China, Mainland Foreign Exchange Reserves (Nov)A:--
F: --
P: --
Japan Trade Balance (Oct)A:--
F: --
P: --
Japan Nominal GDP Revised QoQ (Q3)A:--
F: --
P: --
China, Mainland Imports YoY (CNH) (Nov)A:--
F: --
P: --
China, Mainland Exports (Nov)A:--
F: --
P: --
China, Mainland Imports (CNH) (Nov)A:--
F: --
P: --
China, Mainland Trade Balance (CNH) (Nov)A:--
F: --
P: --
China, Mainland Exports YoY (USD) (Nov)A:--
F: --
P: --
China, Mainland Imports YoY (USD) (Nov)A:--
F: --
P: --
Germany Industrial Output MoM (SA) (Oct)A:--
F: --
Euro Zone Sentix Investor Confidence Index (Dec)A:--
F: --
P: --
Canada National Economic Confidence IndexA:--
F: --
P: --
U.K. BRC Like-For-Like Retail Sales YoY (Nov)--
F: --
P: --
U.K. BRC Overall Retail Sales YoY (Nov)--
F: --
P: --
Australia Overnight (Borrowing) Key Rate--
F: --
P: --
RBA Rate Statement
RBA Press Conference
Germany Exports MoM (SA) (Oct)--
F: --
P: --
U.S. NFIB Small Business Optimism Index (SA) (Nov)--
F: --
P: --
Mexico 12-Month Inflation (CPI) (Nov)--
F: --
P: --
Mexico Core CPI YoY (Nov)--
F: --
P: --
Mexico PPI YoY (Nov)--
F: --
P: --
U.S. Weekly Redbook Index YoY--
F: --
P: --
U.S. JOLTS Job Openings (SA) (Oct)--
F: --
P: --
China, Mainland M1 Money Supply YoY (Nov)--
F: --
P: --
China, Mainland M0 Money Supply YoY (Nov)--
F: --
P: --
China, Mainland M2 Money Supply YoY (Nov)--
F: --
P: --
U.S. EIA Short-Term Crude Production Forecast For The Year (Dec)--
F: --
P: --
U.S. EIA Natural Gas Production Forecast For The Next Year (Dec)--
F: --
P: --
U.S. EIA Short-Term Crude Production Forecast For The Next Year (Dec)--
F: --
P: --
EIA Monthly Short-Term Energy Outlook
U.S. API Weekly Gasoline Stocks--
F: --
P: --
U.S. API Weekly Cushing Crude Oil Stocks--
F: --
P: --
U.S. API Weekly Crude Oil Stocks--
F: --
P: --
U.S. API Weekly Refined Oil Stocks--
F: --
P: --
South Korea Unemployment Rate (SA) (Nov)--
F: --
P: --
Japan Reuters Tankan Non-Manufacturers Index (Dec)--
F: --
P: --
Japan Reuters Tankan Manufacturers Index (Dec)--
F: --
P: --
Japan Domestic Enterprise Commodity Price Index MoM (Nov)--
F: --
P: --
Japan Domestic Enterprise Commodity Price Index YoY (Nov)--
F: --
P: --
China, Mainland PPI YoY (Nov)--
F: --
P: --
China, Mainland CPI MoM (Nov)--
F: --
P: --


No matching data
Latest Views
Latest Views
Trending Topics
Top Columnists
Latest Update
White Label
Data API
Web Plug-ins
Affiliate Program
View All

No data
Tokenization of real-world assets (RWAs) is evolving from an abstract concept to a practical financial tool as institutional players increasingly test and deploy blockchain-based infrastructure at scale.
This past week alone saw a flurry of announcements from both traditional financial institutions and blockchain-native firms advancing their RWA initiatives.
On April 30, BlackRock filed to create a digital ledger technology shares class for its $150 billion Treasury Trust fund. It will leverage blockchain technology to maintain a mirror record of share ownership for investors.
The DLT shares will track BlackRock’s BLF Treasury Trust Fund (TTTXX), which may only be purchased from BlackRock Advisors and The Bank of New York Mellon (BNY).
On the same day, Libre announced plans to tokenize $500 million in Telegram debt through its new Telegram Bond Fund (TBF). The fund will be available to accredited investors and usable as collateral for onchain borrowing.
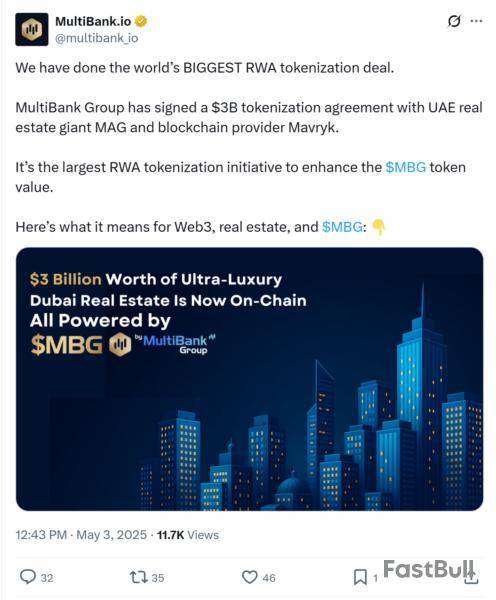
The week’s biggest headline came from Dubai, where MultiBank Group signed a $3 billion RWA tokenization deal with United Arab Emirates-based real estate firm MAG and blockchain infrastructure provider Mavryk. The deal is touted as the largest RWA tokenization initiative to date.
“The recent surge isn’t arbitrary. It’s happening because everything’s lining up,” Eric Piscini, CEO of Hashgraph, told Cointelegraph:
Tokenization has moved beyond theory
Marcin Kazmierczak, co-founder of RedStone, said the recent announcements “demonstrate that tokenization has moved beyond theoretical discussions into practical application by market leaders.”
He added that the growing adoption by big institutions gives the space more credibility, making others feel more confident to join in and help boost new ideas and investments.
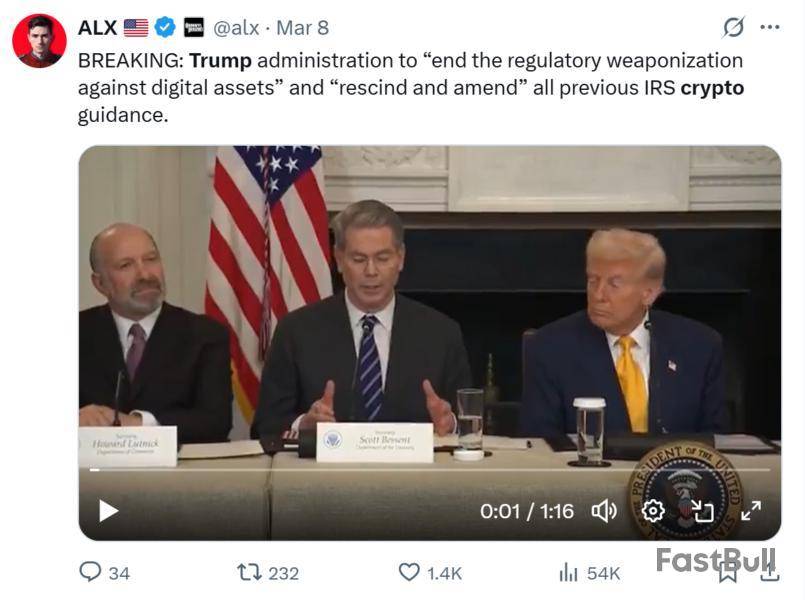
Kazmierczak stated that the renewed interest in RWA tokenization is primarily driven by US President Donald Trump’s pro-crypto administration and growing regulatory clarity.
Trump, who has pledged to “make the US the crypto capital of the world,” has taken a different approach to crypto compared to the Biden administration. That era saw an aggressive crackdown from the US Securities and Exchange Commission (SEC) and the Department of Justice (DOJ), prompting many firms to withdraw from US operations.
However, the narrative appears to be shifting. Since Trump’s election victory, the SEC has dropped or paused over a dozen enforcement cases against crypto companies.
Additionally, the DOJ recently announced the dissolution of its cryptocurrency enforcement unit, signaling a softer approach to the sector.
Aside from regulatory clarity, advancements in technological capabilities, especially in wallets, have also played a key role in driving tokenization adoption, Felipe D’Onofrio, chief technology officer at Brickken, said.
“In parallel, macroeconomic pressures are pushing institutions to search for efficiency and liquidity in traditionally illiquid markets,” he added.
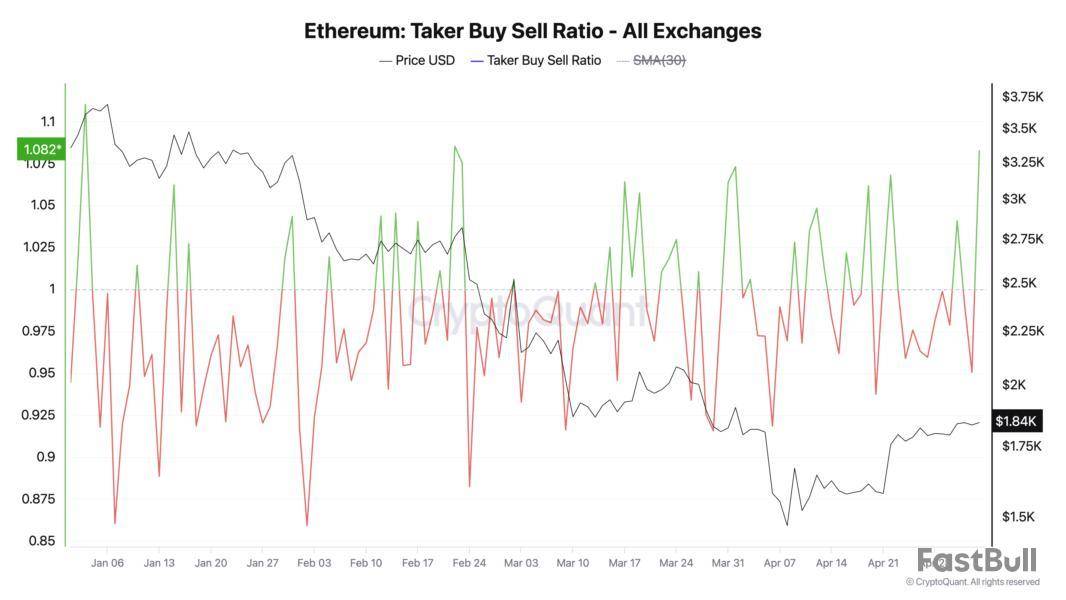
Ethereum remains main hub for tokenization
Ethereum continues to serve as the primary hub for RWA tokenization, thanks to its mature ecosystem, broad developer support and robust infrastructure.
“Ethereum remains by far the most suitable blockchain for large-scale RWA issuance due to its unparalleled security, developer ecosystem, and institutional adoption,” Kazmierczak said.
However, he noted that dedicated RWA-specialized ecosystems like Canton Network, Plume, and Ondo Chain are building compelling alternatives with features designed explicitly for compliant asset tokenization.
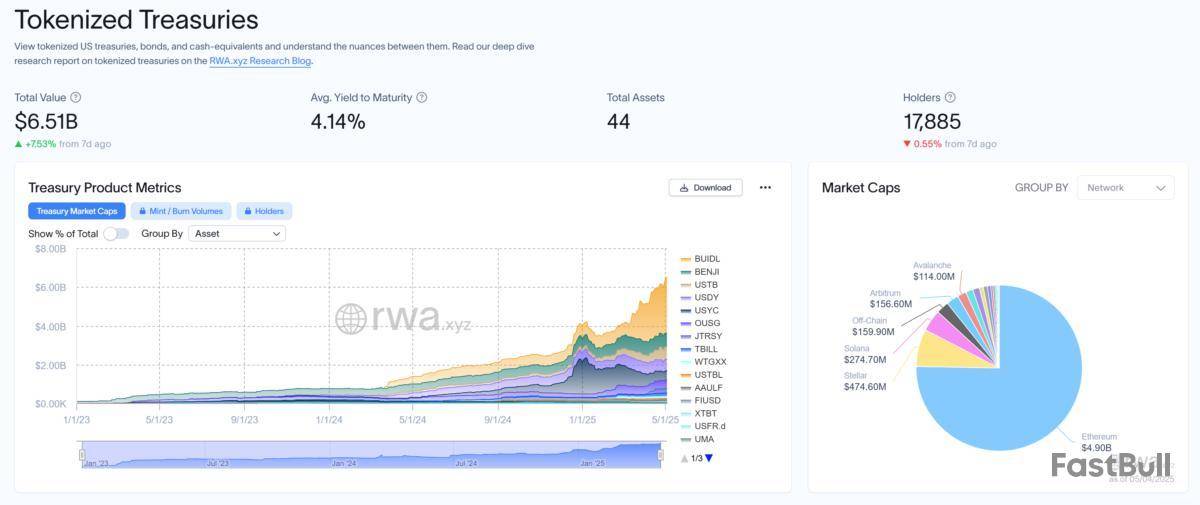
According to data from RWA.xyz, the market value of tokenized US Treasurys currently stands at $6.5 billion. Ethereum accounts for the lion’s share of the market, hosting over $4.9 billion in tokenized Treasurys.
Herwig Koningson, CEO of Security Token Market, said companies like BlackRock have shown that it’s possible to build large-scale tokenized products, worth billions of dollars, using more than one blockchain at the same time.
He said this shows that the success of tokenizing assets doesn’t depend so much on which blockchain is used, but rather on what the company needs the system to do.
“This is why you will see many banks and traditional firms use permissioned blockchains or even private DLT systems,” Koningson said.
Challenges remain, but growth potential is huge
Yet hurdles remain. Regulation continues to be a significant barrier, especially for risk-averse institutions requiring guarantees around compliance and privacy.
Technical limitations also persist, chiefly the lack of interoperability between blockchain platforms, according to Piscini. However, he said hybrid models are gaining traction by offering the privacy of permissioned systems with optional future interoperability with public chains.
Looking ahead, Piscini estimated that more than 10% of global financial assets could be tokenized by the end of the decade. D’Onofrio also made a modest projection, estimating that between 5% and 10% of global financial assets could be tokenized by 2030.
On the other hand, RedStone’s Kazmierczak predicted that approximately 30% of the global financial system will be tokenized by the end of this decade.
In terms of numbers, STM.co predicted that the world’s RWA market will be anywhere between $30 and $50 trillion by the end of 2030.
Most firms predict that the RWA sector will reach a market size of between $4 trillion and $30 trillion by 2030.
If the sector were to achieve the median prediction of about $10 trillion, it would represent more than 50 times the growth from its current value of around $185 billion, including the stablecoin market, according to a Tren Finance research report.
Shiba Inu is facing a new wave of pressure despite the recent emergence of a traditionally bullish technical indicator. The token has dropped even though a golden cross — a pattern often linked to upward momentum — formed on the daily chart recently.
A golden cross happens when a short-term moving average goes above a longer-term moving average. In SHIB's case, the 23-day moving average has crossed the 200-day, which suggests the potential for a bullish trend reversal. But so far, the price action has not shown the expected result.
Right now, SHIB is trading near $0.00001296, down over 5% in recent sessions. The decline comes after a short rise that saw the token reach highs around $0.000014 before hitting a resistance point and dropping.
SHIB is not able to hold gains above the crossover zone, which is making traders worry that the golden cross might be sending out a false signal because of the overall uncertainty in the market.
Technical support is sitting right around $0.00001274, which is in line with the 23-day moving average. If it doesn't hold above this level, it could lead to more selling, with the next support level being around $0.00001107. The price is still holding steady at around $0.00001360, which is the lowest it has been in a while.
The overall situation with meme coins is still a bit uncertain, with market participants keeping a close eye on things like trading volume, trend validation and the overall risk appetite across digital assets.
Golden crosses are usually seen as a good sign for the market, but they can actually be less important when investors are feeling uncertain or when there are a lot of short-term bets being made.
A recent wallet issue involving an attempted 10,000 XRP transaction caused a controversy in the XRP community, prompting confusion and speculation. The failed transaction, flagged on XRPL as a payment to "Xaman Service Fee," showed up during a routine swap operation. Though the transaction didn’t go through due to insufficient funds, the large amount raised immediate concerns.
The flagged transaction appeared during a routine swap operation, where a user was reportedly charged what seemed like a 10,000 XRP service fee.
The transaction showed a failed status labeled "UNFUNDED_PAYMENT," meaning the sending account did not have sufficient balance — excluding reserve requirements — to complete the transfer. Despite this failure, the sheer size of the attempted amount sparked immediate alarm.
David "JoelKatz" Schwartz@JoelKatzMay 04, 2025There's no mystery here. It's a weird edge case that the code was not designed to handle. It's been fixed.
Amid the growing concerns, Ripple’s CTO, David Schwartz, who is also the architect of XRP Ledger, stepped in to clarify. He explained the issue wasn’t intentional or malicious but rather a rare edge case the system wasn’t set up to handle. According to him, the glitch has now been fixed, and no funds were lost as the transaction never succeeded.
Users expressed concern over the possibility of software misbehavior or manipulation, with some viewing the occurrence as a reflection of deeper reliability issues with the Xaman Wallet. One user even raised alarms suggesting this could be a coordinated attempt to damage reputations or target specific companies vocal in their criticism of XRPL's direction.
Some took it a step further, suggesting the issue might be more than just a bug — possibly even a targeted move against developers or projects in the XRP ecosystem. That speculation quickly spread, feeding distrust and frustration.
The leading altcoin ETH has bucked the broader market downturn over the past 24 hours, posting modest gains of around 1%. At press time, the coin trades at $1,842.
This comes as a key momentum metric — the taker buy-sell ratio—surges to its highest level in 30 days, signaling renewed bullish pressure in the asset’s futures market.
Traders Eye ETH Upside as Buy Pressure and Build
According to CryptoQuant, ETH’s taker-buy-sell ratio is currently at 1.08, marking its highest value since early April.
This metric measures the ratio between the buy and sell volumes in ETH’s futures market. A value above 1 suggests that more traders are aggressively buying ETH contracts than selling, while values below 1 indicate dominant sell pressure.
At 1.08, ETH’s taker buy-sell ratio clearly tilts in favor of buyers, reflecting increasing confidence among traders that prices may continue rising.
Moreover, the altcoin’s Relative Strength Index (RSI) continues to trend upward, supporting this bullish narrative. At press time, it is at 58.39 and climbing.
The RSI indicator measures an asset’s overbought and oversold market conditions. It ranges between 0 and 100, with values above 70 indicating that the asset is overbought and due for a decline. Conversely, values under 30 signal that the asset is oversold and could witness a rebound.
ETH’s RSI reading confirms the strengthening bullish bias toward the altcoin, reinforcing the view that it could be primed for further upside.
ETH Builds Strength Above Short-Term Support
At its current price, ETH rests above its 20-day exponential moving average (EMA), which forms dynamic support below its price at $1,770.
The 20-day EMA measures an asset’s average price over the past 20 trading days, giving weight to recent prices. When an asset trades above this key moving average, it signals short-term bullish momentum. This indicates that recent prices are trending higher than the average over the past 20 days. Traders often view this as a sign of underlying strength or an early uptrend.
Therefore, ETH could maintain its rally toward $2,027 if buying pressure gains momentum.
On the other hand, if buying activity wanes, the coin could lose recent gains, break below the 20-day EMA, and fall toward $1,385.
Sitting just below a significant descending resistance line that has limited XRP's upside since the beginning of 2025, the asset is about to enter a technically challenging phase on the charts. Following weeks of consolidation, the price has leveled off at $2.18 with volatility waning and trading volume gradually ceasing. Despite its seemingly insignificant appearance, this move frequently signals impending sharp price action in either direction.
Right now, XRP is stuck between the declining trendline resistance just above $2.20 and the 200 EMA support around $1.99. Momentum is neutral and there are no quick directional indicators when the RSI is around 51. The asset is coiling and a volatility explosion is about to happen, but the setup is obvious. Chart by TradingView">
XRP may move swiftly toward $2.50 and ultimately $3.00 if it breaks above the $2.22 resistance zone with accompanying volume, particularly if sentiment toward altcoins improves or if developments pertaining to Ripple take place.
The breakout led to a 40% move in less than a week when XRP last formed a structure like this in late 2023. It is not impossible for bulls to take control and make a similar run. However, if volume stays low and XRP is unable to sustain support at the $2.00-$1.99 region, a retrace toward $1.85 or even $1.70 is very likely. There are already indications of indecision in the price, and any weakness in the external market could make matters worse.
In this instance, a bearish continuation would be confirmed by the descending triangle breakdown. The continual lack of volume poses the greatest risk to either outcome because it indicates that no one is in a rush to buy and that it would take very little pressure to cause the price to move significantly in either direction. If volatility spikes back up with a lot of volume, XRP will likely take a side and move quickly. Since the chart is currently a ticking time bomb, $3 is not out of the question if the breakout goes in the bulls' favor.
TL;DR
John Squire started with a 10-year setup that investors might have ignored until now. Ever since the project’s establishment around a decade ago, the company behind it has made big moves to enhance adoption. Squire said RippleNet is used in over 55 countries, while some of its notable partners include SBI, Tranglo, and Santander.
As such, he noted that XRP isn’t some “new hype coin. It’s been quietly building since before most influencers discovered Bitcoin.”
He touched upon the prolonged battle between Ripple and the US securities regulator, which dragged on for over four years. Although the SEC has yet to confirm that the case is closed, Ripple’s CEO triumphantlyannouncedit in mid-March. Squire said, “XRP is the only top 10 coin to fight the US government and survive.”
In terms of institutional adoption and the possibility of a spot Ripple ETF in the States, the social media influencer outlined the XRP futures product prepared to be launched by CME this month, as well as the 10 applications sitting on the SEC’s desk. Although the Commissiondelayedmaking a decision on one of them earlier this week, many experts believe it’s just a matter of time before XRP follows the example set by ETH and BTC last year.
Institutional money is knocking
CME launching XRP futures in May 2025
Wall Street wants in
Rumors of BlackRock XRP trust won’t die
This isn’t retail buzz. This is big money warming up.
— John Squire (@TheCryptoSquire) May 1, 2025
XRP Price Chart Says Bull Run
Echoing another report that XRP might skyrocket in the following month(s), Squire said the asset’s chart paints a clear bullish picture. Aside from a few brief fluctuations below $2, the fourth-largest cryptocurrency has mostly remained steady above that line ever since it broke it in late 2024.
Squire added that the RSI is cooling off and the volume is “quietly building. Smart money doesn’t chase pumps. It buys when you are bored,” he added. There’s certainly some proof for that, as whales accumulated nearly $2 billion worth of XRP in April alone. Additionally, whale addresses have skyrocketed to a record of their own above 300,000.
After the mandatory disclaimer that his post is not financial advice, Squire concluded that the most hated assets, such as XRP, often outperform.
Bitcoin is red hot again. Price reached $97,500 before dipping slightly lower to $97,000, and the markets are abuzz. Sellers anticipating Bitcoin’s upswing might be in for trouble. Figures reveal over $3 billion worth of short positions potentially being erased should Bitcoin move over the coveted $100,000 threshold.
Massive Short Positions Clustered Below $100K
According to Coinglass, there’s a heavy concentration of short positions across major exchanges like Binance, OKX, and Bybit between the $97K and $100K range. That cluster of bets against Bitcoin is now on shaky ground. A move past $100K could lead to a wave of liquidations totaling about $3.04 billion.
If Bitcoin goes even further—to approximately $105,000—liquidations may rise to almost $3.73 billion. At the last all-time high of $109,000, the figure may reach $4 billion. Short sellers who sold the market with high leverage are most vulnerable, and the heat is on.
Long Positions Cleared In Earlier Dip
While shorts are currently in the crosshairs, long positions already lost some ground. In a recent dip, longs saw much of the bullish bets get washed out. The aggregate leverage that supported long positions has declined drastically, according to the red trendline of long liquidations.
This leaves fewer overconfident buyers propping up the market, lessening the risk of an abrupt crash from long-side liquidation. The reset also leaves a cleaner path higher, as there is less resistance from leveraged longs attempting to hold their positions. Resistance Zone Between $96K And $98K
Bitcoin is now trading within one of its largest resistance zones. On-chain indicators on IntoTheBlock indicate that an estimated 1.06 million wallets purchased approximately 750,800 BTC between the $96K and $98K regions. That’s nearly $73 billion’s worth of Bitcoin at break-even for a good number of holders.
This region is significant. If Bitcoin manages to break above it, there will be less selling pressure in the way. The price may rise quicker with fewer hurdles between $98K and $100K.
Carl Moon@TheMoonCarlMay 02, 2025$3B in #Bitcoin shorts will get liquidated at $100K.
Let’s send it. pic.twitter.com/VKMePfQDhS
The $100,000 level is more than a figure. It’s a psychological mark for traders, and it might be the beginning of something bigger. Crypto analyst Carl Moon responded to the situation on social media with a quick comment: “Let’s send it.” The remark captures the sentiment of most in the market.
At present, Bitcoin is probing its limits. If the bulls continue in charge, shorts may become squeezed, and the path to six figures may be nearer than it appears.
Featured image from Gemini Imagen, chart from TradingView
White Label
Data API
Web Plug-ins
Poster Maker
Affiliate Program
The risk of loss in trading financial instruments such as stocks, FX, commodities, futures, bonds, ETFs and crypto can be substantial. You may sustain a total loss of the funds that you deposit with your broker. Therefore, you should carefully consider whether such trading is suitable for you in light of your circumstances and financial resources.
No decision to invest should be made without thoroughly conducting due diligence by yourself or consulting with your financial advisors. Our web content might not suit you since we don't know your financial conditions and investment needs. Our financial information might have latency or contain inaccuracy, so you should be fully responsible for any of your trading and investment decisions. The company will not be responsible for your capital loss.
Without getting permission from the website, you are not allowed to copy the website's graphics, texts, or trademarks. Intellectual property rights in the content or data incorporated into this website belong to its providers and exchange merchants.
Not Logged In
Log in to access more features

FastBull Membership
Not yet
Purchase
Log In
Sign Up