• Trade
  • Markets
  • Copy
  • Contests
  • News
  • 24/7
  • Calendar
  • Q&A
  • Chats
Trending
Screeners
SYMBOL
LAST
BID
ASK
HIGH
LOW
NET CHG.
%CHG.
SPREAD
SPX
S&P 500 Index
6852.69
6852.69
6852.69
6878.28
6852.69
-17.71
-0.26%
--
DJI
Dow Jones Industrial Average
47814.08
47814.08
47814.08
47971.51
47771.72
-140.90
-0.29%
--
IXIC
NASDAQ Composite Index
23543.99
23543.99
23543.99
23698.93
23543.99
-34.12
-0.14%
--
USDX
US Dollar Index
99.060
99.140
99.060
99.110
98.730
+0.110
+ 0.11%
--
EURUSD
Euro / US Dollar
1.16296
1.16303
1.16296
1.16717
1.16245
-0.00130
-0.11%
--
GBPUSD
Pound Sterling / US Dollar
1.33178
1.33187
1.33178
1.33462
1.33087
-0.00134
-0.10%
--
XAUUSD
Gold / US Dollar
4190.34
4190.75
4190.34
4218.85
4175.92
-7.57
-0.18%
--
WTI
Light Sweet Crude Oil
59.002
59.032
59.002
60.084
58.892
-0.807
-1.35%
--

Community Accounts

Signal Accounts
--
Profit Accounts
--
Loss Accounts
--
View More

Become a signal provider

Sell trading signals to earn additional income

View More

Guide to Copy Trading

Get started with ease and confidence

View More

Signal Accounts for Members

All Signal Accounts

Best Return
  • Best Return
  • Best P/L
  • Best MDD
Past 1W
  • Past 1W
  • Past 1M
  • Past 1Y

All Contests

  • All
  • Trump Updates
  • Recommend
  • Stocks
  • Cryptocurrencies
  • Central Banks
  • Featured News
Top News Only
Share

The S&P 500 Opened 4.80 Points Higher, Or 0.07%, At 6875.20; The Dow Jones Industrial Average Opened 16.52 Points Higher, Or 0.03%, At 47971.51; And The Nasdaq Composite Opened 60.09 Points Higher, Or 0.25%, At 23638.22

Share

Reuters Poll - Swiss National Bank Policy Rate To Be 0.00% At End-2026, Said 21 Of 25 Economists, Four Said It Would Be Cut To -0.25%

Share

USGS - Magnitude 7.6 Earthquake Strikes Misawa, Japan

Share

Reuters Poll - Swiss National Bank To Hold Policy Rate At 0.00% On December 11, Said 38 Of 40 Economists, Two Said Cut To -0.25%

Share

Traders Believe There Is A 20% Chance That The European Central Bank Will Raise Interest Rates Before The End Of 2026

Share

Toronto Stock Index .GSPTSE Rises 11.99 Points, Or 0.04 Percent, To 31323.40 At Open

Share

Japan Meteorological Agency: A Tsunami With A Maximum Height Of Three Meters Is Expected Following The Earthquake In Japan

Share

Japan Meteorological Agency: A 7.2-magnitude Earthquake Struck Off The Coast Of Northern Japan, And A Tsunami Warning Has Been Issued

Share

Japan Finance Minister Katayama: G7 Expected To Hold Another Meeting By The End Of This Year

Share

The Japan Meteorological Agency Reported That An Earthquake Occurred In The Sea Near Aomori

Share

Japan Finance Minister Katayama: The G7 Finance Ministers' Meeting Discussed The Critical Mineral Supply Chain And Support For Ukraine

Share

Japan Finance Minister Katayama: Held Onlinemeeting With G7 Finance Ministers

Share

Fed Data - USA Effective Federal Funds Rate At 3.89 Percent On 05 December On $88 Billion In Trades Versus 3.89 Percent On $87 Billion On 04 December

Share

Chinese Foreign Minister Wang Yi: One-China Principle Is An Important Political Foundation For China-Germany Relations, And There Is No Room For Ambiguity

Share

Chinese Foreign Minister Wang Yi: Hopes Germany To Understand, Support China's Position Regarding Japan Prime Minister's Remark On Taiwan

Share

Chinese Foreign Minister Wang Yi: Hopes Germany Will View China More Objectively And Rationally, Adhere To The Positioning Of China-Germany Partnership

Share

China Foreign Ministry: China's Foreign Minister Wang Yi Meets German Counterpart

Share

Israeli Government Spokesperson: Netanyahu Will Meet Trump On December 29

Share

Stc Did Not Ask Internationally-Government To Leave Aden - Senior Stc Official To Reuters

Share

Members Of Internationally-Recognised Government, Opposed To Northern Houthis, Have Left Aden - Senior Stc Official To Reuters

TIME
ACT
FCST
PREV
France Trade Balance (SA) (Oct)

A:--

F: --

P: --
Euro Zone Employment YoY (SA) (Q3)

A:--

F: --

P: --
Canada Part-Time Employment (SA) (Nov)

A:--

F: --

P: --

Canada Unemployment Rate (SA) (Nov)

A:--

F: --

P: --

Canada Full-time Employment (SA) (Nov)

A:--

F: --

P: --

Canada Labor Force Participation Rate (SA) (Nov)

A:--

F: --

P: --

Canada Employment (SA) (Nov)

A:--

F: --

P: --

U.S. PCE Price Index MoM (Sept)

A:--

F: --

P: --

U.S. Personal Income MoM (Sept)

A:--

F: --

P: --

U.S. Core PCE Price Index MoM (Sept)

A:--

F: --

P: --

U.S. PCE Price Index YoY (SA) (Sept)

A:--

F: --

P: --

U.S. Core PCE Price Index YoY (Sept)

A:--

F: --

P: --

U.S. Personal Outlays MoM (SA) (Sept)

A:--

F: --

P: --
U.S. 5-10 Year-Ahead Inflation Expectations (Dec)

A:--

F: --

P: --

U.S. Real Personal Consumption Expenditures MoM (Sept)

A:--

F: --

P: --
U.S. Weekly Total Rig Count

A:--

F: --

P: --

U.S. Weekly Total Oil Rig Count

A:--

F: --

P: --

U.S. Consumer Credit (SA) (Oct)

A:--

F: --

P: --
China, Mainland Foreign Exchange Reserves (Nov)

A:--

F: --

P: --

Japan Trade Balance (Oct)

A:--

F: --

P: --

Japan Nominal GDP Revised QoQ (Q3)

A:--

F: --

P: --

China, Mainland Imports YoY (CNH) (Nov)

A:--

F: --

P: --

China, Mainland Exports (Nov)

A:--

F: --

P: --

China, Mainland Imports (CNH) (Nov)

A:--

F: --

P: --

China, Mainland Trade Balance (CNH) (Nov)

A:--

F: --

P: --

China, Mainland Exports YoY (USD) (Nov)

A:--

F: --

P: --

China, Mainland Imports YoY (USD) (Nov)

A:--

F: --

P: --

Germany Industrial Output MoM (SA) (Oct)

A:--

F: --

P: --
Euro Zone Sentix Investor Confidence Index (Dec)

A:--

F: --

P: --

Canada National Economic Confidence Index

A:--

F: --

P: --

U.K. BRC Like-For-Like Retail Sales YoY (Nov)

--

F: --

P: --

U.K. BRC Overall Retail Sales YoY (Nov)

--

F: --

P: --

Australia Overnight (Borrowing) Key Rate

--

F: --

P: --

RBA Rate Statement
RBA Press Conference
Germany Exports MoM (SA) (Oct)

--

F: --

P: --

U.S. NFIB Small Business Optimism Index (SA) (Nov)

--

F: --

P: --

Mexico 12-Month Inflation (CPI) (Nov)

--

F: --

P: --

Mexico Core CPI YoY (Nov)

--

F: --

P: --

Mexico PPI YoY (Nov)

--

F: --

P: --

U.S. Weekly Redbook Index YoY

--

F: --

P: --

U.S. JOLTS Job Openings (SA) (Oct)

--

F: --

P: --

China, Mainland M1 Money Supply YoY (Nov)

--

F: --

P: --

China, Mainland M0 Money Supply YoY (Nov)

--

F: --

P: --

China, Mainland M2 Money Supply YoY (Nov)

--

F: --

P: --

U.S. EIA Short-Term Crude Production Forecast For The Year (Dec)

--

F: --

P: --

U.S. EIA Natural Gas Production Forecast For The Next Year (Dec)

--

F: --

P: --

U.S. EIA Short-Term Crude Production Forecast For The Next Year (Dec)

--

F: --

P: --

EIA Monthly Short-Term Energy Outlook
U.S. API Weekly Gasoline Stocks

--

F: --

P: --

U.S. API Weekly Cushing Crude Oil Stocks

--

F: --

P: --

U.S. API Weekly Crude Oil Stocks

--

F: --

P: --

U.S. API Weekly Refined Oil Stocks

--

F: --

P: --

South Korea Unemployment Rate (SA) (Nov)

--

F: --

P: --

Japan Reuters Tankan Non-Manufacturers Index (Dec)

--

F: --

P: --

Japan Reuters Tankan Manufacturers Index (Dec)

--

F: --

P: --

Japan Domestic Enterprise Commodity Price Index MoM (Nov)

--

F: --

P: --

Japan Domestic Enterprise Commodity Price Index YoY (Nov)

--

F: --

P: --

China, Mainland PPI YoY (Nov)

--

F: --

P: --

China, Mainland CPI MoM (Nov)

--

F: --

P: --

Q&A with Experts
    • All
    • Chatrooms
    • Groups
    • Friends
    Connecting
    .
    .
    .
    Type here...
    Add Symbol or Code

      No matching data

      All
      Trump Updates
      Recommend
      Stocks
      Cryptocurrencies
      Central Banks
      Featured News
      • All
      • Russia-Ukraine Conflict
      • Middle East Flashpoint
      • All
      • Russia-Ukraine Conflict
      • Middle East Flashpoint
      Search
      Products

      Charts Free Forever

      Chats Q&A with Experts
      Screeners Economic Calendar Data Tools
      Membership Features
      Data Warehouse Market Trends Institutional Data Policy Rates Macro

      Market Trends

      Market Sentiment Order Book Forex Correlations

      Top Indicators

      Charts Free Forever
      Markets

      News

      News Analysis 24/7 Columns Education
      From Institutions From Analysts
      Topics Columnists

      Latest Views

      Latest Views

      Trending Topics

      Top Columnists

      Latest Update

      Signals

      Copy Rankings Latest Signals Become a signal provider AI Rating
      Contests
      Brokers

      Overview Brokers Assessment Rankings Regulators News Claims
      Broker listing Forex Brokers Comparison Tool Live Spread Comparison Scam
      Q&A Complaint Scam Alert Videos Tips to Detect Scam
      More

      Business
      Events
      Careers About Us Advertising Help Center

      White Label

      Data API

      Web Plug-ins

      Affiliate Program

      Awards Institution Evaluation IB Seminar Salon Event Exhibition
      Vietnam Thailand Singapore Dubai
      Fans Party Investment Sharing Session
      FastBull Summit BrokersView Expo
      Recent Searches
        Top Searches
          Markets
          News
          Analysis
          User
          24/7
          Economic Calendar
          Education
          Data
          • Names
          • Latest
          • Prev

          View All

          No data

          Scan to Download

          Faster Charts, Chat Faster!

          Download App
          English
          • English
          • Español
          • العربية
          • Bahasa Indonesia
          • Bahasa Melayu
          • Tiếng Việt
          • ภาษาไทย
          • Français
          • Italiano
          • Türkçe
          • Русский язык
          • 简中
          • 繁中
          Open Account
          Search
          Products
          Charts Free Forever
          Markets
          News
          Signals

          Copy Rankings Latest Signals Become a signal provider AI Rating
          Contests
          Brokers

          Overview Brokers Assessment Rankings Regulators News Claims
          Broker listing Forex Brokers Comparison Tool Live Spread Comparison Scam
          Q&A Complaint Scam Alert Videos Tips to Detect Scam
          More

          Business
          Events
          Careers About Us Advertising Help Center

          White Label

          Data API

          Web Plug-ins

          Affiliate Program

          Awards Institution Evaluation IB Seminar Salon Event Exhibition
          Vietnam Thailand Singapore Dubai
          Fans Party Investment Sharing Session
          FastBull Summit BrokersView Expo

          Ethereum Breakdown: Analyst Eyes $1,200 Price Target

          NewsBTC
          Bitcoin / Tether
          +0.30%
          1inch / Tether
          -1.83%
          AAVE / Tether
          +3.39%
          Acala / Tether
          -6.37%
          Fusionist / Tether
          -8.24%

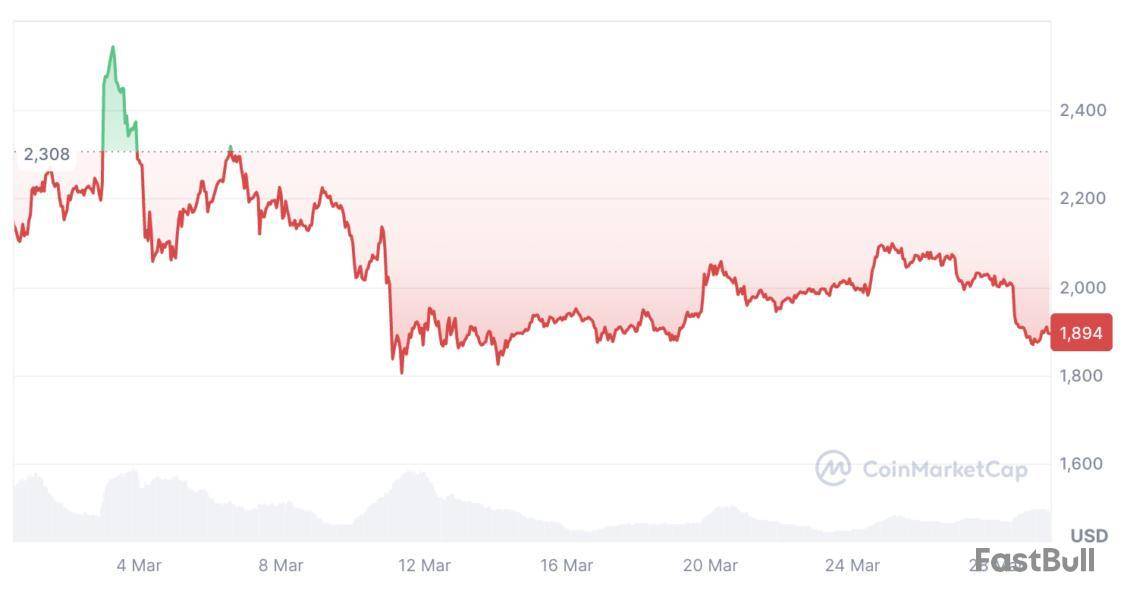
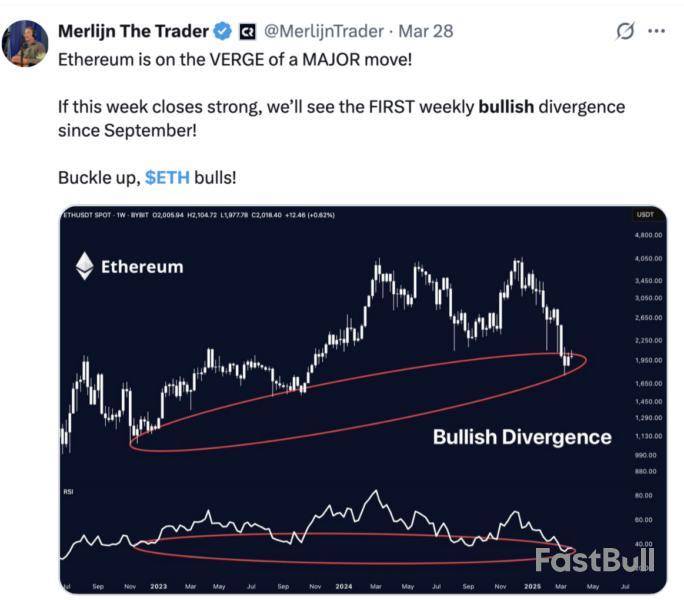
          Following a period of intense price consolidation, the Ethereum (ETH) market experienced an eventful trading week that featured a damning rejection at the $2,100 price level which has emerged as a major resistance zone in recent times. Following this bearish development, analysts continue to speculate on the future of crypto’s largest altcoin.

          Ethereum’s $2,100 Rejection Signals Further Decline, But How Low Can ETH Go?

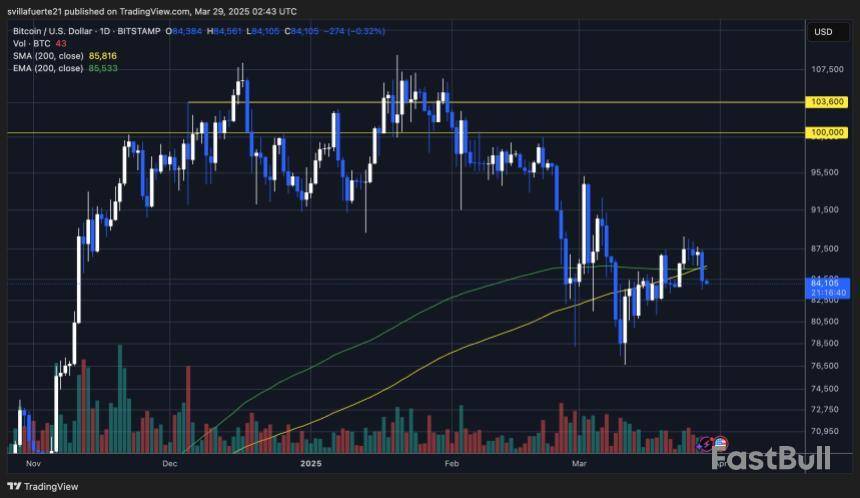
          In an X post on March 28, a prominent market expert with X username Cryptododo7 provided valuable insights on Ethereum’s potential trajectory following its latest rejection at the $2,100 price zone. Via a technical analysis of the daily ETH/USD trading chart, Cryptododo7 hints that the ETH market sentiment is currently bearish suggesting a major downside in the coming weeks.

          Within the last six months, Ethereum suffered a breakdown from an ascending channel stretching to 2023. This negative development was initiated by the formation of a one-year-long double top as seen between 2024-2025. For context, a double top is a bearish reversal pattern consisting of two peaks that reach a similar level i.e. $4.100 in ETH’s case, and are separated by a through resembling the letter “M”.

          Ethereum

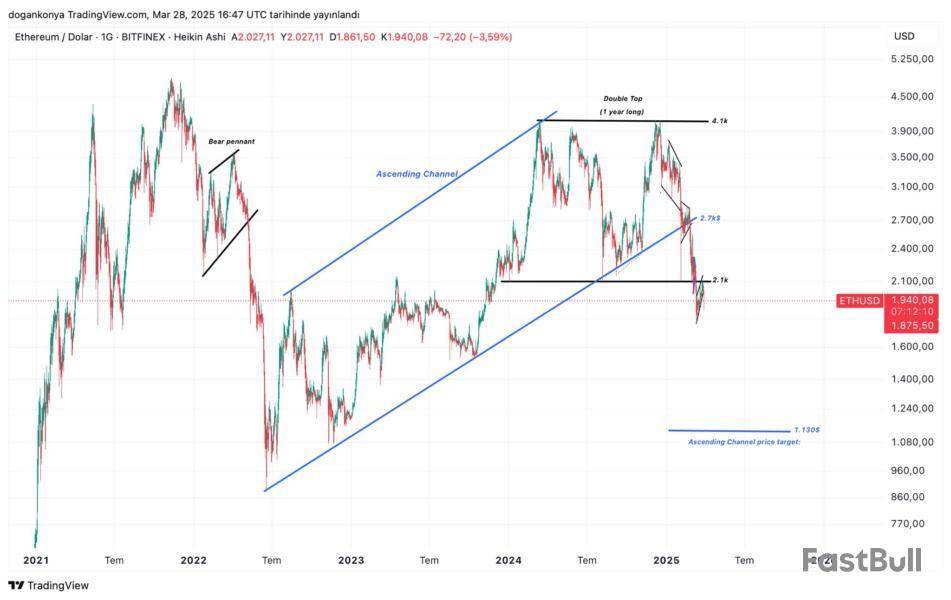
          The existence of a double-top formation since early 2025 has pushed ETH into a downward spiral during which the altcoin’s value has declined by 54% as it crashed below the lower boundary of its ascending channel. Following the latest rejection at $2,100, Ethereum seems less likely to re-discover its bullish form as its price now lingers around $1,870.

          According to Cryptododo7, Ethereum could undergo a sustained downtrend pointing to potential bearish targets around $1,130 – $1,200 based on the height of the now invalid ascending channel.

          Ethereum Market Outlook

          Beyond technical indicators, the Ethereum market is being strongly influenced by Bitcoin’s market uncertainty and general macroeconomic factors.

          While the inauguration of US President Donald Trump marked a positive shift in US crypto policy as evidenced by the creation of the US Digital Stockpile Reserve among others, other administrative decisions on tariffs and international trade have negatively impacted the crypto market prices with investors selling their holdings in high-risk assets in fear of a global trade war.

          Looking forward, there is likely to be any stability on the macroeconomic front as talks of a potential economic recession continue to gain traction.

          At the time of writing, ETH was trading at $1,881 following a heavy 6.81% decline in the past day. ETH bulls must provide sufficient demand to break past the $2,100 to neutralize the current bearish prediction and perhaps ignite a market recovery.

          Featured image from Pexels, chart from Tradingview

          Risk Warnings and Disclaimers
          You understand and acknowledge that there is a high degree of risk involved in trading. Following any strategies or investment methods may lead to potential losses. The content on the site is provided by our contributors and analysts for information purposes only. You are solely responsible for determining whether any trading assets, securities, strategy, or any other product is suitable for investing based on your own investment objectives and financial situation.
          Add to Favorites
          Share

          Bitcoin OTC Desks Are Draining – Supply Squeeze On The Horizon?

          NewsBTC
          Bitcoin / Tether
          +0.30%
          1inch / Tether
          -1.83%
          AAVE / Tether
          +3.39%
          Acala / Tether
          -6.37%
          Fusionist / Tether
          -8.24%

          Bitcoin has dropped below the $85,000 level as selling pressure returns across the crypto market. After several days of tight consolidation just under the $88K resistance zone, bearish momentum has regained control, dragging prices lower and signaling the end of a short-lived period of stability. The broader financial landscape remains tense, with trade war fears and mounting uncertainty continuing to weigh heavily on risk assets — and Bitcoin is no exception.

          Global markets are facing increasing volatility, driven by geopolitical tensions and fragile investor sentiment. As traditional markets falter, the crypto space has followed suit, showing signs of weakness amid macro headwinds. Many traders are now watching for signs of deeper corrections across the board.

          Despite the pullback, there may be a silver lining. According to fresh data from CryptoQuant, OTC (Over-the-Counter) desks are draining at a fast pace. This trend often indicates increased institutional accumulation — as OTC transactions are typically used by larger players to avoid slippage on exchanges. While short-term price action remains bearish, the reduction in OTC supply could be an early signal of long-term confidence building under the surface. For now, Bitcoin must find stability before bulls can attempt a meaningful rebound.

          Bitcoin Holds $84K As Analysts Debate Market Direction

          Bitcoin is at a critical point, with bulls struggling to reclaim the $90,000 level but managing to hold firm above the $84,000 support zone. This tight range reflects growing uncertainty in the market, as price action stalls and sentiment becomes increasingly divided. Some analysts argue that the bull market has run its course, pointing to fading momentum and macroeconomic pressure as signs that a deeper correction is underway. Others believe that this is simply a healthy pause in a longer-term uptrend, with new all-time highs still ahead.

          Top analyst Quinten Francois has weighed in, pointing to a key on-chain metric that may support the bullish case. According to Francois, the total balance held by OTC desks has been steadily draining since January 2022 — a trend that has continued into 2025.

          A declining OTC desk balance typically signals increasing demand from large-scale buyers, such as institutions or high-net-worth investors. These desks are used to facilitate large trades off-exchange to avoid slippage, so when their balances trend down, it often means big players are buying directly and moving assets into cold storage or long-term holdings. This can reduce circulating supply and act as a quiet form of accumulation during periods of uncertainty.

          Bitcoin Total OTC Desk Balance | Source: Quinten Francois on X

          While short-term price action remains uncertain, the continued OTC desk outflows suggest that large investors are positioning for long-term gains. For now, all eyes remain on the $84K–$90K range. A breakdown below support could trigger deeper losses, but a breakout above resistance may reignite bullish momentum — especially if institutional interest continues to grow behind the scenes.

          BTC Struggles To Reclaim Higher Supply Levels

          Bitcoin is trading at $84,100 after losing the 200-day moving average (MA) and exponential moving average (EMA), both of which were positioned around $85,500. This breakdown has weakened the bullish structure and placed BTC in a vulnerable position, with momentum now clearly favoring the bears. For bulls to regain control, they must hold above the $82,500 support level in the coming sessions.

          BTC trading below the 200-day MA | Source: BTCUSDT chart on TradingView

          Maintaining this level would signal stability and could pave the way for a rebound toward the key resistance zone between $89,000 and $91,000. Reclaiming that area would be a significant step toward restoring bullish sentiment and potentially reigniting the broader uptrend.

          However, if BTC fails to hold above the $82,000 mark, the market could see intensified selling pressure and a sharp drop below $80,000. A break of that psychological level would likely confirm a deeper correction and shift sentiment further in favor of the bears.

          With volatility rising and macroeconomic uncertainty still shaking global markets, the next few days will be critical for Bitcoin’s short-term direction. Bulls need to act quickly to avoid further downside and re-establish momentum above the $85K mark.

          Featured image from Dall-E, chart from TradingView

          Risk Warnings and Disclaimers
          You understand and acknowledge that there is a high degree of risk involved in trading. Following any strategies or investment methods may lead to potential losses. The content on the site is provided by our contributors and analysts for information purposes only. You are solely responsible for determining whether any trading assets, securities, strategy, or any other product is suitable for investing based on your own investment objectives and financial situation.
          Add to Favorites
          Share

          Greedy L2s are the reason ETH is a 'completely dead' investment: VC

          Cointelegraph
          Bitcoin / Tether
          +0.30%
          1inch / Tether
          -1.83%
          AAVE / Tether
          +3.39%
          Acala / Tether
          -6.37%
          Fusionist / Tether
          -8.24%

          Ether's declining appeal as an investment comes from layer-2’s draining value from the main network and a lack of community pushback on excessive token creation, a crypto venture capitalist says.

          “The #1 cause of this is greedy Eth L2s siphoning value from the L1 and the social consensus that excess token creation was A-OK,” Castle Island Ventures partner Nic Carter said in a March 28 X post.

          Ether “died by its own hand”

          “ETH was buried in an avalanche of its own tokens. Died by its own hand,” Carter said. He said this in response to Lekker Capital founder Quinn Thompson’s claim that Ether is “completely dead” as an investment.

          Cryptocurrencies

          “A $225 billion market cap network that is seeing declines in transaction activity, user growth and fees/revenues. There is no investment case here. As a network with utility? Yes. As an investment? Absolutely not,” Thompson said in a March 28 X post.

          The ETH/BTC ratio — which shows Ether’s relative strength compared to Bitcoin — is sitting at 0.02260, its lowest level in nearly five years, according to TradingView data.

          At the time of publication, Ether is trading at $1,894, down 5.34% over the past seven days, according to CoinMarketCap data.

          Cryptocurrencies

          Meanwhile, Cointelegraph Magazine reported in September 2024 that fee revenue for Ethereum had “collapsed” by 99% over the previous six months as “extractive L2s” absorbed all the users, transactions and fee revenue while contributing nothing to the base layer.

          Around the same time, Cinneamhain Ventures partner Adam Cochran said Based Rollups could solve the issue of Ethereum’s layer-2 networks pulling liquidity and revenue from the blockchain’s base layer.

          Cochran said Based Rollups could “directly impact the monetization of Ethereum by making a pretty fundamental change to incentive structures.”

          Despite optimism toward the end of last year about Ether reaching $10,000 in 2025 — especially after reaching $4,000 in December, the same month Bitcoin touched $100,000 for the first time — it has since seen a sharp decline alongside the broader crypto market downturn.

          Standard Chartered added to the bearish outlook via a March 17 client letter, which revised down their end of 2025 ETH price estimate from $10,000 to $4,000, a 60% reduction.

          However, several crypto traders, including pseudonymous traders Doctor Profit and Merlijn The Trader, are “insanely bullish” and argue that Ether could be the “best opportunity in the market.”

          Cryptocurrencies

          Risk Warnings and Disclaimers
          You understand and acknowledge that there is a high degree of risk involved in trading. Following any strategies or investment methods may lead to potential losses. The content on the site is provided by our contributors and analysts for information purposes only. You are solely responsible for determining whether any trading assets, securities, strategy, or any other product is suitable for investing based on your own investment objectives and financial situation.
          Add to Favorites
          Share

          Bitcoin And Ethereum Face $14 Billion Options Expiry—Market Impact Ahead?

          NewsBTC
          Bitcoin / Tether
          +0.30%
          1inch / Tether
          -1.83%
          AAVE / Tether
          +3.39%
          Acala / Tether
          -6.37%
          Fusionist / Tether
          -8.24%

          Today is a crucial day in the cryptocurrency market, as more than $14 billion worth of Bitcoin and Ethereum options are due to expire. Such a huge expiration may result in significant price changes and trading volumes. Currently, Bitcoin is trading at around $85,000, down by 3% from earlier this week.

          Market Reaction To Bitcoin, Ethereum Options Expiry

          Based on figures from Greeks.live, the aggregate options expiring today comprises 139,000 Bitcoin options worth about $12.1 billion. Another 301,000 Ethereum options worth about $2.13 billion are also expiring. The put-call ratios of these options stand at 0.49 for Bitcoin and 0.39 for Ethereum, reflecting differing degrees of trader sentiment.

          Greeks.live
          @GreeksLive

          28 Mar Options Data 139,000 BTC options are expiring with a Put Call Ratio of 0.49, a Maxpain point of $85,000 and a notional value of $12.1 billion. 301,000 ETH options are expiring with a Put Call Ratio of 0.39, a Maxpain point of $2,400 and a notional value of $2.13 billion.… pic.twitter.com/1zcEz3VBss

          Mar 28, 2025

          Understanding Max Pain Points

          Each quarter, options expirations such as today’s can cause substantial market movements. Market makers typically follow a strategy that has the effect of driving asset prices to what are referred to as max pain points. The max pain point for Bitcoin is $85,000, and that for Ethereum is $2,400. This approach may be the reason behind Bitcoin’s drop as traders respond to these technical points.

          Broader Market Sentiment

          Although the options expiration is the most prominent on everyone’s mind, other things are also affecting market dynamics. Media reports indicate that uncertainty over new tariffs by US President Donald Trump might be behind the downtrend in Bitcoin and the broader crypto space. Because of that, the effect of today’s options expiration is made more complex by outside market pressures. Challenges Ahead For Investors

          In the future, Greeks.live cautions that selling pressure is becoming more prevalent in the cryptocurrency market. Several investors might struggle to maneuver the challenges anticipated in the second quarter of 2025. In the absence of new catalysts that would push the prices higher, the market might have a bumpy ride ahead for the buyers to make profits.

          As the countdown begins to the expiration, investors and traders are monitoring closely. Today’s events can determine the shape of the market for weeks. With huge amounts of money at risk, the crypto community is preparing for volatility.

          In short, the expiry of more than $14 billion worth of Bitcoin and Ethereum options is set to send waves in the market. Traders are closely watching price action as different factors align, pointing to the intricacies of dealing with the cryptocurrency world.

          Featured image from Gemini Imagen, chart from TradingView

          Risk Warnings and Disclaimers
          You understand and acknowledge that there is a high degree of risk involved in trading. Following any strategies or investment methods may lead to potential losses. The content on the site is provided by our contributors and analysts for information purposes only. You are solely responsible for determining whether any trading assets, securities, strategy, or any other product is suitable for investing based on your own investment objectives and financial situation.
          Add to Favorites
          Share

          MultiversX (EGLD) - Andromeda Vote - From 28 Mar to 07 Apr 2025

          CoinMarketCal
          Bitcoin / Tether
          +0.30%
          1inch / Tether
          -1.83%
          AAVE / Tether
          +3.39%
          Acala / Tether
          -6.37%
          Fusionist / Tether
          -8.24%

          The Andromeda Vote for MultiversX (EGLD) is happening until April 7, 2025, following its testnet deployment. This proposal for a protocol upgrade (v1.9) could impact EGLD’s price as such improvements often drive interest and potential price increases. A favorable vote might boost community confidence and attract new investors looking for positive developments. Conversely, resistance or defeat of the proposal might yield the opposite effect. Traders should watch community sentiment during this period. For detailed information, please visit the source.

          Multiversᕽ
          @MultiversX

          1/ Andromeda: Testnet + Governance votehttps://t.co/YjfxFJu7gJ

          Following the public testnet deployment, the proposal for Andromeda (v1.9) protocol upgrade is live for voting.

          Open now to EGLD stakers, between Mar 28 - Apr 07. pic.twitter.com/VSmdP4WhJg

          Mar 28, 2025
          Risk Warnings and Disclaimers
          You understand and acknowledge that there is a high degree of risk involved in trading. Following any strategies or investment methods may lead to potential losses. The content on the site is provided by our contributors and analysts for information purposes only. You are solely responsible for determining whether any trading assets, securities, strategy, or any other product is suitable for investing based on your own investment objectives and financial situation.
          Add to Favorites
          Share

          STP (STPT) - Allo Launch Partner - 29 Mar 2025

          CoinMarketCal
          Bitcoin / Tether
          +0.30%
          1inch / Tether
          -1.83%
          AAVE / Tether
          +3.39%
          Acala / Tether
          -6.37%
          Fusionist / Tether
          -8.24%

          STP’s partnership with Allo for launching the Autonomous Worlds Engine on March 29, 2025, is promising due to its potential to enhance AI-driven applications and economic simulations. This collaboration could lead to advancements in tokenized worlds and onchain economies, possibly increasing STPT’s value through innovation. Such strategic partnerships may attract developers and investors intrigued by AI use in blockchain. However, without clear details on implementation success, the price impact might be speculative initially. To explore more about this partnership, see the source.

          STP
          @STP_Network

          STP x Allo

          We are proud to announce @allo_xyz as a launch partner for AWE (Autonomous Worlds Engine) to scale AI-driven Autonomous Worlds.

          Together, we will explore:

          • Running economic simulations around tokenized real-world assets

          • Empowering AI Agents to experiment with… pic.twitter.com/rnkITyYHCD

          Mar 29, 2025
          Risk Warnings and Disclaimers
          You understand and acknowledge that there is a high degree of risk involved in trading. Following any strategies or investment methods may lead to potential losses. The content on the site is provided by our contributors and analysts for information purposes only. You are solely responsible for determining whether any trading assets, securities, strategy, or any other product is suitable for investing based on your own investment objectives and financial situation.
          Add to Favorites
          Share

          BOB Token and Others - Bybit Delisting - 04 Apr 2025

          CoinMarketCal
          Bitcoin / Tether
          +0.30%
          1inch / Tether
          -1.83%
          AAVE / Tether
          +3.39%
          Acala / Tether
          -6.37%
          Fusionist / Tether
          -8.24%

          Bybit is delisting several coins, including BOB Token and DSRUN, which is set to occur on April 4, 2025. Delistings can cause price drops since they reduce accessibility for trading on a major platform. If a token loses significant trading volume, it can suffer decreased liquidity, making price recovery harder. Traders might sell off these tokens quickly to avoid holding an asset with fewer trading options. Thus, staying updated on follow-up announcements for any further trading support is crucial. For more details, check the source.

          Bybit
          @Bybit_Official

          DSRUN, SPARTA, PTU, VEXT, BOB and SEILOR Delisting from #BybitSpot!

          The Trading Pairs will be Delisted from the Bybit trading platform effective Apr 4, 8AM UTC and will no longer be supported.

          Learn More: https://t.co/tBj06I6rET#TheCryptoArk #BybitListing pic.twitter.com/ADKf76TqjO

          Mar 29, 2025
          Risk Warnings and Disclaimers
          You understand and acknowledge that there is a high degree of risk involved in trading. Following any strategies or investment methods may lead to potential losses. The content on the site is provided by our contributors and analysts for information purposes only. You are solely responsible for determining whether any trading assets, securities, strategy, or any other product is suitable for investing based on your own investment objectives and financial situation.
          Add to Favorites
          Share
          FastBull
          Copyright © 2025 FastBull Ltd

          728 RM B 7/F GEE LOK IND BLDG NO 34 HUNG TO RD KWUN TONG KLN HONG KONG

          TelegramInstagramTwitterfacebooklinkedin
          App Store Google Play Google Play
          Products
          Charts

          Chats

          Q&A with Experts
          Screeners
          Economic Calendar
          Data
          Tools
          Membership
          Features
          Function
          Markets
          Copy Trading
          Latest Signals
          Contests
          News
          Analysis
          24/7
          Columns
          Education
          Company
          Careers
          About Us
          Contact Us
          Advertising
          Help Center
          Feedback
          User Agreement
          Privacy Policy
          Business

          White Label

          Data API

          Web Plug-ins

          Poster Maker

          Affiliate Program

          Risk Disclosure

          The risk of loss in trading financial instruments such as stocks, FX, commodities, futures, bonds, ETFs and crypto can be substantial. You may sustain a total loss of the funds that you deposit with your broker. Therefore, you should carefully consider whether such trading is suitable for you in light of your circumstances and financial resources.

          No decision to invest should be made without thoroughly conducting due diligence by yourself or consulting with your financial advisors. Our web content might not suit you since we don't know your financial conditions and investment needs. Our financial information might have latency or contain inaccuracy, so you should be fully responsible for any of your trading and investment decisions. The company will not be responsible for your capital loss.

          Without getting permission from the website, you are not allowed to copy the website's graphics, texts, or trademarks. Intellectual property rights in the content or data incorporated into this website belong to its providers and exchange merchants.

          Not Logged In

          Log in to access more features

          FastBull Membership

          Not yet

          Purchase

          Become a signal provider
          Help Center
          Customer Service
          Dark Mode
          Price Up/Down Colors

          Log In

          Sign Up

          Position
          Layout
          Fullscreen
          Default to Chart
          The chart page opens by default when you visit fastbull.com