Markets
News
Analysis
User
24/7
Economic Calendar
Education
Data
- Names
- Latest
- Prev


Signal Accounts for Members
All Signal Accounts
All Contests


Japan Tankan Small Manufacturing Outlook Index (Q4)A:--
F: --
P: --
Japan Tankan Large Non-Manufacturing Outlook Index (Q4)A:--
F: --
P: --
Japan Tankan Large Manufacturing Outlook Index (Q4)A:--
F: --
P: --
Japan Tankan Small Manufacturing Diffusion Index (Q4)A:--
F: --
P: --
Japan Tankan Large Manufacturing Diffusion Index (Q4)A:--
F: --
P: --
Japan Tankan Large-Enterprise Capital Expenditure YoY (Q4)A:--
F: --
P: --
U.K. Rightmove House Price Index YoY (Dec)A:--
F: --
P: --
China, Mainland Industrial Output YoY (YTD) (Nov)A:--
F: --
P: --
China, Mainland Urban Area Unemployment Rate (Nov)A:--
F: --
P: --
Saudi Arabia CPI YoY (Nov)A:--
F: --
P: --
Euro Zone Industrial Output YoY (Oct)A:--
F: --
P: --
Euro Zone Industrial Output MoM (Oct)A:--
F: --
P: --
Canada Existing Home Sales MoM (Nov)A:--
F: --
P: --
Canada National Economic Confidence IndexA:--
F: --
P: --
Canada New Housing Starts (Nov)A:--
F: --
U.S. NY Fed Manufacturing Employment Index (Dec)A:--
F: --
P: --
U.S. NY Fed Manufacturing Index (Dec)A:--
F: --
P: --
Canada Core CPI YoY (Nov)A:--
F: --
P: --
Canada Manufacturing Unfilled Orders MoM (Oct)A:--
F: --
P: --
U.S. NY Fed Manufacturing Prices Received Index (Dec)A:--
F: --
P: --
U.S. NY Fed Manufacturing New Orders Index (Dec)A:--
F: --
P: --
Canada Manufacturing New Orders MoM (Oct)A:--
F: --
P: --
Canada Core CPI MoM (Nov)A:--
F: --
P: --
Canada Trimmed CPI YoY (SA) (Nov)A:--
F: --
P: --
Canada Manufacturing Inventory MoM (Oct)A:--
F: --
P: --
Canada CPI YoY (Nov)A:--
F: --
P: --
Canada CPI MoM (Nov)A:--
F: --
P: --
Canada CPI YoY (SA) (Nov)A:--
F: --
P: --
Canada Core CPI MoM (SA) (Nov)A:--
F: --
P: --
Canada CPI MoM (SA) (Nov)A:--
F: --
P: --
Federal Reserve Board Governor Milan delivered a speech
U.S. NAHB Housing Market Index (Dec)--
F: --
P: --
Australia Composite PMI Prelim (Dec)--
F: --
P: --
Australia Services PMI Prelim (Dec)--
F: --
P: --
Australia Manufacturing PMI Prelim (Dec)--
F: --
P: --
Japan Manufacturing PMI Prelim (SA) (Dec)--
F: --
P: --
U.K. 3-Month ILO Employment Change (Oct)--
F: --
P: --
U.K. Unemployment Claimant Count (Nov)--
F: --
P: --
U.K. Unemployment Rate (Nov)--
F: --
P: --
U.K. 3-Month ILO Unemployment Rate (Oct)--
F: --
P: --
U.K. Average Weekly Earnings (3-Month Average, Including Bonuses) YoY (Oct)--
F: --
P: --
U.K. Average Weekly Earnings (3-Month Average, Excluding Bonuses) YoY (Oct)--
F: --
P: --
France Services PMI Prelim (Dec)--
F: --
P: --
France Composite PMI Prelim (SA) (Dec)--
F: --
P: --
France Manufacturing PMI Prelim (Dec)--
F: --
P: --
Germany Services PMI Prelim (SA) (Dec)--
F: --
P: --
Germany Manufacturing PMI Prelim (SA) (Dec)--
F: --
P: --
Germany Composite PMI Prelim (SA) (Dec)--
F: --
P: --
Euro Zone Composite PMI Prelim (SA) (Dec)--
F: --
P: --
Euro Zone Services PMI Prelim (SA) (Dec)--
F: --
P: --
Euro Zone Manufacturing PMI Prelim (SA) (Dec)--
F: --
P: --
U.K. Services PMI Prelim (Dec)--
F: --
P: --
U.K. Manufacturing PMI Prelim (Dec)--
F: --
P: --
U.K. Composite PMI Prelim (Dec)--
F: --
P: --
Euro Zone ZEW Economic Sentiment Index (Dec)--
F: --
P: --
Germany ZEW Current Conditions Index (Dec)--
F: --
P: --
Germany ZEW Economic Sentiment Index (Dec)--
F: --
P: --
Euro Zone Trade Balance (Not SA) (Oct)--
F: --
P: --
Euro Zone ZEW Current Conditions Index (Dec)--
F: --
P: --
Euro Zone Trade Balance (SA) (Oct)--
F: --
P: --
U.S. Retail Sales MoM (Excl. Automobile) (SA) (Oct)--
F: --
P: --


No matching data
Latest Views
Latest Views
Trending Topics
Top Columnists
Latest Update
White Label
Data API
Web Plug-ins
Affiliate Program
View All

No data
As the craze of earnings season draws to a close, here’s a look back at some of the most exciting (and some less so) results from Q2. Today, we are looking at it distribution & solutions stocks, starting with ePlus .
IT Distribution & Solutions will be buoyed by the increasing complexity of IT ecosystems, rising cloud adoption, and demand for cybersecurity solutions. Enterprises are less likely than ever to embark on these complicated journeys solo, and companies in the sector boast expertise and scale in these areas. However, cloud migration also means less need for hardware, which could dent demand for large portions of the product portfolio and hurt margins. Additionally, planning for potentially supply chain disruptions is ongoing, as the COVID-19 pandemic showed how damaging a pause in global trade could be in areas like semiconductor procurement.
The 7 it distribution & solutions stocks we track reported a strong Q2. As a group, revenues beat analysts’ consensus estimates by 6.2% while next quarter’s revenue guidance was 0.5% below.
In light of this news, share prices of the companies have held steady as they are up 4.5% on average since the latest earnings results.
Starting as a financing company in 1990 before evolving into a full-service technology provider, ePlus provides comprehensive IT solutions, professional services, and financing options to help organizations optimize their technology infrastructure and supply chain processes.
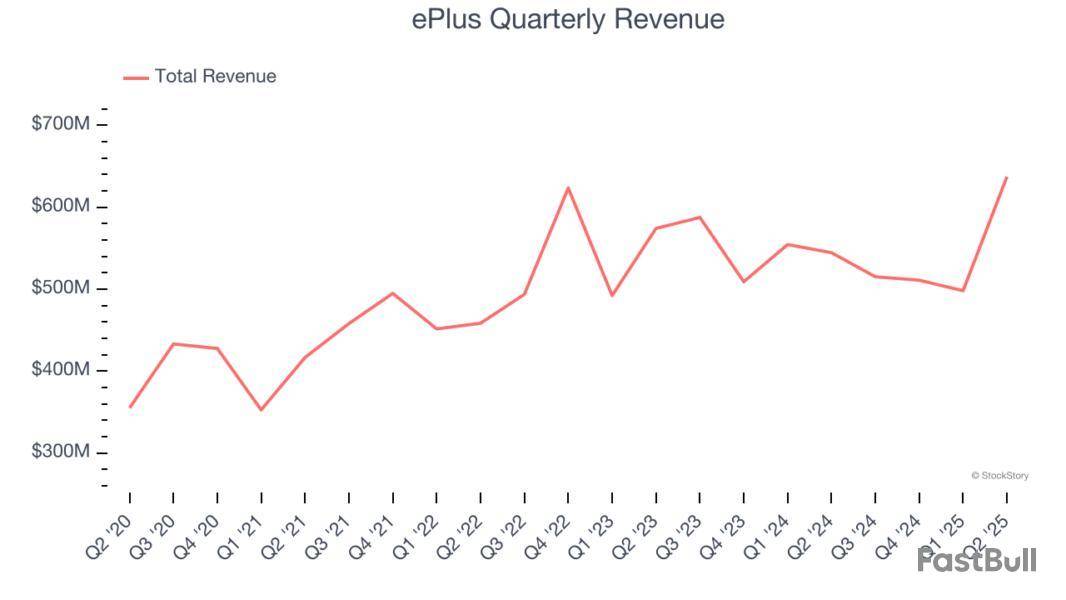
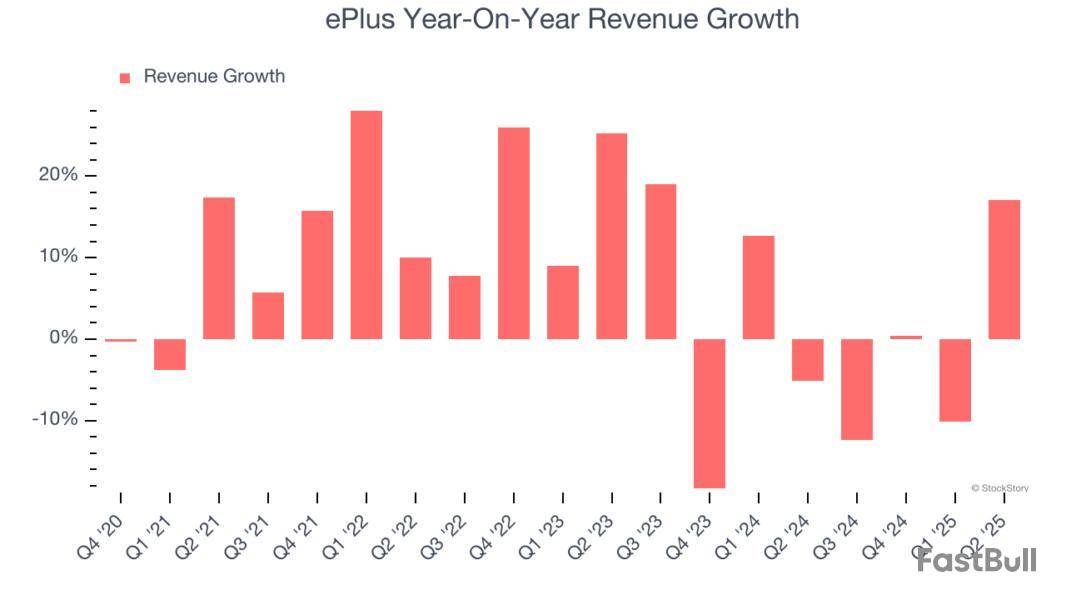
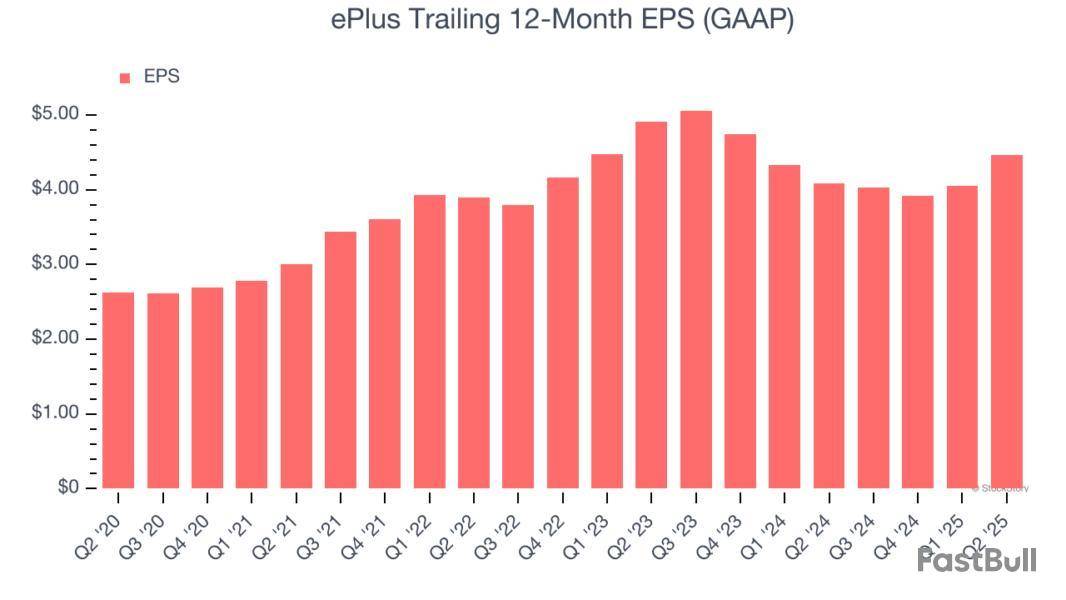
ePlus reported revenues of $637.3 million, up 19% year on year. This print exceeded analysts’ expectations by 23.3%. Overall, it was an incredible quarter for the company with a beat of analysts’ EPS estimates.
"Fiscal 2026 is off to a strong start both financially and strategically. We reported double digit growth across key financial metrics, including revenue, gross profit, and earnings per share. Our services business continues to be a standout, increasing nearly 50% in the quarter," commented Mark Marron, president and CEO of ePlus.
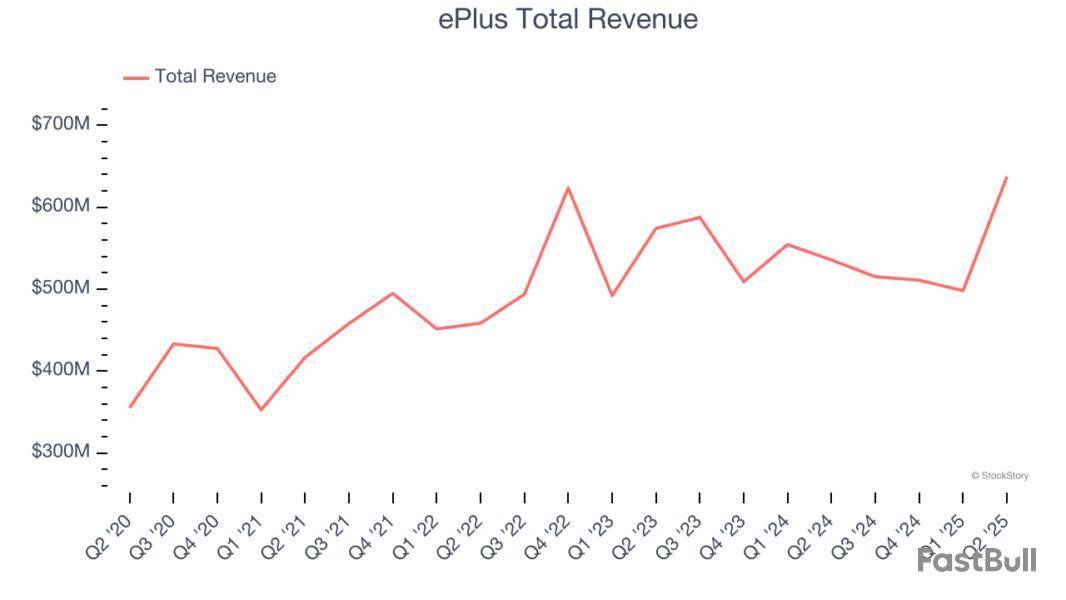
ePlus achieved the biggest analyst estimates beat and fastest revenue growth of the whole group. Unsurprisingly, the stock is up 16.1% since reporting and currently trades at $73.68.
Is now the time to buy ePlus? Access our full analysis of the earnings results here, it’s free.
Serving as a crucial bridge between technology manufacturers and end users since 1984, CDW is a multi-brand provider of information technology solutions that helps businesses and public sector organizations select, implement, and manage hardware, software, and IT services.
CDW reported revenues of $5.98 billion, up 10.2% year on year, outperforming analysts’ expectations by 7.8%. The business had a very strong quarter with a beat of analysts’ EPS estimates.
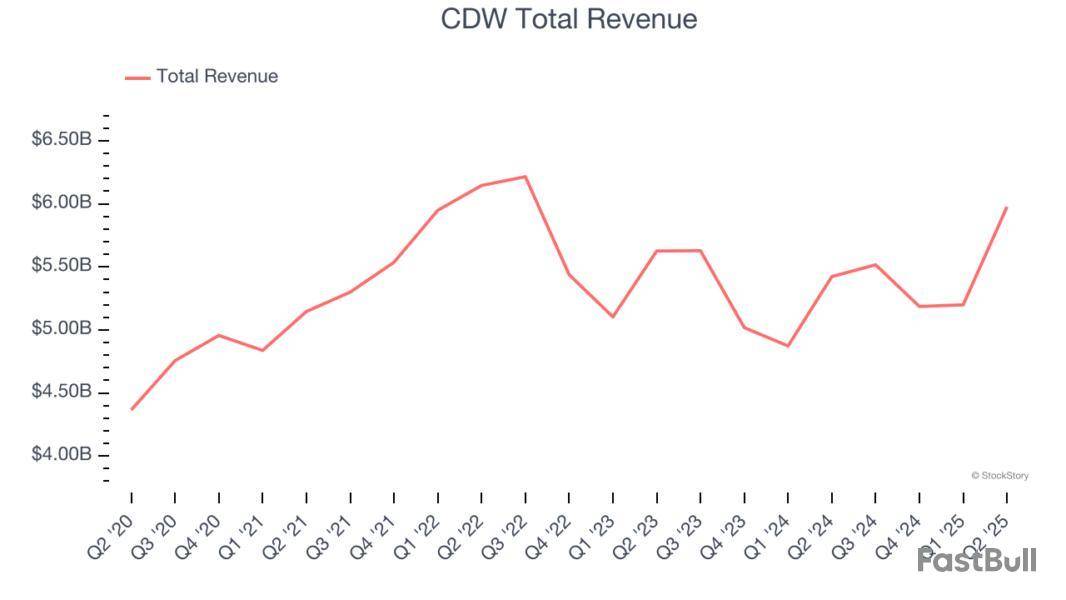
However, the results were likely priced into the stock as it’s traded sideways since reporting. Shares currently sit at $164.45.
Is now the time to buy CDW? Access our full analysis of the earnings results here, it’s free.
Weakest Q2: Insight Enterprises
With over 35 years of IT expertise and partnerships with more than 8,000 technology providers, Insight Enterprises provides end-to-end digital transformation solutions that help businesses modernize their IT infrastructure and maximize the value of technology.
Insight Enterprises reported revenues of $2.09 billion, down 3.2% year on year, falling short of analysts’ expectations by 2.4%. It was a slower quarter as it posted a miss of analysts’ EPS estimates.
Insight Enterprises delivered the weakest performance against analyst estimates and slowest revenue growth in the group. As expected, the stock is down 8.4% since the results and currently trades at $132.64.
Read our full analysis of Insight Enterprises’s results here.
Operating as the crucial link in the global technology supply chain with a presence in 57 countries, Ingram Micro is a global technology distributor that connects manufacturers with resellers, providing hardware, software, cloud services, and logistics expertise.
Ingram Micro reported revenues of $12.79 billion, up 10.9% year on year. This result beat analysts’ expectations by 6.4%. Taking a step back, it was a slower quarter as it recorded a significant miss of analysts’ EPS estimates and revenue guidance for next quarter slightly missing analysts’ expectations.
The stock is up 3.5% since reporting and currently trades at $19.49.
Read our full, actionable report on Ingram Micro here, it’s free.
With a century-long history of adapting to technological evolution, Avnet is a global electronic components distributor that connects manufacturers of semiconductors and other electronic parts with businesses that need these components.
Avnet reported revenues of $5.62 billion, flat year on year. This print topped analysts’ expectations by 4.5%. More broadly, it was a satisfactory quarter as it also logged a beat of analysts’ EPS estimates but a significant miss of analysts’ EPS guidance for next quarter estimates.
The stock is up 4.3% since reporting and currently trades at $54.11.
Read our full, actionable report on Avnet here, it’s free.
Market Update
The Fed’s interest rate hikes throughout 2022 and 2023 have successfully cooled post-pandemic inflation, bringing it closer to the 2% target. Inflationary pressures have eased without tipping the economy into a recession, suggesting a soft landing. This stability, paired with recent rate cuts (0.5% in September 2024 and 0.25% in November 2024), fueled a strong year for the stock market in 2024. The markets surged further after Donald Trump’s presidential victory in November, with major indices reaching record highs in the days following the election. Still, questions remain about the direction of economic policy, as potential tariffs and corporate tax changes add uncertainty for 2025.
What Happened?
A number of stocks jumped in the afternoon session after markets continued to rally as investor optimism grew for a potential Federal Reserve interest rate cut in September. This optimism was largely fueled by a recent consumer price index report that showed inflation easing, along with public comments from Treasury Secretary Scott Bessent advocating for a significant 50-basis-point rate cut. The prospect of lower borrowing costs tends to boost rate-sensitive sectors like Business Services, as it can encourage companies to increase spending on consulting, IT projects, and staffing.
The stock market overreacts to news, and big price drops can present good opportunities to buy high-quality stocks.
Among others, the following stocks were impacted:
Zooming In On Vimeo (VMEO)
Vimeo’s shares are somewhat volatile and have had 12 moves greater than 5% over the last year. In that context, today’s move indicates the market considers this news meaningful but not something that would fundamentally change its perception of the business.
The previous big move we wrote about was 8 days ago when the stock gained 8% on the news that the company reported strong second-quarter earnings that far surpassed analyst expectations. The video platform posted a profit of $0.04 per share, which was a significant beat compared to the loss Wall Street had anticipated. While total revenue was nearly flat year-over-year, investors latched onto key growth metrics. The company announced a 6% rise in total bookings, its highest in three years, driven by a 25% jump in revenue from its enterprise segment. This robust performance from corporate clients offset a decline in self-serve subscribers. Based on these results, Vimeo raised its full-year adjusted EBITDA guidance to $35 million.
Vimeo is down 37.2% since the beginning of the year, and at $4.07 per share, it is trading 44.4% below its 52-week high of $7.32 from December 2024. Investors who bought $1,000 worth of Vimeo’s shares at the IPO in May 2021 would now be looking at an investment worth $74.00.
Here at StockStory, we certainly understand the potential of thematic investing. Diverse winners from Microsoft (MSFT) to Alphabet (GOOG), Coca-Cola (KO) to Monster Beverage (MNST) could all have been identified as promising growth stories with a megatrend driving the growth. So, in that spirit, we’ve identified a relatively under-the-radar profitable growth stock benefiting from the rise of AI, available to you FREE via this link.
The stocks in this article have caught Wall Street’s attention in a big way, with price targets implying returns above 20%. But investors should take these forecasts with a grain of salt because analysts typically say nice things about companies so their firms can win business in other product lines like M&A advisory.
At StockStory, we look beyond the headlines with our independent analysis to determine whether these bullish calls are justified. Keeping that in mind, here are three stocks where Wall Street may be overlooking some important risks and some alternatives with better fundamentals.
Hyster-Yale Materials Handling (HY)
Consensus Price Target: $50 (34.8% implied return)
Playing a significant role in the development of the hydraulic lift truck, Hyster-Yale designs, manufactures, and sells materials handling equipment to various sectors.
Why Are We Out on HY?
Hyster-Yale Materials Handling’s stock price of $37.08 implies a valuation ratio of 5.9x forward EV-to-EBITDA. To fully understand why you should be careful with HY, check out our full research report (it’s free).
PAR Technology (PAR)
Consensus Price Target: $81.75 (70.3% implied return)
Originally founded in 1968 as a defense contractor for the U.S. government, PAR Technology provides cloud-based software, payment processing, and hardware solutions that help restaurants manage everything from point-of-sale to customer loyalty programs.
Why Are We Hesitant About PAR?
PAR Technology is trading at $48 per share, or 129.9x forward P/E. Read our free research report to see why you should think twice about including PAR in your portfolio.
ePlus (PLUS)
Consensus Price Target: $92 (27.6% implied return)
Starting as a financing company in 1990 before evolving into a full-service technology provider, ePlus provides comprehensive IT solutions, professional services, and financing options to help organizations optimize their technology infrastructure and supply chain processes.
Why Do We Pass on PLUS?
At $72.11 per share, ePlus trades at 14x forward EV-to-EBITDA. If you’re considering PLUS for your portfolio, see our FREE research report to learn more.
High-Quality Stocks for All Market Conditions
When Trump unveiled his aggressive tariff plan in April 2025, markets tanked as investors feared a full-blown trade war. But those who panicked and sold missed the subsequent rebound that’s already erased most losses.
Don’t let fear keep you from great opportunities and take a look at Top 9 Market-Beating Stocks. This is a curated list of our High Quality stocks that have generated a market-beating return of 183% over the last five years (as of March 31st 2025).
Stocks that made our list in 2020 include now familiar names such as Nvidia (+1,545% between March 2020 and March 2025) as well as under-the-radar businesses like the once-micro-cap company Tecnoglass (+1,754% five-year return).
StockStory is growing and hiring equity analyst and marketing roles. Are you a 0 to 1 builder passionate about the markets and AI? See the open roles here.
What Happened?
A number of stocks jumped in the afternoon session after a key inflation report met expectations, bolstering hopes for a Federal Reserve interest rate cut, while a separate report indicated rising optimism among small businesses. The July Consumer Price Index (CPI) report showed annual inflation holding steady at 2.7%, aligning with forecasts and increasing the probability of a Federal Reserve interest rate cut to over 94%. Lower interest rates can stimulate the economy by making it cheaper for businesses to borrow and invest.
Further boosting confidence, the National Federation of Independent Business (NFIB) Small Business Optimism Index rose to a five-month high. This is a crucial indicator for the Business Services sector, as many of its companies cater to small and medium-sized enterprises. The combined positive data fueled a broad, "risk-on" sentiment, where investors favor economically sensitive sectors, leading to gains across IT services, staffing, and manufacturing.
The stock market overreacts to news, and big price drops can present good opportunities to buy high-quality stocks.
Among others, the following stocks were impacted:
Zooming In On Insight Enterprises (NSIT)
Insight Enterprises’s shares are not very volatile and have only had 6 moves greater than 5% over the last year. In that context, today’s move indicates the market considers this news meaningful, although it might not be something that would fundamentally change its perception of the business.
Insight Enterprises is down 14% since the beginning of the year, and at $128.52 per share, it is trading 42.8% below its 52-week high of $224.73 from October 2024. Investors who bought $1,000 worth of Insight Enterprises’s shares 5 years ago would now be looking at an investment worth $2,319.
Here at StockStory, we certainly understand the potential of thematic investing. Diverse winners from Microsoft (MSFT) to Alphabet (GOOG), Coca-Cola (KO) to Monster Beverage (MNST) could all have been identified as promising growth stories with a megatrend driving the growth. So, in that spirit, we’ve identified a relatively under-the-radar profitable growth stock benefiting from the rise of AI, available to you FREE via this link.
What Happened?
Shares of IT solutions provider ePlus jumped 10.1% in the morning session after the company reported strong second-quarter 2025 results that significantly beat Wall Street's expectations for both revenue and profit. The company posted revenue of $637.3 million, up 17% year-on-year, which easily surpassed the analyst consensus of $516.7 million. The outperformance was even more pronounced on the bottom line, with GAAP earnings per share (EPS) of $1.43. This result was 55.4% higher than the consensus estimate of $0.92 and marked a substantial increase from the $1.02 reported in the same quarter of the previous year. This significant beat on key financial metrics demonstrated strong operational performance and boosted investor confidence.
Is now the time to buy ePlus? Access our full analysis report here, it’s free.
What Is The Market Telling Us
ePlus’s shares are not very volatile and have only had 7 moves greater than 5% over the last year. Moves this big are rare for ePlus and indicate this news significantly impacted the market’s perception of the business.
The previous big move we wrote about was 7 days ago when the stock dropped 3.1% on the news that a surprisingly weak U.S. jobs report was released, fueling concerns about a slowing economy. The U.S. economy added only 73,000 jobs, falling significantly short of economists' expectations, while figures for May and June were revised down, erasing 258,000 previously reported jobs. The professional and business services industry itself shed 14,000 jobs. This data points to a cooling labor market, fueling concerns of a slowing economy. A weaker economic outlook often leads to reduced corporate spending on key services like IT consulting and professional staffing, which directly impacts the sector's revenue and growth prospects. The report immediately increased investor expectations of an interest rate cut by the Federal Reserve.
ePlus is down 5.9% since the beginning of the year, and at $69.60 per share, it is trading 31.5% below its 52-week high of $101.67 from October 2024. Investors who bought $1,000 worth of ePlus’s shares 5 years ago would now be looking at an investment worth $1,780.
IT solutions provider ePlus reported Q2 CY2025 results beating Wall Street’s revenue expectations, with sales up 17% year on year to $637.3 million. Its GAAP profit of $1.43 per share was 55.4% above analysts’ consensus estimates.
Is now the time to buy ePlus? Find out by accessing our full research report, it’s free.
ePlus (PLUS) Q2 CY2025 Highlights:
"Fiscal 2026 is off to a strong start both financially and strategically. We reported double digit growth across key financial metrics, including revenue, gross profit, and earnings per share. Our services business continues to be a standout, increasing nearly 50% in the quarter," commented Mark Marron, president and CEO of ePlus.
Company Overview
Starting as a financing company in 1990 before evolving into a full-service technology provider, ePlus provides comprehensive IT solutions, professional services, and financing options to help organizations optimize their technology infrastructure and supply chain processes.
Revenue Growth
A company’s long-term sales performance is one signal of its overall quality. Any business can have short-term success, but a top-tier one grows for years.
With $2.16 billion in revenue over the past 12 months, ePlus is a mid-sized business services company, which sometimes brings disadvantages compared to larger competitors benefiting from better economies of scale. On the bright side, it can still flex high growth rates because it’s working from a smaller revenue base.
As you can see below, ePlus’s 7.4% annualized revenue growth over the last five years was solid. This shows it had high demand, a useful starting point for our analysis.
We at StockStory place the most emphasis on long-term growth, but within business services, a half-decade historical view may miss recent innovations or disruptive industry trends. ePlus’s recent performance shows its demand has slowed as its revenue was flat over the last two years.
This quarter, ePlus reported year-on-year revenue growth of 17%, and its $637.3 million of revenue exceeded Wall Street’s estimates by 23.3%.
Looking ahead, sell-side analysts expect revenue to grow 3.6% over the next 12 months. While this projection implies its newer products and services will spur better top-line performance, it is still below average for the sector.
Today’s young investors won’t have read the timeless lessons in Gorilla Game: Picking Winners In High Technology because it was written more than 20 years ago when Microsoft and Apple were first establishing their supremacy. But if we apply the same principles, then enterprise software stocks leveraging their own generative AI capabilities may well be the Gorillas of the future. So, in that spirit, we are excited to present our Special Free Report on a profitable, fast-growing enterprise software stock that is already riding the automation wave and looking to catch the generative AI next.
Operating Margin
Operating margin is an important measure of profitability as it shows the portion of revenue left after accounting for all core expenses – everything from the cost of goods sold to advertising and wages. It’s also useful for comparing profitability across companies with different levels of debt and tax rates because it excludes interest and taxes.
ePlus’s operating margin might fluctuated slightly over the last 12 months but has generally stayed the same, averaging 7.3% over the last five years. This profitability was paltry for a business services business and caused by its suboptimal cost structure.
Looking at the trend in its profitability, ePlus’s operating margin might fluctuated slightly but has generally stayed the same over the last five years. This raises questions about the company’s expense base because its revenue growth should have given it leverage on its fixed costs, resulting in better economies of scale and profitability.
This quarter, ePlus generated an operating margin profit margin of 5.7%, in line with the same quarter last year. This indicates the company’s overall cost structure has been relatively stable.
Earnings Per Share
Revenue trends explain a company’s historical growth, but the long-term change in earnings per share (EPS) points to the profitability of that growth – for example, a company could inflate its sales through excessive spending on advertising and promotions.
ePlus’s EPS grew at a remarkable 11.1% compounded annual growth rate over the last five years, higher than its 7.4% annualized revenue growth. However, this alone doesn’t tell us much about its business quality because its operating margin didn’t improve.
Like with revenue, we analyze EPS over a shorter period to see if we are missing a change in the business.
For ePlus, its two-year annual EPS declines of 4.7% mark a reversal from its (seemingly) healthy five-year trend. We hope ePlus can return to earnings growth in the future.
In Q2, ePlus reported EPS at $1.43, up from $1.02 in the same quarter last year. This print easily cleared analysts’ estimates, and shareholders should be content with the results. We also like to analyze expected EPS growth based on Wall Street analysts’ consensus projections, but there is insufficient data.
Key Takeaways from ePlus’s Q2 Results
We were impressed by how significantly ePlus blew past analysts’ EPS expectations this quarter. We were also excited its revenue outperformed Wall Street’s estimates by a wide margin. Zooming out, we think this quarter featured some important positives. The stock traded up 4% to $66.01 immediately following the results.
ePlus may have had a good quarter, but does that mean you should invest right now? When making that decision, it’s important to consider its valuation, business qualities, as well as what has happened in the latest quarter. We cover that in our actionable full research report which you can read here, it’s free.
White Label
Data API
Web Plug-ins
Poster Maker
Affiliate Program
The risk of loss in trading financial instruments such as stocks, FX, commodities, futures, bonds, ETFs and crypto can be substantial. You may sustain a total loss of the funds that you deposit with your broker. Therefore, you should carefully consider whether such trading is suitable for you in light of your circumstances and financial resources.
No decision to invest should be made without thoroughly conducting due diligence by yourself or consulting with your financial advisors. Our web content might not suit you since we don't know your financial conditions and investment needs. Our financial information might have latency or contain inaccuracy, so you should be fully responsible for any of your trading and investment decisions. The company will not be responsible for your capital loss.
Without getting permission from the website, you are not allowed to copy the website's graphics, texts, or trademarks. Intellectual property rights in the content or data incorporated into this website belong to its providers and exchange merchants.
Not Logged In
Log in to access more features

FastBull Membership
Not yet
Purchase
Log In
Sign Up