• Trade
  • Markets
  • Copy
  • Contests
  • News
  • 24/7
  • Calendar
  • Q&A
  • Chats
Trending
Screeners
SYMBOL
LAST
BID
ASK
HIGH
LOW
NET CHG.
%CHG.
SPREAD
SPX
S&P 500 Index
6827.42
6827.42
6827.42
6899.86
6801.80
-73.58
-1.07%
--
DJI
Dow Jones Industrial Average
48458.04
48458.04
48458.04
48886.86
48334.10
-245.98
-0.51%
--
IXIC
NASDAQ Composite Index
23195.16
23195.16
23195.16
23554.89
23094.51
-398.69
-1.69%
--
USDX
US Dollar Index
97.920
98.000
97.920
98.070
97.810
-0.030
-0.03%
--
EURUSD
Euro / US Dollar
1.17446
1.17453
1.17446
1.17596
1.17262
+0.00052
+ 0.04%
--
GBPUSD
Pound Sterling / US Dollar
1.33843
1.33853
1.33843
1.33961
1.33546
+0.00136
+ 0.10%
--
XAUUSD
Gold / US Dollar
4331.76
4332.17
4331.76
4350.16
4294.68
+32.37
+ 0.75%
--
WTI
Light Sweet Crude Oil
56.842
56.872
56.842
57.601
56.789
-0.391
-0.68%
--

Community Accounts

Signal Accounts
--
Profit Accounts
--
Loss Accounts
--
View More

Become a signal provider

Sell trading signals to earn additional income

View More

Guide to Copy Trading

Get started with ease and confidence

View More

Signal Accounts for Members

All Signal Accounts

Best Return
  • Best Return
  • Best P/L
  • Best MDD
Past 1W
  • Past 1W
  • Past 1M
  • Past 1Y

All Contests

  • All
  • Trump Updates
  • Recommend
  • Stocks
  • Cryptocurrencies
  • Central Banks
  • Featured News
Top News Only
Share

Portugal Treasury Expects 2026 Net Financing Needs At 29.4 Billion Euros, Up From 25.8 Billion In 2025

Share

Bank Of America Says With Indonesia's Smelter Now Ramping Up, It Expects Aluminium Supply Growth To Accelerate To 2.6% Year On Year In 2026

Share

Bank Of America Expects A Deficit In Aluminium Next Year And Sees Prices Pushing Above $3000/T

Share

Fed Data - USA Effective Federal Funds Rate At 3.64 Percent On 12 December On $102 Billion In Trades Versus 3.64 Percent On $99 Billion On 11 December

Share

Brazil's Petrobras Says No Impact Seen On Oil, Petroleum Products Output As Workers Start Planned Strike

Share

Statement: US Travel Group Warns New Proposed Trump Administration Requirements For Foreign Tourists To Provide Social Media Histories Could Mean Millions Of People Opting Not To Visit

Share

Blackrock: Kerry White Will Become Head Of Citi Investment Management At Citi Wealth

Share

Blackrock: Rob Jasminski, Head Of Citi Investment Management, Has Joined With Team

Share

Blackrock: Effective Dec 15, Citi Investment Management Employees Will Join Blackrock

Share

Blackrock: Formally Launch Citi Portfolio Solutions Powered By Blackrock

Share

According To Data From The Federal Reserve Bank Of New York, The Secured Overnight Funding Rate (Sofr) Was 3.67% On The Previous Trading Day (December 15), Compared To 3.66% The Day Before

Share

Peru Energy And Mines Ministry: Copper Production Up 4.8% Year-On-Year In October To 248192 Metric Tons

Share

Security Source: Ukrainian Drones Hits Russian Oil Infrastructure In Caspian Sea For Third Time

Share

Spot Palladium Extends Gains, Last Up 5% To $1562.7/Oz

Share

Mexico's Economy Ministry Announces Start Of Anti-Dumping Investigation And Anti-Subsidy Investigations Into USA Pork Imports

Share

Canada Nov CPI Common +2.8%, CPI Median +2.8%, CPI Trim +2.8% On Year

Share

NY Fed's Empire State Prices Paid Index +37.6 In December Versus+49.0 In November

Share

Canada Nov Consumer Prices +0.1% On Month, +2.2% On Year

Share

Canada Nov CPI Core -0.1% On Month, +2.9% On Year

Share

Canada Nov Core CPI, Seasonally Adjusted +0.2% On Month, Oct +0.3% (Unrevised)

TIME
ACT
FCST
PREV
Japan Tankan Small Manufacturing Outlook Index (Q4)

A:--

F: --

P: --

Japan Tankan Large Non-Manufacturing Outlook Index (Q4)

A:--

F: --

P: --

Japan Tankan Large Manufacturing Outlook Index (Q4)

A:--

F: --

P: --

Japan Tankan Small Manufacturing Diffusion Index (Q4)

A:--

F: --

P: --

Japan Tankan Large Manufacturing Diffusion Index (Q4)

A:--

F: --

P: --

Japan Tankan Large-Enterprise Capital Expenditure YoY (Q4)

A:--

F: --

P: --

U.K. Rightmove House Price Index YoY (Dec)

A:--

F: --

P: --

China, Mainland Industrial Output YoY (YTD) (Nov)

A:--

F: --

P: --

China, Mainland Urban Area Unemployment Rate (Nov)

A:--

F: --

P: --

Saudi Arabia CPI YoY (Nov)

A:--

F: --

P: --

Euro Zone Industrial Output YoY (Oct)

A:--

F: --

P: --

Euro Zone Industrial Output MoM (Oct)

A:--

F: --

P: --

Canada Existing Home Sales MoM (Nov)

A:--

F: --

P: --

Canada National Economic Confidence Index

A:--

F: --

P: --

Canada New Housing Starts (Nov)

A:--

F: --

P: --
U.S. NY Fed Manufacturing Employment Index (Dec)

A:--

F: --

P: --

U.S. NY Fed Manufacturing Index (Dec)

A:--

F: --

P: --

Canada Core CPI YoY (Nov)

A:--

F: --

P: --

Canada Manufacturing Unfilled Orders MoM (Oct)

A:--

F: --

P: --

U.S. NY Fed Manufacturing Prices Received Index (Dec)

A:--

F: --

P: --

U.S. NY Fed Manufacturing New Orders Index (Dec)

A:--

F: --

P: --

Canada Manufacturing New Orders MoM (Oct)

A:--

F: --

P: --

Canada Core CPI MoM (Nov)

A:--

F: --

P: --

Canada Trimmed CPI YoY (SA) (Nov)

A:--

F: --

P: --

Canada Manufacturing Inventory MoM (Oct)

A:--

F: --

P: --

Canada CPI YoY (Nov)

A:--

F: --

P: --

Canada CPI MoM (Nov)

A:--

F: --

P: --

Canada CPI YoY (SA) (Nov)

A:--

F: --

P: --

Canada Core CPI MoM (SA) (Nov)

A:--

F: --

P: --

Canada CPI MoM (SA) (Nov)

A:--

F: --

P: --

Federal Reserve Board Governor Milan delivered a speech
U.S. NAHB Housing Market Index (Dec)

--

F: --

P: --

Australia Composite PMI Prelim (Dec)

--

F: --

P: --

Australia Services PMI Prelim (Dec)

--

F: --

P: --

Australia Manufacturing PMI Prelim (Dec)

--

F: --

P: --

Japan Manufacturing PMI Prelim (SA) (Dec)

--

F: --

P: --

U.K. 3-Month ILO Employment Change (Oct)

--

F: --

P: --

U.K. Unemployment Claimant Count (Nov)

--

F: --

P: --

U.K. Unemployment Rate (Nov)

--

F: --

P: --

U.K. 3-Month ILO Unemployment Rate (Oct)

--

F: --

P: --

U.K. Average Weekly Earnings (3-Month Average, Including Bonuses) YoY (Oct)

--

F: --

P: --

U.K. Average Weekly Earnings (3-Month Average, Excluding Bonuses) YoY (Oct)

--

F: --

P: --

France Services PMI Prelim (Dec)

--

F: --

P: --

France Composite PMI Prelim (SA) (Dec)

--

F: --

P: --

France Manufacturing PMI Prelim (Dec)

--

F: --

P: --

Germany Services PMI Prelim (SA) (Dec)

--

F: --

P: --

Germany Manufacturing PMI Prelim (SA) (Dec)

--

F: --

P: --

Germany Composite PMI Prelim (SA) (Dec)

--

F: --

P: --

Euro Zone Composite PMI Prelim (SA) (Dec)

--

F: --

P: --

Euro Zone Services PMI Prelim (SA) (Dec)

--

F: --

P: --

Euro Zone Manufacturing PMI Prelim (SA) (Dec)

--

F: --

P: --

U.K. Services PMI Prelim (Dec)

--

F: --

P: --

U.K. Manufacturing PMI Prelim (Dec)

--

F: --

P: --

U.K. Composite PMI Prelim (Dec)

--

F: --

P: --

Euro Zone ZEW Economic Sentiment Index (Dec)

--

F: --

P: --

Germany ZEW Current Conditions Index (Dec)

--

F: --

P: --

Germany ZEW Economic Sentiment Index (Dec)

--

F: --

P: --

Euro Zone Trade Balance (Not SA) (Oct)

--

F: --

P: --

Euro Zone ZEW Current Conditions Index (Dec)

--

F: --

P: --

Euro Zone Trade Balance (SA) (Oct)

--

F: --

P: --

U.S. Retail Sales MoM (Excl. Automobile) (SA) (Oct)

--

F: --

P: --

Q&A with Experts
    • All
    • Chatrooms
    • Groups
    • Friends
    Connecting
    .
    .
    .
    Type here...
    Add Symbol or Code

      No matching data

      All
      Trump Updates
      Recommend
      Stocks
      Cryptocurrencies
      Central Banks
      Featured News
      • All
      • Russia-Ukraine Conflict
      • Middle East Flashpoint
      • All
      • Russia-Ukraine Conflict
      • Middle East Flashpoint
      Search
      Products

      Charts Free Forever

      Chats Q&A with Experts
      Screeners Economic Calendar Data Tools
      Membership Features
      Data Warehouse Market Trends Institutional Data Policy Rates Macro

      Market Trends

      Market Sentiment Order Book Forex Correlations

      Top Indicators

      Charts Free Forever
      Markets

      News

      News Analysis 24/7 Columns Education
      From Institutions From Analysts
      Topics Columnists

      Latest Views

      Latest Views

      Trending Topics

      Top Columnists

      Latest Update

      Signals

      Copy Rankings Latest Signals Become a signal provider AI Rating
      Contests
      Brokers

      Overview Brokers Assessment Rankings Regulators News Claims
      Broker listing Forex Brokers Comparison Tool Live Spread Comparison Scam
      Q&A Complaint Scam Alert Videos Tips to Detect Scam
      More

      Business
      Events
      Careers About Us Advertising Help Center

      White Label

      Data API

      Web Plug-ins

      Affiliate Program

      Awards Institution Evaluation IB Seminar Salon Event Exhibition
      Vietnam Thailand Singapore Dubai
      Fans Party Investment Sharing Session
      FastBull Summit BrokersView Expo
      Recent Searches
        Top Searches
          Markets
          News
          Analysis
          User
          24/7
          Economic Calendar
          Education
          Data
          • Names
          • Latest
          • Prev

          View All

          No data

          Scan to Download

          Faster Charts, Chat Faster!

          Download App
          English
          • English
          • Español
          • العربية
          • Bahasa Indonesia
          • Bahasa Melayu
          • Tiếng Việt
          • ภาษาไทย
          • Français
          • Italiano
          • Türkçe
          • Русский язык
          • 简中
          • 繁中
          Open Account
          Search
          Products
          Charts Free Forever
          Markets
          News
          Signals

          Copy Rankings Latest Signals Become a signal provider AI Rating
          Contests
          Brokers

          Overview Brokers Assessment Rankings Regulators News Claims
          Broker listing Forex Brokers Comparison Tool Live Spread Comparison Scam
          Q&A Complaint Scam Alert Videos Tips to Detect Scam
          More

          Business
          Events
          Careers About Us Advertising Help Center

          White Label

          Data API

          Web Plug-ins

          Affiliate Program

          Awards Institution Evaluation IB Seminar Salon Event Exhibition
          Vietnam Thailand Singapore Dubai
          Fans Party Investment Sharing Session
          FastBull Summit BrokersView Expo

          Dj Vp Yates Sells 9672 Of Natures Sunshine Products Inc >Natr

          Reuters
          Natures Sunshine Products
          +2.57%
          Risk Warnings and Disclaimers
          You understand and acknowledge that there is a high degree of risk involved in trading. Following any strategies or investment methods may lead to potential losses. The content on the site is provided by our contributors and analysts for information purposes only. You are solely responsible for determining whether any trading assets, securities, strategy, or any other product is suitable for investing based on your own investment objectives and financial situation.
          Add to Favorites
          Share

          3 Reasons to Sell NATR and 1 Stock to Buy Instead

          Stock Story
          Natures Sunshine Products
          +2.57%

          NATR Cover Image

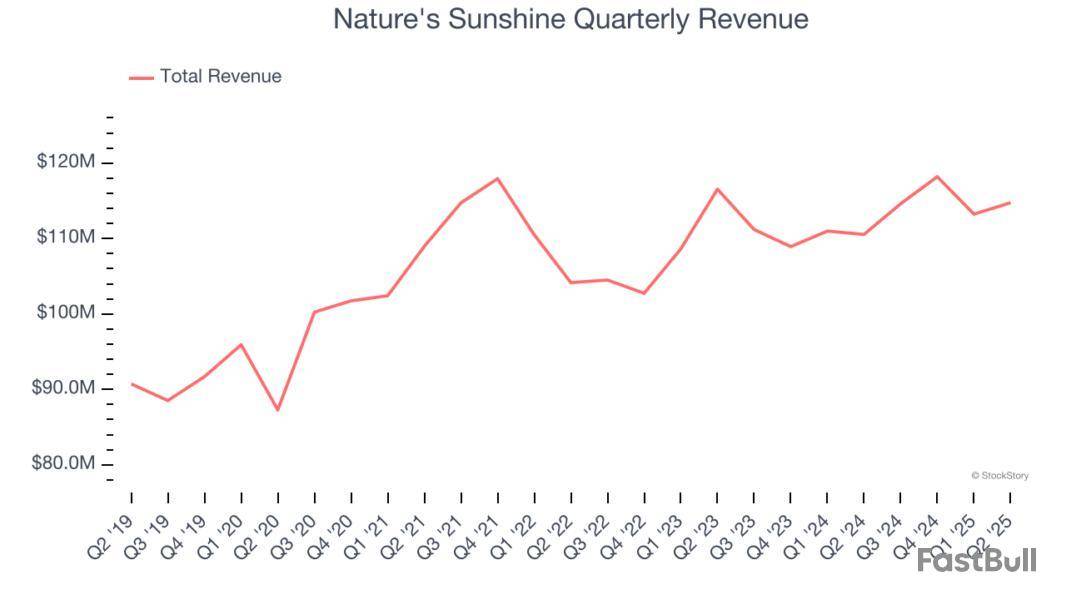
          Nature's Sunshine has had an impressive run over the past six months as its shares have beaten the S&P 500 by 8.4%. The stock now trades at $17.22, marking a 20% gain. This was partly due to its solid quarterly results, and the performance may have investors wondering how to approach the situation.

          Is there a buying opportunity in Nature's Sunshine, or does it present a risk to your portfolio? See what our analysts have to say in our full research report, it’s free.

          Why Is Nature's Sunshine Not Exciting?

          We’re glad investors have benefited from the price increase, but we're sitting this one out for now. Here are three reasons why NATR doesn't excite us and a stock we'd rather own.

          1. Long-Term Revenue Growth Flatter Than a Pancake

          A company’s long-term sales performance can indicate its overall quality. Any business can have short-term success, but a top-tier one grows for years. Unfortunately, Nature's Sunshine struggled to consistently increase demand as its $460.8 million of sales for the trailing 12 months was close to its revenue three years ago. This was below our standards and signals it’s a lower quality business.

          Nature's Sunshine Quarterly Revenue

          2. Fewer Distribution Channels Limit its Ceiling

          With $460.8 million in revenue over the past 12 months, Nature's Sunshine is a small consumer staples company, which sometimes brings disadvantages compared to larger competitors benefiting from economies of scale and negotiating leverage with retailers.

          3. Projected Revenue Growth Is Slim

          Forecasted revenues by Wall Street analysts signal a company’s potential. Predictions may not always be accurate, but accelerating growth typically boosts valuation multiples and stock prices while slowing growth does the opposite.

          Over the next 12 months, sell-side analysts expect Nature's Sunshine’s revenue to rise by 1.3%, close to This projection is underwhelming and indicates its newer products will not catalyze better top-line performance yet.

          Final Judgment

          Nature's Sunshine isn’t a terrible business, but it doesn’t pass our bar. With its shares beating the market recently, the stock trades at 21.6× forward P/E (or $17.22 per share). Investors with a higher risk tolerance might like the company, but we think the potential downside is too great. We're pretty confident there are more exciting stocks to buy at the moment. We’d recommend looking at the most dominant software business in the world.

          High-Quality Stocks for All Market Conditions

          Trump’s April 2025 tariff bombshell triggered a massive market selloff, but stocks have since staged an impressive recovery, leaving those who panic sold on the sidelines.

          Take advantage of the rebound by checking out our Top 9 Market-Beating Stocks. This is a curated list of our High Quality stocks that have generated a market-beating return of 183% over the last five years (as of March 31st 2025).

          Stocks that made our list in 2020 include now familiar names such as Nvidia (+1,545% between March 2020 and March 2025) as well as under-the-radar businesses like the once-small-cap company Comfort Systems (+782% five-year return).

          StockStory is growing and hiring equity analyst and marketing roles. Are you a 0 to 1 builder passionate about the markets and AI? See the open roles here.

          Risk Warnings and Disclaimers
          You understand and acknowledge that there is a high degree of risk involved in trading. Following any strategies or investment methods may lead to potential losses. The content on the site is provided by our contributors and analysts for information purposes only. You are solely responsible for determining whether any trading assets, securities, strategy, or any other product is suitable for investing based on your own investment objectives and financial situation.
          Add to Favorites
          Share

          3 Consumer Stocks with Warning Signs

          Stock Story
          JM Smucker
          +0.65%
          Natures Sunshine Products
          +2.57%
          Fresh Del Monte Produce
          -0.26%

          SJM Cover Image

          Consumer staples stocks are solid insurance policies in frothy markets ripe for corrections. The flip side is that they frequently fall behind growth industries when times are good, and this was the reality over the past six months as the sector’s flat performance trailed the S&P 500’s 10.5% gain.

          Given the low switching costs of basic goods like paper towels, many companies will continue generating poor results while only a handful will shine. Taking that into account, here are three consumer stocks that may face trouble.

          J. M. Smucker (SJM)

          Market Cap: $11.79 billion

          Best known for its fruit jams and spreads, J.M Smucker is a packaged foods company whose products span from peanut butter and coffee to pet food.

          Why Do We Steer Clear of SJM?

          • Absence of organic revenue growth over the past two years suggests it may have to lean into acquisitions to drive its expansion
          • Efficiency has decreased over the last year as its operating margin fell by 27.1 percentage points
          • ROIC of 2.2% reflects management’s challenges in identifying attractive investment opportunities, and its falling returns suggest its earlier profit pools are drying up

          J. M. Smucker is trading at $110.74 per share, or 11.7x forward P/E. To fully understand why you should be careful with SJM, check out our full research report (it’s free).

          Nature's Sunshine (NATR)

          Market Cap: $297.2 million

          Started on a kitchen table in Utah, Nature’s Sunshine manufactures and sells nutritional and personal care products.

          Why Does NATR Worry Us?

          • Sales stagnated over the last three years and signal the need for new growth strategies
          • Modest revenue base of $460.8 million gives it less fixed cost leverage and fewer distribution channels than larger companies
          • Estimated sales growth of 1.3% for the next 12 months is soft and implies weaker demand

          Nature's Sunshine’s stock price of $16.52 implies a valuation ratio of 21.1x forward P/E. Read our free research report to see why you should think twice about including NATR in your portfolio.

          Fresh Del Monte Produce (FDP)

          Market Cap: $1.74 billion

          Translating to "of the mountain" in Spanish, Fresh Del Monte is a leader in providing high-quality, sustainably grown fresh fruits and vegetables.

          Why Do We Think FDP Will Underperform?

          • Products fail to spark excitement with consumers, as seen in its flat sales over the last three years
          • Commoditized products, bad unit economics, and high competition are reflected in its low gross margin of 8.3%
          • Underwhelming 5.4% return on capital reflects management’s difficulties in finding profitable growth opportunities

          At $36.28 per share, Fresh Del Monte Produce trades at 16x forward EV-to-EBITDA. Dive into our free research report to see why there are better opportunities than FDP.

          High-Quality Stocks for All Market Conditions

          Trump’s April 2025 tariff bombshell triggered a massive market selloff, but stocks have since staged an impressive recovery, leaving those who panic sold on the sidelines.

          Take advantage of the rebound by checking out our Top 9 Market-Beating Stocks. This is a curated list of our High Quality stocks that have generated a market-beating return of 183% over the last five years (as of March 31st 2025).

          Stocks that made our list in 2020 include now familiar names such as Nvidia (+1,545% between March 2020 and March 2025) as well as under-the-radar businesses like the once-small-cap company Exlservice (+354% five-year return).

          StockStory is growing and hiring equity analyst and marketing roles. Are you a 0 to 1 builder passionate about the markets and AI? See the open roles here.

          Risk Warnings and Disclaimers
          You understand and acknowledge that there is a high degree of risk involved in trading. Following any strategies or investment methods may lead to potential losses. The content on the site is provided by our contributors and analysts for information purposes only. You are solely responsible for determining whether any trading assets, securities, strategy, or any other product is suitable for investing based on your own investment objectives and financial situation.
          Add to Favorites
          Share

          3 Cash-Producing Stocks with Questionable Fundamentals

          Stock Story
          Natures Sunshine Products
          +2.57%
          Kadant
          -0.80%
          Richardson Electronics
          -2.92%

          NATR Cover Image

          While strong cash flow is a key indicator of stability, it doesn’t always translate to superior returns. Some cash-heavy businesses struggle with inefficient spending, slowing demand, or weak competitive positioning.

          Luckily for you, we built StockStory to help you separate the good from the bad. Keeping that in mind, here are three cash-producing companies to avoid and some better opportunities instead.

          Nature's Sunshine (NATR)

          Trailing 12-Month Free Cash Flow Margin: 4.9%

          Started on a kitchen table in Utah, Nature’s Sunshine manufactures and sells nutritional and personal care products.

          Why Are We Cautious About NATR?

          • Products fail to spark excitement with consumers, as seen in its flat sales over the last three years
          • Smaller revenue base of $460.8 million means it hasn’t achieved the economies of scale that some industry juggernauts enjoy
          • Demand will likely be soft over the next 12 months as Wall Street’s estimates imply tepid growth of 1.3%

          At $16.40 per share, Nature's Sunshine trades at 20.6x forward P/E. Read our free research report to see why you should think twice about including NATR in your portfolio.

          Kadant (KAI)

          Trailing 12-Month Free Cash Flow Margin: 14.7%

          Headquartered in Massachusetts, Kadant is a global supplier of high-value, critical components and engineered systems used in process industries worldwide.

          Why Does KAI Fall Short?

          • Sales trends were unexciting over the last two years as its 4.9% annual growth was below the typical industrials company
          • Estimated sales growth of 3.1% for the next 12 months implies demand will slow from its two-year trend
          • Earnings per share were flat over the last two years and fell short of the peer group average

          Kadant’s stock price of $340.90 implies a valuation ratio of 36.3x forward P/E. To fully understand why you should be careful with KAI, check out our full research report (it’s free).

          Richardson Electronics (RELL)

          Trailing 12-Month Free Cash Flow Margin: 3.7%

          Founded in 1947, Richardson Electronics is a distributor of power grid and microwave tubes as well as consumables related to those products.

          Why Should You Dump RELL?

          • Customers postponed purchases of its products and services this cycle as its revenue declined by 10.8% annually over the last two years
          • Lacking free cash flow generation means it has few chances to reinvest for growth, repurchase shares, or distribute capital
          • Diminishing returns on capital from an already low starting point show that neither management’s prior nor current bets are going as planned

          Richardson Electronics is trading at $10.03 per share, or 250.5x forward P/E. Dive into our free research report to see why there are better opportunities than RELL.

          High-Quality Stocks for All Market Conditions

          When Trump unveiled his aggressive tariff plan in April 2025, markets tanked as investors feared a full-blown trade war. But those who panicked and sold missed the subsequent rebound that’s already erased most losses.

          Don’t let fear keep you from great opportunities and take a look at Top 5 Growth Stocks for this month. This is a curated list of our High Quality stocks that have generated a market-beating return of 183% over the last five years (as of March 31st 2025).

          Stocks that made our list in 2020 include now familiar names such as Nvidia (+1,545% between March 2020 and March 2025) as well as under-the-radar businesses like the once-small-cap company Exlservice (+354% five-year return).

          StockStory is growing and hiring equity analyst and marketing roles. Are you a 0 to 1 builder passionate about the markets and AI? See the open roles here.

          Risk Warnings and Disclaimers
          You understand and acknowledge that there is a high degree of risk involved in trading. Following any strategies or investment methods may lead to potential losses. The content on the site is provided by our contributors and analysts for information purposes only. You are solely responsible for determining whether any trading assets, securities, strategy, or any other product is suitable for investing based on your own investment objectives and financial situation.
          Add to Favorites
          Share

          Dj Nature's Sunshine Products In, Inst Holders, 2Q 2025 (Natr)

          Reuters
          Natures Sunshine Products
          +2.57%
          Risk Warnings and Disclaimers
          You understand and acknowledge that there is a high degree of risk involved in trading. Following any strategies or investment methods may lead to potential losses. The content on the site is provided by our contributors and analysts for information purposes only. You are solely responsible for determining whether any trading assets, securities, strategy, or any other product is suitable for investing based on your own investment objectives and financial situation.
          Add to Favorites
          Share

          3 Small-Cap Stocks Walking a Fine Line

          Stock Story
          Natures Sunshine Products
          +2.57%
          REV Group
          -2.16%
          GoodRx
          +1.08%

          NATR Cover Image

          Small-cap stocks can be incredibly lucrative investments because their lack of analyst coverage leads to frequent mispricings. However, these businesses (and their stock prices) often stay small because their subscale operations make it harder to expand their competitive moats.

          Luckily for you, our mission at StockStory is to help you make money and avoid losses by sorting the winners from the losers. Keeping that in mind, here are three small-cap stocks to swipe left on and some alternatives you should look into instead.

          Nature's Sunshine (NATR)

          Market Cap: $291.7 million

          Started on a kitchen table in Utah, Nature’s Sunshine manufactures and sells nutritional and personal care products.

          Why Are We Cautious About NATR?

          • Sales stagnated over the last three years and signal the need for new growth strategies
          • Subscale operations are evident in its revenue base of $460.8 million, meaning it has fewer distribution channels than its larger rivals
          • Demand will likely be soft over the next 12 months as Wall Street’s estimates imply tepid growth of 1.3%

          At $16.54 per share, Nature's Sunshine trades at 20.9x forward P/E. Read our free research report to see why you should think twice about including NATR in your portfolio.

          REV Group (REVG)

          Market Cap: $2.55 billion

          Offering the first full-electric North American fire truck, REV manufactures and sells specialty vehicles.

          Why Is REVG Not Exciting?

          • Flat sales over the last five years suggest it must find different ways to grow during this cycle
          • Gross margin of 12% is below its competitors, leaving less money to invest in areas like marketing and R&D
          • Poor expense management has led to an operating margin of 3% that is below the industry average

          REV Group is trading at $52.31 per share, or 18.7x forward P/E. Dive into our free research report to see why there are better opportunities than REVG.

          GoodRx (GDRX)

          Market Cap: $1.30 billion

          Started in 2011 to tackle the problem of high prescription drug costs in America, GoodRx operates a digital platform that helps consumers find lower prices on prescription medications through price comparison tools and discount codes.

          Why Do We Avoid GDRX?

          • Customer additions have disappointed over the past two years, indicating the company’s value proposition may not be resonating
          • Smaller revenue base of $799.9 million means it hasn’t achieved the economies of scale that some industry juggernauts enjoy
          • Push for growth has led to negative returns on capital, signaling value destruction

          GoodRx’s stock price of $3.75 implies a valuation ratio of 8.9x forward P/E. If you’re considering GDRX for your portfolio, see our FREE research report to learn more.

          Stocks We Like More

          Trump’s April 2025 tariff bombshell triggered a massive market selloff, but stocks have since staged an impressive recovery, leaving those who panic sold on the sidelines.

          Take advantage of the rebound by checking out our Top 6 Stocks for this week. This is a curated list of our High Quality stocks that have generated a market-beating return of 183% over the last five years (as of March 31st 2025).

          Stocks that made our list in 2020 include now familiar names such as Nvidia (+1,545% between March 2020 and March 2025) as well as under-the-radar businesses like the once-small-cap company Exlservice (+354% five-year return).

          StockStory is growing and hiring equity analyst and marketing roles. Are you a 0 to 1 builder passionate about the markets and AI? See the open roles here.

          Risk Warnings and Disclaimers
          You understand and acknowledge that there is a high degree of risk involved in trading. Following any strategies or investment methods may lead to potential losses. The content on the site is provided by our contributors and analysts for information purposes only. You are solely responsible for determining whether any trading assets, securities, strategy, or any other product is suitable for investing based on your own investment objectives and financial situation.
          Add to Favorites
          Share

          Dj Vp Lanoy Sells 5000 Of Natures Sunshine Products Inc >Natr

          Reuters
          Natures Sunshine Products
          +2.57%
          Risk Warnings and Disclaimers
          You understand and acknowledge that there is a high degree of risk involved in trading. Following any strategies or investment methods may lead to potential losses. The content on the site is provided by our contributors and analysts for information purposes only. You are solely responsible for determining whether any trading assets, securities, strategy, or any other product is suitable for investing based on your own investment objectives and financial situation.
          Add to Favorites
          Share
          FastBull
          Copyright © 2025 FastBull Ltd

          728 RM B 7/F GEE LOK IND BLDG NO 34 HUNG TO RD KWUN TONG KLN HONG KONG

          TelegramInstagramTwitterfacebooklinkedin
          App Store Google Play Google Play
          Products
          Charts

          Chats

          Q&A with Experts
          Screeners
          Economic Calendar
          Data
          Tools
          Membership
          Features
          Function
          Markets
          Copy Trading
          Latest Signals
          Contests
          News
          Analysis
          24/7
          Columns
          Education
          Company
          Careers
          About Us
          Contact Us
          Advertising
          Help Center
          Feedback
          User Agreement
          Privacy Policy
          Business

          White Label

          Data API

          Web Plug-ins

          Poster Maker

          Affiliate Program

          Risk Disclosure

          The risk of loss in trading financial instruments such as stocks, FX, commodities, futures, bonds, ETFs and crypto can be substantial. You may sustain a total loss of the funds that you deposit with your broker. Therefore, you should carefully consider whether such trading is suitable for you in light of your circumstances and financial resources.

          No decision to invest should be made without thoroughly conducting due diligence by yourself or consulting with your financial advisors. Our web content might not suit you since we don't know your financial conditions and investment needs. Our financial information might have latency or contain inaccuracy, so you should be fully responsible for any of your trading and investment decisions. The company will not be responsible for your capital loss.

          Without getting permission from the website, you are not allowed to copy the website's graphics, texts, or trademarks. Intellectual property rights in the content or data incorporated into this website belong to its providers and exchange merchants.

          Not Logged In

          Log in to access more features

          FastBull Membership

          Not yet

          Purchase

          Become a signal provider
          Help Center
          Customer Service
          Dark Mode
          Price Up/Down Colors

          Log In

          Sign Up

          Position
          Layout
          Fullscreen
          Default to Chart
          The chart page opens by default when you visit fastbull.com