• Trade
  • Markets
  • Copy
  • Contests
  • News
  • 24/7
  • Calendar
  • Q&A
  • Chats
Trending
Screeners
SYMBOL
LAST
BID
ASK
HIGH
LOW
NET CHG.
%CHG.
SPREAD
SPX
S&P 500 Index
6816.52
6816.52
6816.52
6861.30
6801.50
-10.89
-0.16%
--
DJI
Dow Jones Industrial Average
48416.55
48416.55
48416.55
48679.14
48283.27
-41.49
-0.09%
--
IXIC
NASDAQ Composite Index
23057.40
23057.40
23057.40
23345.56
23012.00
-137.76
-0.59%
--
USDX
US Dollar Index
97.880
97.960
97.880
97.930
97.820
-0.010
-0.01%
--
EURUSD
Euro / US Dollar
1.17511
1.17518
1.17511
1.17590
1.17457
-0.00020
-0.02%
--
GBPUSD
Pound Sterling / US Dollar
1.33658
1.33665
1.33658
1.33830
1.33543
-0.00105
-0.08%
--
XAUUSD
Gold / US Dollar
4288.42
4288.87
4288.42
4317.78
4280.58
-16.70
-0.39%
--
WTI
Light Sweet Crude Oil
56.327
56.364
56.327
56.518
56.261
-0.078
-0.14%
--

Community Accounts

Signal Accounts
--
Profit Accounts
--
Loss Accounts
--
View More

Become a signal provider

Sell trading signals to earn additional income

View More

Guide to Copy Trading

Get started with ease and confidence

View More

Signal Accounts for Members

All Signal Accounts

Best Return
  • Best Return
  • Best P/L
  • Best MDD
Past 1W
  • Past 1W
  • Past 1M
  • Past 1Y

All Contests

  • All
  • Trump Updates
  • Recommend
  • Stocks
  • Cryptocurrencies
  • Central Banks
  • Featured News
Top News Only
Share

India's Nifty Bank Futures Down 0.21% In Pre-Open Trade

Share

India's Nifty 50 Futures Down 0.37% In Pre-Open Trade

Share

India's Nifty 50 Index Down 0.29% In Pre-Open Trade

Share

Japan's Nikkei Share Average Extends Decline, Last Down 1.6%

Share

Indian Rupee Weakens Past 90.7875 Against USA Dollar To All-Time Low

Share

Malaysia's Ringgit Rises To 4.0840 Per USA Dollar, Strongest Level Since Early March 2021

Share

South Korea Central Bank: Oct M2 Money Supply Measure +8.7% Year-On-Year Versus+8.5% In Sept

Share

South Korea Oct M2 Money Supply Measure Marks Fastest Grwoth Year-On-Year Since June 2022

Share

South Korea Central Bank: Oct L-Money Supply Measure +7.1% Year-On-Year Versus+7.2% In Sept

Share

Spot Gold Plunged $13 In A Short Period, Falling Below $4,290 Per Ounce; Spot Silver Fell Below $63 Per Ounce, Down 1.74% On The Day

Share

China's CSI New Energy Index Down 3%

Share

The Main Platinum Futures Contract Rose By 6.00% Intraday, Currently Trading At 502.60 Yuan/gram

Share

Japan's Nikkei Falls 1% As Ai Stocks Slip Ahead Of US Jobs Data

Share

Economists At Cba, NAB Call For Australia February Rate Hike

Share

US Military Says It Carried Out Strikes On Three Vessels In Eastern Pacific

Share

USA Military Says Carried Out Strikes On Three Vessels In Internation Waters, Killing 8

Share

Australia Police: There Is No Evidence To Suggest Other Individuals Were Involved In This Attack

Share

Hang Seng Tech Index Down Nearly 2% To Lowest Since Nov 21

Share

Goldman Sachs Cites Improved Global Macroeconomic Conditions To Support Rising Risk Appetite And Recommends Continuing To Overweight Equities. Goldman Sachs Strategists Stated That Positive Economic Data Has Boosted Optimism About Global Economic Growth, Keeping Investors Enthusiastic About Various Markets. "Recently, The Macroeconomic Environment In Both Advanced And Emerging Market Economies Has Generally Improved More Than Expected," Maintaining A Moderate Risk Appetite Stance Until 2026. They Maintain An Overweight Position On Equities, A Neutral Position On Bonds/commodities/cash, And An Underweight Position On Credit, Focusing On Protecting Equity Exposure Through Diversification And Hedging Strategies

Share

[On Polymarket, The Probability Of The "Bank Of Japan 25 Basis Point Rate Hike In December" Is Currently At 96%.] December 16Th, According To The Relevant Page, The Probability Of "Bank Of Japan 25 Basis Point Rate Hike In December" On Polymarket Is Currently At 96%, While The Probability Of No Change In Interest Rates Is 3%.According To Public Information, The Bank Of Japan Is Scheduled To Announce Its Interest Rate Decision On December 19Th

TIME
ACT
FCST
PREV
U.K. Rightmove House Price Index YoY (Dec)

A:--

F: --

P: --

China, Mainland Industrial Output YoY (YTD) (Nov)

A:--

F: --

P: --

China, Mainland Urban Area Unemployment Rate (Nov)

A:--

F: --

P: --

Saudi Arabia CPI YoY (Nov)

A:--

F: --

P: --

Euro Zone Industrial Output YoY (Oct)

A:--

F: --

P: --

Euro Zone Industrial Output MoM (Oct)

A:--

F: --

P: --

Canada Existing Home Sales MoM (Nov)

A:--

F: --

P: --

Canada National Economic Confidence Index

A:--

F: --

P: --

Canada New Housing Starts (Nov)

A:--

F: --

P: --
U.S. NY Fed Manufacturing Employment Index (Dec)

A:--

F: --

P: --

U.S. NY Fed Manufacturing Index (Dec)

A:--

F: --

P: --

Canada Core CPI YoY (Nov)

A:--

F: --

P: --

Canada Manufacturing Unfilled Orders MoM (Oct)

A:--

F: --

P: --

U.S. NY Fed Manufacturing Prices Received Index (Dec)

A:--

F: --

P: --

U.S. NY Fed Manufacturing New Orders Index (Dec)

A:--

F: --

P: --

Canada Manufacturing New Orders MoM (Oct)

A:--

F: --

P: --

Canada Core CPI MoM (Nov)

A:--

F: --

P: --

Canada Trimmed CPI YoY (SA) (Nov)

A:--

F: --

P: --

Canada Manufacturing Inventory MoM (Oct)

A:--

F: --

P: --

Canada CPI YoY (Nov)

A:--

F: --

P: --

Canada CPI MoM (Nov)

A:--

F: --

P: --

Canada CPI YoY (SA) (Nov)

A:--

F: --

P: --

Canada Core CPI MoM (SA) (Nov)

A:--

F: --

P: --

Canada CPI MoM (SA) (Nov)

A:--

F: --

P: --

Federal Reserve Board Governor Milan delivered a speech
U.S. NAHB Housing Market Index (Dec)

A:--

F: --

P: --

Australia Composite PMI Prelim (Dec)

A:--

F: --

P: --

Australia Services PMI Prelim (Dec)

A:--

F: --

P: --

Australia Manufacturing PMI Prelim (Dec)

A:--

F: --

P: --

Japan Manufacturing PMI Prelim (SA) (Dec)

A:--

F: --

P: --

U.K. 3-Month ILO Employment Change (Oct)

--

F: --

P: --

U.K. Unemployment Claimant Count (Nov)

--

F: --

P: --

U.K. Unemployment Rate (Nov)

--

F: --

P: --

U.K. 3-Month ILO Unemployment Rate (Oct)

--

F: --

P: --

U.K. Average Weekly Earnings (3-Month Average, Including Bonuses) YoY (Oct)

--

F: --

P: --

U.K. Average Weekly Earnings (3-Month Average, Excluding Bonuses) YoY (Oct)

--

F: --

P: --

France Services PMI Prelim (Dec)

--

F: --

P: --

France Composite PMI Prelim (SA) (Dec)

--

F: --

P: --

France Manufacturing PMI Prelim (Dec)

--

F: --

P: --

Germany Services PMI Prelim (SA) (Dec)

--

F: --

P: --

Germany Manufacturing PMI Prelim (SA) (Dec)

--

F: --

P: --

Germany Composite PMI Prelim (SA) (Dec)

--

F: --

P: --

Euro Zone Composite PMI Prelim (SA) (Dec)

--

F: --

P: --

Euro Zone Services PMI Prelim (SA) (Dec)

--

F: --

P: --

Euro Zone Manufacturing PMI Prelim (SA) (Dec)

--

F: --

P: --

U.K. Services PMI Prelim (Dec)

--

F: --

P: --

U.K. Manufacturing PMI Prelim (Dec)

--

F: --

P: --

U.K. Composite PMI Prelim (Dec)

--

F: --

P: --

Euro Zone ZEW Economic Sentiment Index (Dec)

--

F: --

P: --

Germany ZEW Current Conditions Index (Dec)

--

F: --

P: --

Germany ZEW Economic Sentiment Index (Dec)

--

F: --

P: --

Euro Zone Trade Balance (Not SA) (Oct)

--

F: --

P: --

Euro Zone ZEW Current Conditions Index (Dec)

--

F: --

P: --

Euro Zone Trade Balance (SA) (Oct)

--

F: --

P: --

Euro Zone Total Reserve Assets (Nov)

--

F: --

P: --

U.K. Inflation Rate Expectations

--

F: --

P: --

U.S. Unemployment Rate (SA) (Nov)

--

F: --

P: --

U.S. Nonfarm Payrolls (SA) (Nov)

--

F: --

P: --

U.S. Retail Sales MoM (Excl. Gas Stations & Vehicle Dealers) (SA) (Oct)

--

F: --

P: --

U.S. Retail Sales MoM (Excl. Automobile) (SA) (Oct)

--

F: --

P: --

Q&A with Experts
    • All
    • Chatrooms
    • Groups
    • Friends
    Connecting
    .
    .
    .
    Type here...
    Add Symbol or Code

      No matching data

      All
      Trump Updates
      Recommend
      Stocks
      Cryptocurrencies
      Central Banks
      Featured News
      • All
      • Russia-Ukraine Conflict
      • Middle East Flashpoint
      • All
      • Russia-Ukraine Conflict
      • Middle East Flashpoint
      Search
      Products

      Charts Free Forever

      Chats Q&A with Experts
      Screeners Economic Calendar Data Tools
      Membership Features
      Data Warehouse Market Trends Institutional Data Policy Rates Macro

      Market Trends

      Market Sentiment Order Book Forex Correlations

      Top Indicators

      Charts Free Forever
      Markets

      News

      News Analysis 24/7 Columns Education
      From Institutions From Analysts
      Topics Columnists

      Latest Views

      Latest Views

      Trending Topics

      Top Columnists

      Latest Update

      Signals

      Copy Rankings Latest Signals Become a signal provider AI Rating
      Contests
      Brokers

      Overview Brokers Assessment Rankings Regulators News Claims
      Broker listing Forex Brokers Comparison Tool Live Spread Comparison Scam
      Q&A Complaint Scam Alert Videos Tips to Detect Scam
      More

      Business
      Events
      Careers About Us Advertising Help Center

      White Label

      Data API

      Web Plug-ins

      Affiliate Program

      Awards Institution Evaluation IB Seminar Salon Event Exhibition
      Vietnam Thailand Singapore Dubai
      Fans Party Investment Sharing Session
      FastBull Summit BrokersView Expo
      Recent Searches
        Top Searches
          Markets
          News
          Analysis
          User
          24/7
          Economic Calendar
          Education
          Data
          • Names
          • Latest
          • Prev

          View All

          No data

          Scan to Download

          Faster Charts, Chat Faster!

          Download App
          English
          • English
          • Español
          • العربية
          • Bahasa Indonesia
          • Bahasa Melayu
          • Tiếng Việt
          • ภาษาไทย
          • Français
          • Italiano
          • Türkçe
          • Русский язык
          • 简中
          • 繁中
          Open Account
          Search
          Products
          Charts Free Forever
          Markets
          News
          Signals

          Copy Rankings Latest Signals Become a signal provider AI Rating
          Contests
          Brokers

          Overview Brokers Assessment Rankings Regulators News Claims
          Broker listing Forex Brokers Comparison Tool Live Spread Comparison Scam
          Q&A Complaint Scam Alert Videos Tips to Detect Scam
          More

          Business
          Events
          Careers About Us Advertising Help Center

          White Label

          Data API

          Web Plug-ins

          Affiliate Program

          Awards Institution Evaluation IB Seminar Salon Event Exhibition
          Vietnam Thailand Singapore Dubai
          Fans Party Investment Sharing Session
          FastBull Summit BrokersView Expo

          Dj Mrc Global Files 8K - Changes To Articles >Mrc

          Reuters
          MRC Global
          0.00%
          Risk Warnings and Disclaimers
          You understand and acknowledge that there is a high degree of risk involved in trading. Following any strategies or investment methods may lead to potential losses. The content on the site is provided by our contributors and analysts for information purposes only. You are solely responsible for determining whether any trading assets, securities, strategy, or any other product is suitable for investing based on your own investment objectives and financial situation.
          Add to Favorites
          Share

          Dj Mrc Global Files 8K - Changes In Control >Mrc

          Reuters
          MRC Global
          0.00%
          Risk Warnings and Disclaimers
          You understand and acknowledge that there is a high degree of risk involved in trading. Following any strategies or investment methods may lead to potential losses. The content on the site is provided by our contributors and analysts for information purposes only. You are solely responsible for determining whether any trading assets, securities, strategy, or any other product is suitable for investing based on your own investment objectives and financial situation.
          Add to Favorites
          Share

          DNOW Q3 Deep Dive: MRC Global Merger and Midstream Expansion Shape Outlook

          Stock Story
          DNOW Inc.
          -1.54%
          MRC Global
          0.00%

          DNOW Cover Image

          Energy and industrial distributor DistributionNOW met Wall Streets revenue expectations in Q3 CY2025, with sales up 4.6% year on year to $634 million. Its non-GAAP profit of $0.26 per share was 11.4% above analysts’ consensus estimates.

          Is now the time to buy DNOW? Find out in our full research report (it’s free for active Edge members).

          DistributionNOW (DNOW) Q3 CY2025 Highlights:

          • Revenue: $634 million vs analyst estimates of $634.1 million (4.6% year-on-year growth, in line)
          • Adjusted EPS: $0.26 vs analyst estimates of $0.23 (11.4% beat)
          • Adjusted EBITDA: $51 million vs analyst estimates of $49.5 million (8% margin, 3% beat)
          • Operating Margin: 5.2%, up from 3.8% in the same quarter last year
          • Market Capitalization: $1.53 billion

          StockStory’s Take

          DistributionNOW’s third quarter results reflected steady execution in a subdued energy market, with management attributing performance to disciplined cost control, operational leverage, and targeted customer focus. CEO David Cherechinsky noted the company’s “solutions-oriented approach” and highlighted growth in midstream and process solutions, along with efficient working capital management and improved inventory turns. Management acknowledged ongoing competitive pressure in core U.S. markets and cited customer consolidation as an industry headwind.

          Looking forward, management believes the pending merger with MRC Global will be a key catalyst, aiming to unlock $70 million in annual cost synergies and broaden the company’s product reach. Cherechinsky described the integration as an opportunity to “serve a broader and more diversified mix of customers,” supported by a leadership team with deep industry experience. However, he cautioned that market volatility, customer consolidation, and geopolitical uncertainties, including tariffs and OPEC+ policy shifts, could impact the pace of growth.

          Key Insights from Management’s Remarks

          Management pointed to midstream strength, digital tool adoption, and water management solutions as significant contributors to the quarter’s results, while also emphasizing strategic progress ahead of the MRC Global merger.

          • Midstream demand drives growth: The company benefited from increased activity in gathering and transmission projects, particularly as LNG export demand and power generation requirements created new opportunities for pipe, valve, and fitting sales. Midstream accounted for 24% of overall revenue, with notable project wins in pipeline infrastructure for natural gas distribution to data centers and power plants.
          • Product innovation in water management: DistributionNOW expanded its Flex Flow and Trojan rental offerings, addressing rising needs for higher-horsepower pumps and automation in produced water handling. The company also secured orders for equipment targeting the CO2 sequestration and carbon capture, utilization, and storage (CCUS) markets, reflecting customer interest in enhanced oil recovery and environmental compliance.
          • EcoVapor product line progress: Management highlighted the development and deployment of new gas treating solutions, including the O2E 2000 for landfill gas and the DryOxo unit for renewable natural gas (RNG) applications. These additions broadened the company’s reach into landfill, agricultural, and biogas markets, supporting future revenue diversification.
          • DigitalNOW platform adoption: The company’s digital analytics tools continued to gain traction, enabling large customers to optimize inventory management and supply chain planning. Management believes these tools enhance customer satisfaction and create operational efficiencies, potentially leading to higher margins and retention.
          • Merger integration readiness: Ahead of the MRC Global merger, the company is focused on talent retention, aligning sales teams, and leveraging complementary technology stacks. Management expects the combined entity to benefit from MRC’s new enterprise resource planning (ERP) system, which may improve inventory movement, pricing, and operational visibility.

          Drivers of Future Performance

          DistributionNOW expects the integration with MRC Global, midstream expansion, and continued digital adoption to shape results in the coming quarters, but notes macro uncertainty and competitive intensity as ongoing risks.

          • Merger execution and synergy capture: Management is prioritizing a smooth integration with MRC Global, targeting $70 million in annual cost synergies from combined operations, IT efficiencies, and supply chain optimization. Leadership emphasized that retaining top talent and maintaining customer service levels are critical to realizing these benefits without significant disruption.
          • Midstream and energy transition opportunities: The company expects continued investment in LNG, power transmission, and CCUS projects to drive demand for its core products and services. Cherechinsky highlighted the potential for market share gains as customers seek larger, more centralized infrastructure, and stressed the company’s ability to supply fabricated equipment for data center and power generation buildouts.
          • Margin management amid competition: Management remains focused on higher-margin products and services, leveraging its solutions portfolio and acquisitions to offset pricing pressure in a “hypercompetitive” environment. However, they acknowledged that end-market growth—especially in U.S. onshore activity—will be key to sustaining current margin performance.

          Catalysts in Upcoming Quarters

          In the coming quarters, our analysts are closely watching (1) the pace and quality of the MRC Global integration, especially efforts to retain key personnel and achieve targeted cost synergies; (2) signs of sustained momentum in midstream and LNG-related capital spending; and (3) the adoption rate of digital tools and new product lines, such as EcoVapor and Flex Flow. Developments in energy transition projects and progress on inventory optimization will also be important indicators.

          DistributionNOW currently trades at $14.56, in line with $14.62 just before the earnings. In the wake of this quarter, is it a buy or sell? Find out in our full research report (it’s free for active Edge members).

          Our Favorite Stocks Right Now

          Donald Trump’s April 2025 "Liberation Day" tariffs sent markets into a tailspin, but stocks have since rebounded strongly, proving that knee-jerk reactions often create the best buying opportunities.

          The smart money is already positioning for the next leg up. Don’t miss out on the recovery - check out our Top 5 Growth Stocks for this month. This is a curated list of our High Quality stocks that have generated a market-beating return of 183% over the last five years (as of March 31st 2025).

          Stocks that made our list in 2020 include now familiar names such as Nvidia (+1,545% between March 2020 and March 2025) as well as under-the-radar businesses like the once-micro-cap company Kadant (+351% five-year return).

          StockStory is growing and hiring equity analyst and marketing roles. Are you a 0 to 1 builder passionate about the markets and AI? See the open roles here.

          Risk Warnings and Disclaimers
          You understand and acknowledge that there is a high degree of risk involved in trading. Following any strategies or investment methods may lead to potential losses. The content on the site is provided by our contributors and analysts for information purposes only. You are solely responsible for determining whether any trading assets, securities, strategy, or any other product is suitable for investing based on your own investment objectives and financial situation.
          Add to Favorites
          Share

          Dj News On Mrc Global Inc. (Mrc) Now Under Dnow

          Reuters
          DNOW Inc.
          -1.54%
          MRC Global
          0.00%
          Risk Warnings and Disclaimers
          You understand and acknowledge that there is a high degree of risk involved in trading. Following any strategies or investment methods may lead to potential losses. The content on the site is provided by our contributors and analysts for information purposes only. You are solely responsible for determining whether any trading assets, securities, strategy, or any other product is suitable for investing based on your own investment objectives and financial situation.
          Add to Favorites
          Share

          MRC Global (NYSE:MRC) Misses Q3 Sales Expectations

          Stock Story
          MRC Global
          0.00%

          MRC Cover Image

          Fluid and gas handling company MRC missed Wall Street’s revenue expectations in Q3 CY2025, with sales falling 12.1% year on year to $678 million. Its non-GAAP profit of $0.13 per share was 60.6% below analysts’ consensus estimates.

          Is now the time to buy MRC Global? Find out by accessing our full research report, it’s free for active Edge members.

          MRC Global (MRC) Q3 CY2025 Highlights:

          • Revenue: $678 million vs analyst estimates of $848.5 million (12.1% year-on-year decline, 20.1% miss)
          • Adjusted EPS: $0.13 vs analyst expectations of $0.33 (60.6% miss)
          • Adjusted EBITDA: $36 million vs analyst estimates of $61.3 million (5.3% margin, 41.3% miss)
          • Operating Margin: -0.4%, down from 4.8% in the same quarter last year
          • Free Cash Flow was -$37 million, down from $87 million in the same quarter last year
          • Backlog: $571 million at quarter end, down 1.6% year on year
          • Market Capitalization: $1.18 billion

          Rob Saltiel, MRC Global’s President and CEO, commented, “The implementation of our new enterprise resource planning (ERP) system in our U.S. segment encountered significant challenges that adversely impacted our revenues, profitability, and cash flows, during our third quarter. We deployed extensive resources to ensure that customer service levels were maintained and that business operations could function as we addressed the system issues. I am pleased to report that our financial and operations performance improved dramatically by the end of our third quarter and that this more normalized performance has continued throughout the month of October. We greatly appreciate the patience of our customers and the hard work by the entire MRC Global team during this system transition.”

          Company Overview

          Producing bomb casings and tracks for vehicles during WWII, MRC offers pipes, valves, and fitting products for various industries.

          Revenue Growth

          Examining a company’s long-term performance can provide clues about its quality. Any business can put up a good quarter or two, but the best consistently grow over the long haul. Unfortunately, MRC Global struggled to consistently increase demand as its $2.85 billion of sales for the trailing 12 months was close to its revenue five years ago. This was below our standards and suggests it’s a low quality business.

          MRC Global Quarterly Revenue

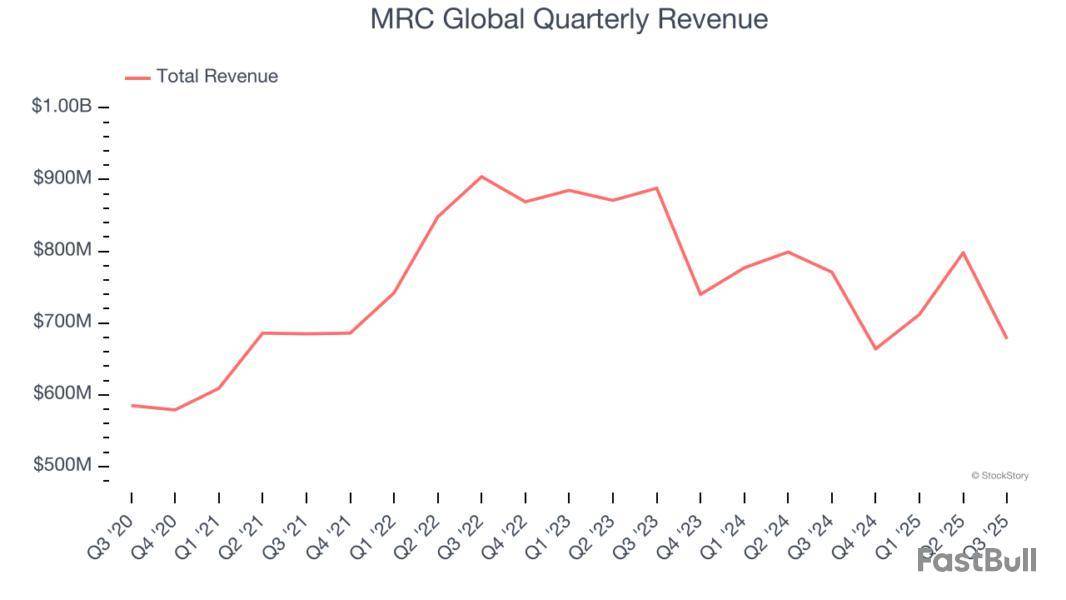
          Long-term growth is the most important, but within industrials, a half-decade historical view may miss new industry trends or demand cycles. MRC Global’s recent performance shows its demand remained suppressed as its revenue has declined by 9.9% annually over the last two years.

          MRC Global Year-On-Year Revenue Growth

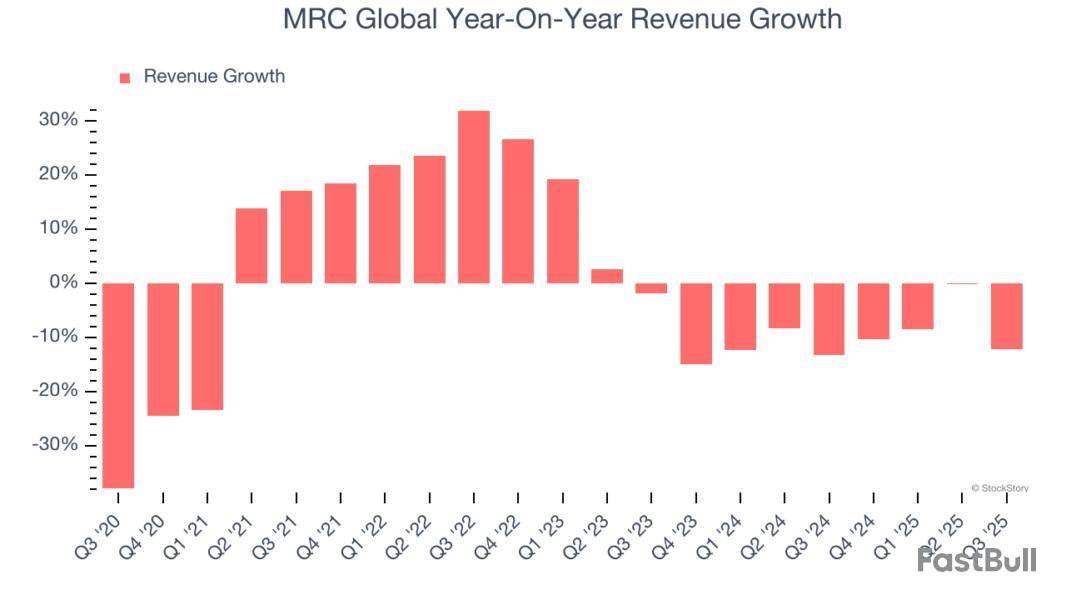
          MRC Global also reports its backlog, or the value of its outstanding orders that have not yet been executed or delivered. MRC Global’s backlog reached $571 million in the latest quarter and averaged 1.6% year-on-year declines over the last two years. Because this number is better than its revenue growth, we can see the company accumulated more orders than it could fulfill and deferred revenue to the future. This could imply elevated demand for MRC Global’s products and services but raises concerns about capacity constraints.

          MRC Global Backlog

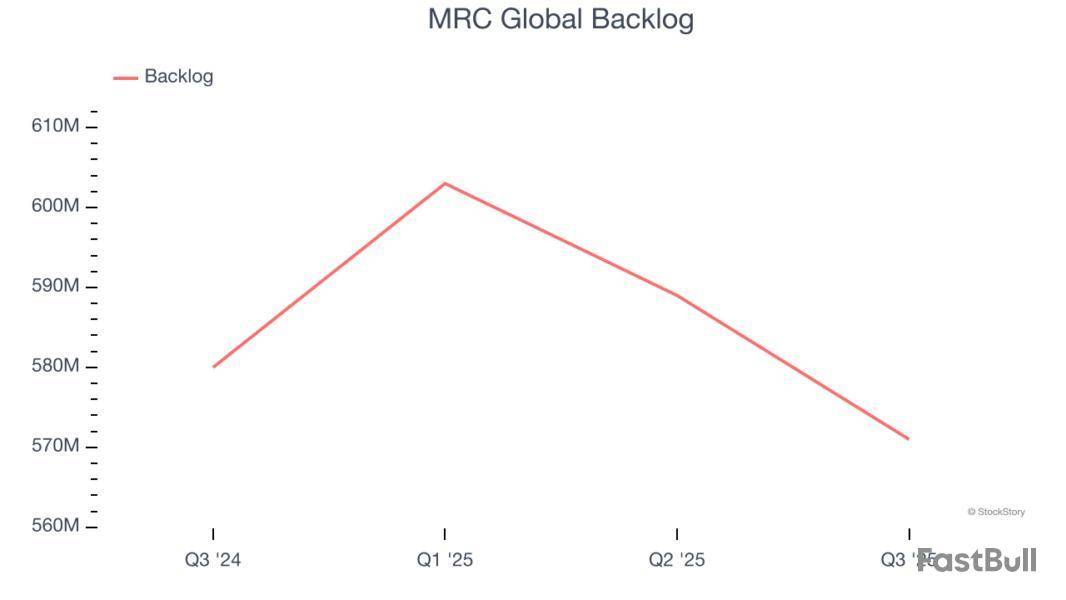
          This quarter, MRC Global missed Wall Street’s estimates and reported a rather uninspiring 12.1% year-on-year revenue decline, generating $678 million of revenue.

          Looking ahead, sell-side analysts expect revenue to grow 15.1% over the next 12 months, an improvement versus the last two years. This projection is eye-popping and indicates its newer products and services will fuel better top-line performance.

          Software is eating the world and there is virtually no industry left that has been untouched by it. That drives increasing demand for tools helping software developers do their jobs, whether it be monitoring critical cloud infrastructure, integrating audio and video functionality, or ensuring smooth content streaming. Click here to access a free report on our 3 favorite stocks to play this generational megatrend.

          Operating Margin

          Operating margin is a key measure of profitability. Think of it as net income - the bottom line - excluding the impact of taxes and interest on debt, which are less connected to business fundamentals.

          MRC Global was profitable over the last five years but held back by its large cost base. Its average operating margin of 3.3% was weak for an industrials business. This result isn’t too surprising given its low gross margin as a starting point.

          On the plus side, MRC Global’s operating margin rose by 1.7 percentage points over the last five years.

          MRC Global Trailing 12-Month Operating Margin (GAAP)

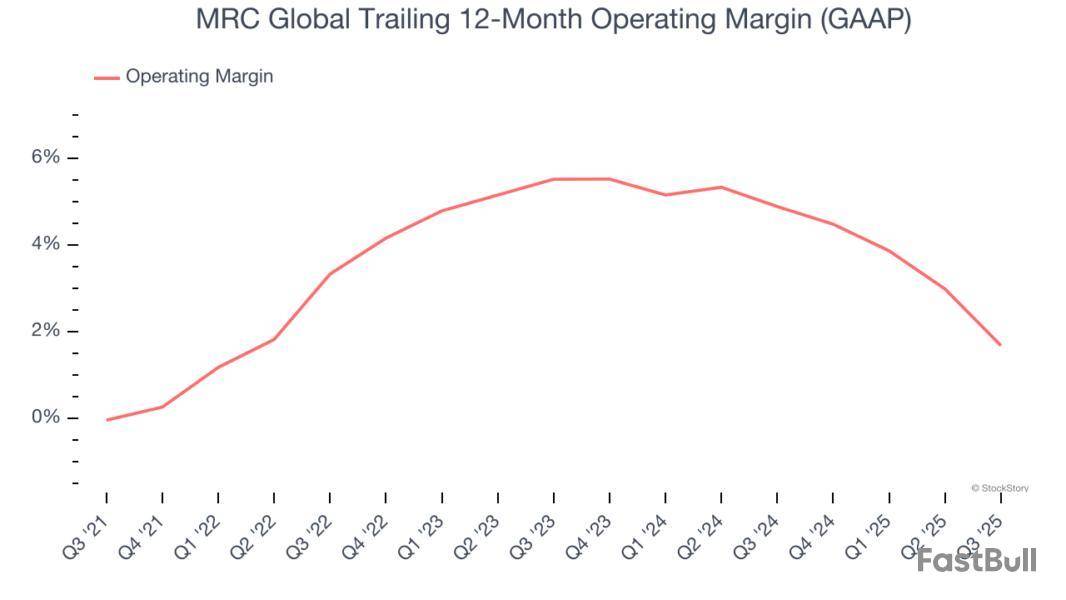
          In Q3, MRC Global’s breakeven margin was down 5.2 percentage points year on year. Conversely, its gross margin actually rose, so we can assume its recent inefficiencies were driven by increased operating expenses like marketing, R&D, and administrative overhead.

          Earnings Per Share

          Revenue trends explain a company’s historical growth, but the long-term change in earnings per share (EPS) points to the profitability of that growth – for example, a company could inflate its sales through excessive spending on advertising and promotions.

          MRC Global’s full-year EPS flipped from negative to positive over the last five years. This is encouraging and shows it’s at a critical moment in its life.

          MRC Global Trailing 12-Month EPS (Non-GAAP)

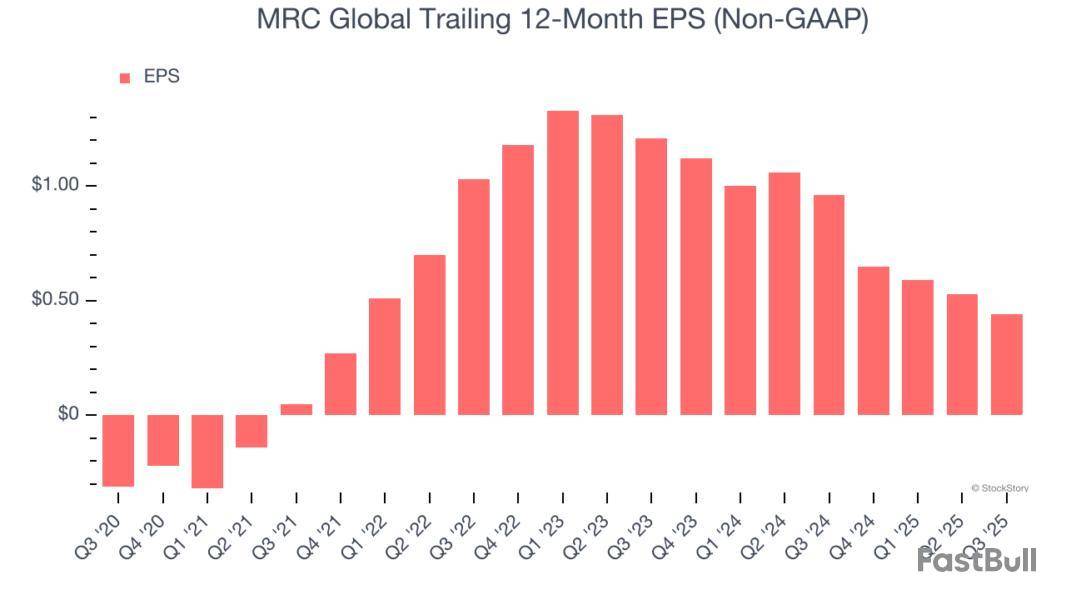
          Like with revenue, we analyze EPS over a shorter period to see if we are missing a change in the business.

          Sadly for MRC Global, its EPS declined by more than its revenue over the last two years, dropping 39.7%. This tells us the company struggled to adjust to shrinking demand.

          Diving into the nuances of MRC Global’s earnings can give us a better understanding of its performance. MRC Global’s operating margin has declined over the last two years. This was the most relevant factor (aside from the revenue impact) behind its lower earnings; interest expenses and taxes can also affect EPS but don’t tell us as much about a company’s fundamentals.

          In Q3, MRC Global reported adjusted EPS of $0.13, down from $0.22 in the same quarter last year. This print missed analysts’ estimates, but we care more about long-term adjusted EPS growth than short-term movements. Over the next 12 months, Wall Street expects MRC Global’s full-year EPS of $0.44 to grow 178%.

          Key Takeaways from MRC Global’s Q3 Results

          We struggled to find many positives in these results. Its Valves revenue missed and its revenue fell short of Wall Street’s estimates. Overall, this was a softer quarter. 

          Is MRC Global an attractive investment opportunity at the current price? We think that the latest quarter is only one piece of the longer-term business quality puzzle. Quality, when combined with valuation, can help determine if the stock is a buy. We cover that in our actionable full research report which you can read here, it’s free for active Edge members.

          Risk Warnings and Disclaimers
          You understand and acknowledge that there is a high degree of risk involved in trading. Following any strategies or investment methods may lead to potential losses. The content on the site is provided by our contributors and analysts for information purposes only. You are solely responsible for determining whether any trading assets, securities, strategy, or any other product is suitable for investing based on your own investment objectives and financial situation.
          Add to Favorites
          Share

          Pipes And Valves Distributor Mrc Global's Q3 Sales Miss Expectations

          Reuters
          MRC Global
          0.00%
          Risk Warnings and Disclaimers
          You understand and acknowledge that there is a high degree of risk involved in trading. Following any strategies or investment methods may lead to potential losses. The content on the site is provided by our contributors and analysts for information purposes only. You are solely responsible for determining whether any trading assets, securities, strategy, or any other product is suitable for investing based on your own investment objectives and financial situation.
          Add to Favorites
          Share

          Dj Mrc Global 3Q Adj Eps 13C >Mrc

          Reuters
          MRC Global
          0.00%
          Risk Warnings and Disclaimers
          You understand and acknowledge that there is a high degree of risk involved in trading. Following any strategies or investment methods may lead to potential losses. The content on the site is provided by our contributors and analysts for information purposes only. You are solely responsible for determining whether any trading assets, securities, strategy, or any other product is suitable for investing based on your own investment objectives and financial situation.
          Add to Favorites
          Share
          FastBull
          Copyright © 2025 FastBull Ltd

          728 RM B 7/F GEE LOK IND BLDG NO 34 HUNG TO RD KWUN TONG KLN HONG KONG

          TelegramInstagramTwitterfacebooklinkedin
          App Store Google Play Google Play
          Products
          Charts

          Chats

          Q&A with Experts
          Screeners
          Economic Calendar
          Data
          Tools
          Membership
          Features
          Function
          Markets
          Copy Trading
          Latest Signals
          Contests
          News
          Analysis
          24/7
          Columns
          Education
          Company
          Careers
          About Us
          Contact Us
          Advertising
          Help Center
          Feedback
          User Agreement
          Privacy Policy
          Personal Information Protection Statement
          Business

          White Label

          Data API

          Web Plug-ins

          Poster Maker

          Affiliate Program

          Risk Disclosure

          The risk of loss in trading financial instruments such as stocks, FX, commodities, futures, bonds, ETFs and crypto can be substantial. You may sustain a total loss of the funds that you deposit with your broker. Therefore, you should carefully consider whether such trading is suitable for you in light of your circumstances and financial resources.

          No decision to invest should be made without thoroughly conducting due diligence by yourself or consulting with your financial advisors. Our web content might not suit you since we don't know your financial conditions and investment needs. Our financial information might have latency or contain inaccuracy, so you should be fully responsible for any of your trading and investment decisions. The company will not be responsible for your capital loss.

          Without getting permission from the website, you are not allowed to copy the website's graphics, texts, or trademarks. Intellectual property rights in the content or data incorporated into this website belong to its providers and exchange merchants.

          Not Logged In

          Log in to access more features

          FastBull Membership

          Not yet

          Purchase

          Become a signal provider
          Help Center
          Customer Service
          Dark Mode
          Price Up/Down Colors

          Log In

          Sign Up

          Position
          Layout
          Fullscreen
          Default to Chart
          The chart page opens by default when you visit fastbull.com