• Trade
  • Markets
  • Copy
  • Contests
  • News
  • 24/7
  • Calendar
  • Q&A
  • Chats
Trending
Screeners
SYMBOL
LAST
BID
ASK
HIGH
LOW
NET CHG.
%CHG.
SPREAD
SPX
S&P 500 Index
6849.16
6849.16
6849.16
6861.30
6843.84
+21.75
+ 0.32%
--
DJI
Dow Jones Industrial Average
48624.26
48624.26
48624.26
48679.14
48557.21
+166.22
+ 0.34%
--
IXIC
NASDAQ Composite Index
23255.17
23255.17
23255.17
23345.56
23240.37
+60.01
+ 0.26%
--
USDX
US Dollar Index
97.830
97.910
97.830
98.070
97.810
-0.120
-0.12%
--
EURUSD
Euro / US Dollar
1.17551
1.17559
1.17551
1.17596
1.17262
+0.00157
+ 0.13%
--
GBPUSD
Pound Sterling / US Dollar
1.33945
1.33953
1.33945
1.33970
1.33546
+0.00238
+ 0.18%
--
XAUUSD
Gold / US Dollar
4331.01
4331.42
4331.01
4350.16
4294.68
+31.62
+ 0.74%
--
WTI
Light Sweet Crude Oil
56.882
56.912
56.882
57.601
56.789
-0.351
-0.61%
--

Community Accounts

Signal Accounts
--
Profit Accounts
--
Loss Accounts
--
View More

Become a signal provider

Sell trading signals to earn additional income

View More

Guide to Copy Trading

Get started with ease and confidence

View More

Signal Accounts for Members

All Signal Accounts

Best Return
  • Best Return
  • Best P/L
  • Best MDD
Past 1W
  • Past 1W
  • Past 1M
  • Past 1Y

All Contests

  • All
  • Trump Updates
  • Recommend
  • Stocks
  • Cryptocurrencies
  • Central Banks
  • Featured News
Top News Only
Share

The Nasdaq Golden Dragon China Index Fell 0.9% In Early Trading

Share

The S&P 500 Opened 32.78 Points Higher, Or 0.48%, At 6860.19; The Dow Jones Industrial Average Opened 136.31 Points Higher, Or 0.28%, At 48594.36; And The Nasdaq Composite Opened 134.87 Points Higher, Or 0.58%, At 23330.04

Share

Miran: Goods Inflation Could Be Settling In At A Higher Level Than Was Normal Before The Pandemic, But That Will Be More Than Offset By Housing Disinflation

Share

Miran, Who Dissented In Favor Of A Larger Cut At Last Fed Meeting, Repeats Keeping Policy Too Tight Will Lead To Job Losses

Share

Miran: Does Not Think Higher Goods Inflation Is Mostly From Tariffs, But Acknowledges Does Not Have A Full Explanation For It

Share

Toronto Stock Index .GSPTSE Rises 67.16 Points, Or 0.21 Percent, To 31594.55 At Open

Share

Miran: Excluding Housing And Non-Market Based Items, Core Pce Inflation May Be Below 2.3%, “Within Noise” Of The Fed's 2% Target

Share

Polish State Assets Minister Balczun Says Jsw Needs Over USD 830 Million Financing To Keep Liquidity For A Year

Share

Miran: Prices Are “Once Again Stable” And Monetary Policy Should Reflect That

Share

Fed's Miran: Current Excess Inflation Is Not Reflective Of Underlying Supply And Demand In The Economy

Share

Portugal Treasury Puts 2026 Net Financing Needs At 13 Billion Euros, Up From 10.8 Billion In 2025

Share

Portugal Treasury Expects 2026 Net Financing Needs At 29.4 Billion Euros, Up From 25.8 Billion In 2025

Share

Bank Of America Says With Indonesia's Smelter Now Ramping Up, It Expects Aluminium Supply Growth To Accelerate To 2.6% Year On Year In 2026

Share

Bank Of America Expects A Deficit In Aluminium Next Year And Sees Prices Pushing Above $3000/T

Share

Fed Data - USA Effective Federal Funds Rate At 3.64 Percent On 12 December On $102 Billion In Trades Versus 3.64 Percent On $99 Billion On 11 December

Share

Brazil's Petrobras Says No Impact Seen On Oil, Petroleum Products Output As Workers Start Planned Strike

Share

Statement: US Travel Group Warns New Proposed Trump Administration Requirements For Foreign Tourists To Provide Social Media Histories Could Mean Millions Of People Opting Not To Visit

Share

Blackrock: Kerry White Will Become Head Of Citi Investment Management At Citi Wealth

Share

Blackrock: Rob Jasminski, Head Of Citi Investment Management, Has Joined With Team

Share

Blackrock: Effective Dec 15, Citi Investment Management Employees Will Join Blackrock

TIME
ACT
FCST
PREV
Japan Tankan Small Manufacturing Outlook Index (Q4)

A:--

F: --

P: --

Japan Tankan Large Non-Manufacturing Outlook Index (Q4)

A:--

F: --

P: --

Japan Tankan Large Manufacturing Outlook Index (Q4)

A:--

F: --

P: --

Japan Tankan Small Manufacturing Diffusion Index (Q4)

A:--

F: --

P: --

Japan Tankan Large Manufacturing Diffusion Index (Q4)

A:--

F: --

P: --

Japan Tankan Large-Enterprise Capital Expenditure YoY (Q4)

A:--

F: --

P: --

U.K. Rightmove House Price Index YoY (Dec)

A:--

F: --

P: --

China, Mainland Industrial Output YoY (YTD) (Nov)

A:--

F: --

P: --

China, Mainland Urban Area Unemployment Rate (Nov)

A:--

F: --

P: --

Saudi Arabia CPI YoY (Nov)

A:--

F: --

P: --

Euro Zone Industrial Output YoY (Oct)

A:--

F: --

P: --

Euro Zone Industrial Output MoM (Oct)

A:--

F: --

P: --

Canada Existing Home Sales MoM (Nov)

A:--

F: --

P: --

Canada National Economic Confidence Index

A:--

F: --

P: --

Canada New Housing Starts (Nov)

A:--

F: --

P: --
U.S. NY Fed Manufacturing Employment Index (Dec)

A:--

F: --

P: --

U.S. NY Fed Manufacturing Index (Dec)

A:--

F: --

P: --

Canada Core CPI YoY (Nov)

A:--

F: --

P: --

Canada Manufacturing Unfilled Orders MoM (Oct)

A:--

F: --

P: --

U.S. NY Fed Manufacturing Prices Received Index (Dec)

A:--

F: --

P: --

U.S. NY Fed Manufacturing New Orders Index (Dec)

A:--

F: --

P: --

Canada Manufacturing New Orders MoM (Oct)

A:--

F: --

P: --

Canada Core CPI MoM (Nov)

A:--

F: --

P: --

Canada Trimmed CPI YoY (SA) (Nov)

A:--

F: --

P: --

Canada Manufacturing Inventory MoM (Oct)

A:--

F: --

P: --

Canada CPI YoY (Nov)

A:--

F: --

P: --

Canada CPI MoM (Nov)

A:--

F: --

P: --

Canada CPI YoY (SA) (Nov)

A:--

F: --

P: --

Canada Core CPI MoM (SA) (Nov)

A:--

F: --

P: --

Canada CPI MoM (SA) (Nov)

A:--

F: --

P: --

Federal Reserve Board Governor Milan delivered a speech
U.S. NAHB Housing Market Index (Dec)

--

F: --

P: --

Australia Composite PMI Prelim (Dec)

--

F: --

P: --

Australia Services PMI Prelim (Dec)

--

F: --

P: --

Australia Manufacturing PMI Prelim (Dec)

--

F: --

P: --

Japan Manufacturing PMI Prelim (SA) (Dec)

--

F: --

P: --

U.K. 3-Month ILO Employment Change (Oct)

--

F: --

P: --

U.K. Unemployment Claimant Count (Nov)

--

F: --

P: --

U.K. Unemployment Rate (Nov)

--

F: --

P: --

U.K. 3-Month ILO Unemployment Rate (Oct)

--

F: --

P: --

U.K. Average Weekly Earnings (3-Month Average, Including Bonuses) YoY (Oct)

--

F: --

P: --

U.K. Average Weekly Earnings (3-Month Average, Excluding Bonuses) YoY (Oct)

--

F: --

P: --

France Services PMI Prelim (Dec)

--

F: --

P: --

France Composite PMI Prelim (SA) (Dec)

--

F: --

P: --

France Manufacturing PMI Prelim (Dec)

--

F: --

P: --

Germany Services PMI Prelim (SA) (Dec)

--

F: --

P: --

Germany Manufacturing PMI Prelim (SA) (Dec)

--

F: --

P: --

Germany Composite PMI Prelim (SA) (Dec)

--

F: --

P: --

Euro Zone Composite PMI Prelim (SA) (Dec)

--

F: --

P: --

Euro Zone Services PMI Prelim (SA) (Dec)

--

F: --

P: --

Euro Zone Manufacturing PMI Prelim (SA) (Dec)

--

F: --

P: --

U.K. Services PMI Prelim (Dec)

--

F: --

P: --

U.K. Manufacturing PMI Prelim (Dec)

--

F: --

P: --

U.K. Composite PMI Prelim (Dec)

--

F: --

P: --

Euro Zone ZEW Economic Sentiment Index (Dec)

--

F: --

P: --

Germany ZEW Current Conditions Index (Dec)

--

F: --

P: --

Germany ZEW Economic Sentiment Index (Dec)

--

F: --

P: --

Euro Zone Trade Balance (Not SA) (Oct)

--

F: --

P: --

Euro Zone ZEW Current Conditions Index (Dec)

--

F: --

P: --

Euro Zone Trade Balance (SA) (Oct)

--

F: --

P: --

U.S. Retail Sales MoM (Excl. Automobile) (SA) (Oct)

--

F: --

P: --

Q&A with Experts
    • All
    • Chatrooms
    • Groups
    • Friends
    Connecting
    .
    .
    .
    Type here...
    Add Symbol or Code

      No matching data

      All
      Trump Updates
      Recommend
      Stocks
      Cryptocurrencies
      Central Banks
      Featured News
      • All
      • Russia-Ukraine Conflict
      • Middle East Flashpoint
      • All
      • Russia-Ukraine Conflict
      • Middle East Flashpoint
      Search
      Products

      Charts Free Forever

      Chats Q&A with Experts
      Screeners Economic Calendar Data Tools
      Membership Features
      Data Warehouse Market Trends Institutional Data Policy Rates Macro

      Market Trends

      Market Sentiment Order Book Forex Correlations

      Top Indicators

      Charts Free Forever
      Markets

      News

      News Analysis 24/7 Columns Education
      From Institutions From Analysts
      Topics Columnists

      Latest Views

      Latest Views

      Trending Topics

      Top Columnists

      Latest Update

      Signals

      Copy Rankings Latest Signals Become a signal provider AI Rating
      Contests
      Brokers

      Overview Brokers Assessment Rankings Regulators News Claims
      Broker listing Forex Brokers Comparison Tool Live Spread Comparison Scam
      Q&A Complaint Scam Alert Videos Tips to Detect Scam
      More

      Business
      Events
      Careers About Us Advertising Help Center

      White Label

      Data API

      Web Plug-ins

      Affiliate Program

      Awards Institution Evaluation IB Seminar Salon Event Exhibition
      Vietnam Thailand Singapore Dubai
      Fans Party Investment Sharing Session
      FastBull Summit BrokersView Expo
      Recent Searches
        Top Searches
          Markets
          News
          Analysis
          User
          24/7
          Economic Calendar
          Education
          Data
          • Names
          • Latest
          • Prev

          View All

          No data

          Scan to Download

          Faster Charts, Chat Faster!

          Download App
          English
          • English
          • Español
          • العربية
          • Bahasa Indonesia
          • Bahasa Melayu
          • Tiếng Việt
          • ภาษาไทย
          • Français
          • Italiano
          • Türkçe
          • Русский язык
          • 简中
          • 繁中
          Open Account
          Search
          Products
          Charts Free Forever
          Markets
          News
          Signals

          Copy Rankings Latest Signals Become a signal provider AI Rating
          Contests
          Brokers

          Overview Brokers Assessment Rankings Regulators News Claims
          Broker listing Forex Brokers Comparison Tool Live Spread Comparison Scam
          Q&A Complaint Scam Alert Videos Tips to Detect Scam
          More

          Business
          Events
          Careers About Us Advertising Help Center

          White Label

          Data API

          Web Plug-ins

          Affiliate Program

          Awards Institution Evaluation IB Seminar Salon Event Exhibition
          Vietnam Thailand Singapore Dubai
          Fans Party Investment Sharing Session
          FastBull Summit BrokersView Expo

          Dj Mgic Investment Corporation, Inst Holders, 2Q 2025 (Mtg)

          Reuters
          MGIC Investment
          -0.21%
          Risk Warnings and Disclaimers
          You understand and acknowledge that there is a high degree of risk involved in trading. Following any strategies or investment methods may lead to potential losses. The content on the site is provided by our contributors and analysts for information purposes only. You are solely responsible for determining whether any trading assets, securities, strategy, or any other product is suitable for investing based on your own investment objectives and financial situation.
          Add to Favorites
          Share

          Dj Ibd: Mgic Investment Getting Closer To Key Technical Benchmark

          Reuters
          MGIC Investment
          -0.21%
          Risk Warnings and Disclaimers
          You understand and acknowledge that there is a high degree of risk involved in trading. Following any strategies or investment methods may lead to potential losses. The content on the site is provided by our contributors and analysts for information purposes only. You are solely responsible for determining whether any trading assets, securities, strategy, or any other product is suitable for investing based on your own investment objectives and financial situation.
          Add to Favorites
          Share

          MTG Q2 Deep Dive: Capital Returns Rise Amid Flat Mortgage Insurance Growth

          Stock Story
          MGIC Investment
          -0.21%

          MTG Cover Image

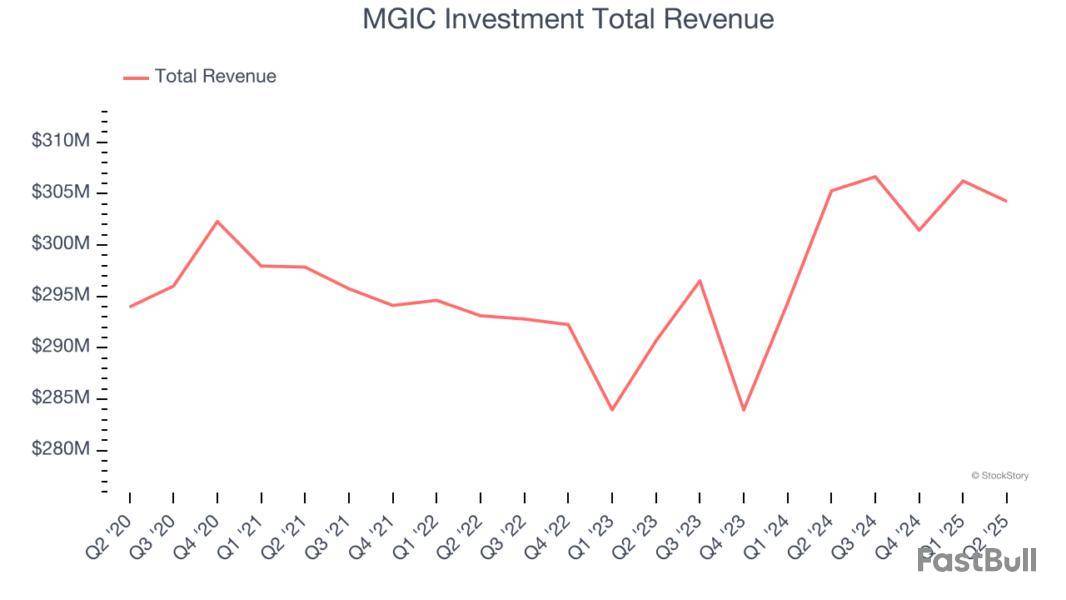
          Mortgage insurer MGIC Investment missed Wall Street’s revenue expectations in Q2 CY2025, with sales flat year on year at $304.2 million. Its non-GAAP profit of $0.82 per share was 14.3% above analysts’ consensus estimates.

          Is now the time to buy MTG? Find out in our full research report (it’s free).

          MGIC Investment (MTG) Q2 CY2025 Highlights:

          • Revenue: $304.2 million vs analyst estimates of $306.1 million (flat year on year, 0.6% miss)
          • Adjusted EPS: $0.82 vs analyst estimates of $0.72 (14.3% beat)
          • Adjusted Operating Income: $246.1 million (80.9% margin, 5.3% year-on-year decline)
          • Operating Margin: 80.9%, down from 85.1% in the same quarter last year
          • Market Capitalization: $6.34 billion

          StockStory’s Take

          MGIC Investment’s second quarter was marked by steady insurance portfolio performance and continued capital returns, despite revenue coming in slightly below Wall Street expectations. Management attributed the flat top line to persistent headwinds in the housing market, including limited growth of insurance in force and ongoing affordability challenges for homebuyers. CEO Tim Mattke noted the company’s focus on disciplined risk management and a resilient underwriting approach, stating, “Our disciplined risk management and strong underwriting standards remain key drivers of the quality of our portfolio.” The positive market reaction reflected investor appreciation for the company’s ability to maintain profitability and return excess capital in a sluggish housing environment.

          Looking forward, MGIC Investment’s guidance is shaped by expectations for a muted housing market, flat in-force premium yields, and continued strong credit performance. Management believes capital return to shareholders will remain elevated, given limited avenues for organic growth and continued robust capital generation. CFO Nathan Colson explained that, “If the credit conditions continue to be attractive and the lack of growth on the in-force side persists, then we expect that we will continue to generate excess capital and be able to continue to pay dividends.” The company also highlighted its ongoing focus on operational efficiency and prudent expense management, while closely monitoring regional housing dynamics and delinquency trends.

          Key Insights from Management’s Remarks

          Management cited disciplined risk selection and operational efficiency as major contributors to profitability, while highlighting subdued new insurance growth due to market conditions.

          • Housing headwinds constrain growth: Elevated mortgage rates and affordability issues limited new insurance written, resulting in flat insurance in force and persistency rates. Management noted that these market trends are expected to persist through year-end, impacting the ability to expand the portfolio.
          • Underwriting quality remains strong: The current portfolio continues to demonstrate solid credit performance, with cure rates on delinquent loans exceeding expectations. This has led to favorable reserve development and lower-than-expected losses on prior delinquencies.
          • Capital management focus: MGIC prioritized returning excess capital to shareholders through share repurchases and dividends, as organic growth opportunities remain scarce. The Board approved a 15% dividend increase, and management signaled that elevated payout ratios could continue as long as capital generation outpaces growth needs.
          • Expense discipline highlighted: Operating expenses declined year-over-year, aided by ongoing efficiency initiatives. Management called out accounting charges related to pension plan settlements, but reaffirmed their annual expense guidance and commitment to operational cost control.
          • Dynamic pricing and geographic diversification: Management emphasized the importance of risk-based pricing, allowing for rapid adjustments in response to regional housing market shifts. The portfolio's geographic diversity was highlighted as a mitigating factor against localized housing price declines.

          Drivers of Future Performance

          MGIC Investment’s outlook hinges on persistent housing market challenges, capital allocation, and evolving credit trends.

          • Limited growth in insurance in force: Management expects ongoing housing affordability challenges and high interest rates to keep new insurance growth subdued. As a result, the company anticipates insurance in force and persistency rates will remain relatively flat for the remainder of the year.
          • Elevated capital return to shareholders: With fewer opportunities to deploy capital into organic growth, MGIC plans to maintain above-average share repurchases and dividends. Management cautioned that payout levels are subject to ongoing credit performance and regulatory requirements, but signaled a willingness to sustain current return ratios while excess capital persists.
          • Monitoring credit quality and regional trends: While the current credit environment remains favorable, management is closely tracking delinquency rates and regional differences in home price growth. The company’s risk-based pricing model and diversified portfolio are expected to help mitigate any localized deterioration, but a shift in broader market trends remains a key risk factor.

          Catalysts in Upcoming Quarters

          In the coming quarters, the StockStory team will be watching (1) whether MGIC Investment can maintain strong credit performance amid potential increases in delinquencies, (2) management’s ability to sustain elevated capital returns in the absence of portfolio growth, and (3) any signs of improvement or further deterioration in the U.S. housing market, especially in regions experiencing shifting supply-demand dynamics. Execution on expense control and the impact of further regulatory changes will also inform our view.

          MGIC Investment currently trades at $27.52, up from $25.40 just before the earnings. In the wake of this quarter, is it a buy or sell? See for yourself in our full research report (it’s free).

          High Quality Stocks for All Market Conditions

          Donald Trump’s April 2025 "Liberation Day" tariffs sent markets into a tailspin, but stocks have since rebounded strongly, proving that knee-jerk reactions often create the best buying opportunities.

          The smart money is already positioning for the next leg up. Don’t miss out on the recovery - check out our Top 5 Growth Stocks for this month. This is a curated list of our High Quality stocks that have generated a market-beating return of 183% over the last five years (as of March 31st 2025).

          Stocks that made our list in 2020 include now familiar names such as Nvidia (+1,545% between March 2020 and March 2025) as well as under-the-radar businesses like the once-micro-cap company Kadant (+351% five-year return).

          StockStory is growing and hiring equity analyst and marketing roles. Are you a 0 to 1 builder passionate about the markets and AI? See the open roles here.

          Risk Warnings and Disclaimers
          You understand and acknowledge that there is a high degree of risk involved in trading. Following any strategies or investment methods may lead to potential losses. The content on the site is provided by our contributors and analysts for information purposes only. You are solely responsible for determining whether any trading assets, securities, strategy, or any other product is suitable for investing based on your own investment objectives and financial situation.
          Add to Favorites
          Share

          Winners And Losers Of Q2: MGIC Investment (NYSE:MTG) Vs The Rest Of The Property & Casualty Insurance Stocks

          Stock Story
          MGIC Investment
          -0.21%
          Root Inc.
          +1.22%
          Selective Insurance
          +0.97%
          Selective Insurance Group, Inc. Depositary Shares, each representing a 1/1,000th interest in a share of 4.60% Non-Cumulative Preferred Stock, Series B
          +0.74%
          Kinsale Capital
          +0.45%

          MTG Cover Image

          As the Q2 earnings season wraps, let’s dig into this quarter’s best and worst performers in the property & casualty insurance industry, including MGIC Investment and its peers.

          Property & Casualty (P&C) insurers protect individuals and businesses against financial loss from damage to property or from legal liability. This is a cyclical industry, and the sector benefits when there is 'hard market', characterized by strong premium rate increases that outpace loss and cost inflation, resulting in robust underwriting margins. The opposite is true in a 'soft market'. Interest rates also matter, as they determine the yields earned on fixed-income portfolios. On the other hand, P&C insurers face a major secular headwind from the increasing frequency and severity of catastrophe losses due to climate change. Furthermore, the liability side of the business is pressured by 'social inflation'—the trend of rising litigation costs and larger jury awards.

          The 33 property & casualty insurance stocks we track reported a mixed Q2. As a group, revenues beat analysts’ consensus estimates by 1.5%.

          In light of this news, share prices of the companies have held steady as they are up 3.5% on average since the latest earnings results.

          MGIC Investment

          Founded in 1957 when the modern mortgage insurance industry was in its infancy, MGIC Investment provides private mortgage insurance that protects lenders when homebuyers default on their loans, enabling borrowers to purchase homes with smaller down payments.

          MGIC Investment reported revenues of $304.2 million, flat year on year. This print fell short of analysts’ expectations by 0.6%, but it was still a strong quarter for the company with a beat of analysts’ EPS estimates and net premiums earned in line with analysts’ estimates.

          Tim Mattke, CEO of MTG and Mortgage Guaranty Insurance Corporation ("MGIC") said, "For the second quarter we earned net income of $192.5 million and recorded an annualized 15% return on equity building upon the momentum we've maintained over the past few years.

          MGIC Investment Total Revenue

          Interestingly, the stock is up 8.3% since reporting and currently trades at $27.52.

          Is now the time to buy MGIC Investment? Access our full analysis of the earnings results here, it’s free.

          Best Q2: Root

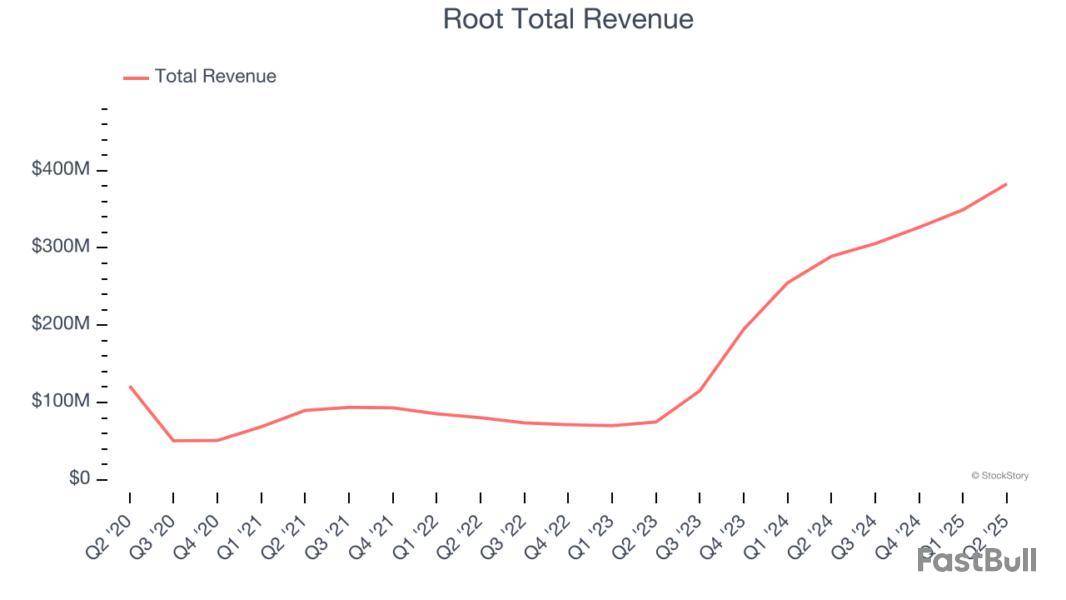
          Pioneering a data-driven approach that rewards good driving habits, Root is a technology-driven auto insurance company that uses mobile apps to acquire customers and data science to price policies based on individual driving behavior.

          Root reported revenues of $382.9 million, up 32.4% year on year, outperforming analysts’ expectations by 7.5%. The business had an incredible quarter with a beat of analysts’ EPS estimates and a solid beat of analysts’ net premiums earned estimates.

          Root Total Revenue

          Although it had a fine quarter compared its peers, the market seems unhappy with the results as the stock is down 26.9% since reporting. It currently trades at $90.

          Is now the time to buy Root? Access our full analysis of the earnings results here, it’s free.

          Weakest Q2: Selective Insurance Group

          Founded in 1926 during the early days of automobile insurance, Selective Insurance Group is a property and casualty insurance company that sells commercial, personal, and excess and surplus lines insurance products through independent agents.

          Selective Insurance Group reported revenues of $127.9 million, down 89.3% year on year, falling short of analysts’ expectations by 90.3%. It was a disappointing quarter as it posted a significant miss of analysts’ EPS estimates and a significant miss of analysts’ book value per share estimates.

          Selective Insurance Group delivered the weakest performance against analyst estimates and slowest revenue growth in the group. As expected, the stock is down 13.4% since the results and currently trades at $78.35.

          Read our full analysis of Selective Insurance Group’s results here.

          Kinsale Capital Group

          Founded in 2009 during the aftermath of the financial crisis when many insurers were retreating from riskier markets, Kinsale Capital Group is an insurance company that specializes in writing policies for hard-to-place, unusual, or high-risk businesses that standard insurers typically avoid.

          Kinsale Capital Group reported revenues of $469.8 million, up 22.2% year on year. This print surpassed analysts’ expectations by 8.2%. Zooming out, it was a satisfactory quarter as it also recorded a solid beat of analysts’ net premiums earned estimates but a slight miss of analysts’ book value per share estimates.

          The stock is down 7.6% since reporting and currently trades at $436.98.

          Read our full, actionable report on Kinsale Capital Group here, it’s free.

          CNA Financial

          With roots dating back to 1853 and majority ownership by Loews Corporation, CNA Financial is a commercial property and casualty insurance provider offering coverage for businesses, including professional liability, surety bonds, and specialized risk management services.

          CNA Financial reported revenues of $3.72 billion, up 5.6% year on year. This result missed analysts’ expectations by 0.8%. In spite of that, it was a very strong quarter as it put up a beat of analysts’ EPS estimates.

          The stock is up 8.4% since reporting and currently trades at $47.52.

          Read our full, actionable report on CNA Financial here, it’s free.

          Market Update

          The Fed’s interest rate hikes throughout 2022 and 2023 have successfully cooled post-pandemic inflation, bringing it closer to the 2% target. Inflationary pressures have eased without tipping the economy into a recession, suggesting a soft landing. This stability, paired with recent rate cuts (0.5% in September 2024 and 0.25% in November 2024), fueled a strong year for the stock market in 2024. The markets surged further after Donald Trump’s presidential victory in November, with major indices reaching record highs in the days following the election. Still, questions remain about the direction of economic policy, as potential tariffs and corporate tax changes add uncertainty for 2025.

          Risk Warnings and Disclaimers
          You understand and acknowledge that there is a high degree of risk involved in trading. Following any strategies or investment methods may lead to potential losses. The content on the site is provided by our contributors and analysts for information purposes only. You are solely responsible for determining whether any trading assets, securities, strategy, or any other product is suitable for investing based on your own investment objectives and financial situation.
          Add to Favorites
          Share

          3 Hyped Up Stocks Walking a Fine Line

          Stock Story
          Teledyne Technologies
          -0.42%
          Ryder System
          -0.30%
          MGIC Investment
          -0.21%

          TDY Cover Image

          Each stock in this article is trading near its 52-week high. These elevated prices usually indicate some degree of investor confidence, business improvements, or favorable market conditions.

          But not every company with momentum is a long-term winner, and plenty of investors have lost money betting on short-term fads. Keeping that in mind, here are three stocks getting more buzz than they deserve and some you should buy instead.

          Teledyne (TDY)

          One-Month Return: +1%

          Playing a role in mapping the ocean floor as we know it today, Teledyne offers digital imaging and instrumentation products for various industries.

          Why Are We Wary of TDY?

          • Organic revenue growth fell short of our benchmarks over the past two years and implies it may need to improve its products, pricing, or go-to-market strategy
          • Free cash flow margin shrank by 2.5 percentage points over the last five years, suggesting the company is consuming more capital to stay competitive
          • Below-average returns on capital indicate management struggled to find compelling investment opportunities

          Teledyne’s stock price of $542.03 implies a valuation ratio of 24x forward P/E. Dive into our free research report to see why there are better opportunities than TDY.

          Ryder (R)

          One-Month Return: -0.3%

          As one of the first companies to introduce the idea of leasing trucks, Ryder provides rental vehicles to businesses and delivers packages directly to homes or businesses.

          Why Do We Steer Clear of R?

          • Annual sales growth of 3% over the last two years lagged behind its industrials peers as its large revenue base made it difficult to generate incremental demand
          • Earnings per share have dipped by 7.4% annually over the past two years, which is concerning because stock prices follow EPS over the long term
          • Free cash flow margin dropped by 9.5 percentage points over the last five years, implying the company became more capital intensive as competition picked up

          At $173.91 per share, Ryder trades at 12.3x forward P/E. Check out our free in-depth research report to learn more about why R doesn’t pass our bar.

          MGIC Investment (MTG)

          One-Month Return: +7%

          Founded in 1957 when the modern mortgage insurance industry was in its infancy, MGIC Investment provides private mortgage insurance that protects lenders when homebuyers default on their loans, enabling borrowers to purchase homes with smaller down payments.

          Why Is MTG Not Exciting?

          • Insurance products are facing significant market challenges during this cycle as net premiums earned has declined by 1.3% annually over the last five years
          • Day-to-day expenses have swelled relative to revenue over the last two years as its combined ratio increased by 10.7 percentage points
          • Earnings per share lagged its peers over the last two years as they only grew by 6.1% annually

          MGIC Investment is trading at $27.33 per share, or 1.2x forward P/B. If you’re considering MTG for your portfolio, see our FREE research report to learn more.

          Stocks We Like More

          Donald Trump’s April 2025 "Liberation Day" tariffs sent markets into a tailspin, but stocks have since rebounded strongly, proving that knee-jerk reactions often create the best buying opportunities.

          The smart money is already positioning for the next leg up. Don’t miss out on the recovery - check out our Top 6 Stocks for this week. This is a curated list of our High Quality stocks that have generated a market-beating return of 183% over the last five years (as of March 31st 2025).

          Stocks that made our list in 2020 include now familiar names such as Nvidia (+1,545% between March 2020 and March 2025) as well as under-the-radar businesses like the once-micro-cap company Tecnoglass (+1,754% five-year return).

          StockStory is growing and hiring equity analyst and marketing roles. Are you a 0 to 1 builder passionate about the markets and AI? See the open roles here.

          Risk Warnings and Disclaimers
          You understand and acknowledge that there is a high degree of risk involved in trading. Following any strategies or investment methods may lead to potential losses. The content on the site is provided by our contributors and analysts for information purposes only. You are solely responsible for determining whether any trading assets, securities, strategy, or any other product is suitable for investing based on your own investment objectives and financial situation.
          Add to Favorites
          Share

          Dj Ceo Mattke Sells 139203 Of Mgic Investment Corp >Mtg

          Reuters
          MGIC Investment
          -0.21%
          Risk Warnings and Disclaimers
          You understand and acknowledge that there is a high degree of risk involved in trading. Following any strategies or investment methods may lead to potential losses. The content on the site is provided by our contributors and analysts for information purposes only. You are solely responsible for determining whether any trading assets, securities, strategy, or any other product is suitable for investing based on your own investment objectives and financial situation.
          Add to Favorites
          Share

          Dj Ceo Mattke Registers 139203 Of Mgic Investment Corp >Mtg

          Reuters
          MGIC Investment
          -0.21%
          Risk Warnings and Disclaimers
          You understand and acknowledge that there is a high degree of risk involved in trading. Following any strategies or investment methods may lead to potential losses. The content on the site is provided by our contributors and analysts for information purposes only. You are solely responsible for determining whether any trading assets, securities, strategy, or any other product is suitable for investing based on your own investment objectives and financial situation.
          Add to Favorites
          Share
          FastBull
          Copyright © 2025 FastBull Ltd

          728 RM B 7/F GEE LOK IND BLDG NO 34 HUNG TO RD KWUN TONG KLN HONG KONG

          TelegramInstagramTwitterfacebooklinkedin
          App Store Google Play Google Play
          Products
          Charts

          Chats

          Q&A with Experts
          Screeners
          Economic Calendar
          Data
          Tools
          Membership
          Features
          Function
          Markets
          Copy Trading
          Latest Signals
          Contests
          News
          Analysis
          24/7
          Columns
          Education
          Company
          Careers
          About Us
          Contact Us
          Advertising
          Help Center
          Feedback
          User Agreement
          Privacy Policy
          Business

          White Label

          Data API

          Web Plug-ins

          Poster Maker

          Affiliate Program

          Risk Disclosure

          The risk of loss in trading financial instruments such as stocks, FX, commodities, futures, bonds, ETFs and crypto can be substantial. You may sustain a total loss of the funds that you deposit with your broker. Therefore, you should carefully consider whether such trading is suitable for you in light of your circumstances and financial resources.

          No decision to invest should be made without thoroughly conducting due diligence by yourself or consulting with your financial advisors. Our web content might not suit you since we don't know your financial conditions and investment needs. Our financial information might have latency or contain inaccuracy, so you should be fully responsible for any of your trading and investment decisions. The company will not be responsible for your capital loss.

          Without getting permission from the website, you are not allowed to copy the website's graphics, texts, or trademarks. Intellectual property rights in the content or data incorporated into this website belong to its providers and exchange merchants.

          Not Logged In

          Log in to access more features

          FastBull Membership

          Not yet

          Purchase

          Become a signal provider
          Help Center
          Customer Service
          Dark Mode
          Price Up/Down Colors

          Log In

          Sign Up

          Position
          Layout
          Fullscreen
          Default to Chart
          The chart page opens by default when you visit fastbull.com