

Markets
News
Analysis
User
24/7
Economic Calendar
Education
Data
- Names
- Latest
- Prev


Signal Accounts for Members
All Signal Accounts
All Contests
 U.S. U6 Unemployment Rate (SA) (Nov)
A:--
F: --
P: --
U.S. Average Hourly Wage MoM (SA) (Oct)A:--
F: --
P: --
U.S. Average Hourly Wage YoY (Oct)A:--
F: --
P: --
U.S. Retail Sales (Oct)A:--
F: --
P: --
U.S. Core Retail Sales MoM (Oct)A:--
F: --
U.S. Core Retail Sales (Oct)A:--
F: --
P: --
U.S. Retail Sales MoM (Oct)A:--
F: --
U.S. Private Nonfarm Payrolls (SA) (Oct)A:--
F: --
U.S. Average Weekly Working Hours (SA) (Oct)A:--
F: --
P: --
U.S. Labor Force Participation Rate (SA) (Nov)A:--
F: --
P: --
U.S. Retail Sales YoY (Oct)A:--
F: --
P: --
U.S. Manufacturing Employment (SA) (Oct)A:--
F: --
U.S. Government Employment (Nov)A:--
F: --
P: --
U.S. Weekly Redbook Index YoYA:--
F: --
P: --
U.S. IHS Markit Manufacturing PMI Prelim (SA) (Dec)A:--
F: --
P: --
U.S. IHS Markit Composite PMI Prelim (SA) (Dec)A:--
F: --
P: --
U.S. IHS Markit Services PMI Prelim (SA) (Dec)A:--
F: --
P: --
U.S. Commercial Inventory MoM (Sept)A:--
F: --
P: --
 BOC Gov Macklem Speaks
 Argentina GDP YoY (Constant Prices) (Q3)
A:--
F: --
P: --
U.S. API Weekly Gasoline StocksA:--
F: --
P: --
U.S. API Weekly Cushing Crude Oil StocksA:--
F: --
P: --
U.S. API Weekly Refined Oil StocksA:--
F: --
P: --
U.S. API Weekly Crude Oil StocksA:--
F: --
P: --
 Australia Westpac Leading Index MoM (Nov)
A:--
F: --
 Japan Trade Balance (Not SA) (Nov)
A:--
F: --
P: --
Japan Goods Trade Balance (SA) (Nov)A:--
F: --
P: --
Japan Imports YoY (Nov)A:--
F: --
P: --
Japan Exports YoY (Nov)A:--
F: --
P: --
Japan Core Machinery Orders YoY (Oct)A:--
F: --
P: --
Japan Core Machinery Orders MoM (Oct)A:--
F: --
P: --
 U.K. Core CPI MoM (Nov)
--
F: --
P: --
U.K. Inflation Rate Expectations--
F: --
P: --
U.K. Core Retail Prices Index YoY (Nov)--
F: --
P: --
U.K. Core CPI YoY (Nov)--
F: --
P: --
U.K. Output PPI MoM (Not SA) (Nov)--
F: --
P: --
U.K. Output PPI YoY (Not SA) (Nov)--
F: --
P: --
U.K. Input PPI YoY (Not SA) (Nov)--
F: --
P: --
U.K. CPI YoY (Nov)--
F: --
P: --
U.K. Retail Prices Index MoM (Nov)--
F: --
P: --
U.K. CPI MoM (Nov)--
F: --
P: --
U.K. Input PPI MoM (Not SA) (Nov)--
F: --
P: --
U.K. Retail Prices Index YoY (Nov)--
F: --
P: --
 Indonesia 7-Day Reverse Repo Rate
--
F: --
P: --
Indonesia Deposit Facility Rate (Dec)--
F: --
P: --
Indonesia Lending Facility Rate (Dec)--
F: --
P: --
Indonesia Loan Growth YoY (Nov)--
F: --
P: --
 South Africa Core CPI YoY (Nov)
--
F: --
P: --
South Africa CPI YoY (Nov)--
F: --
P: --
 Germany Ifo Business Expectations Index (SA) (Dec)
--
F: --
P: --
Germany Ifo Current Business Situation Index (SA) (Dec)--
F: --
P: --
Germany IFO Business Climate Index (SA) (Dec)--
F: --
P: --
 Euro Zone Core CPI Final MoM (Nov)
--
F: --
P: --
Euro Zone Labor Cost YoY (Q3)--
F: --
P: --
Euro Zone Core HICP Final YoY (Nov)--
F: --
P: --
Euro Zone Core HICP Final MoM (Nov)A:--
F: --
P: --

No matching data
Latest Views
Latest Views
Trending Topics
Top Columnists
Latest Update
White Label
Data API
Web Plug-ins
Affiliate Program
View All
No data
Inogen, Inc. INGN incurred an adjusted loss per share of 2 cents for third-quarter 2025, which was narrower than the adjusted loss per share of 11 cents in the year-ago period and the Zacks Consensus Estimate of a loss of 22 cents per share.
GAAP loss per share for the quarter was 20 cents, narrower than the year-earlier loss of 25cents.
INGN’s Revenues in Detail
Inogen registered revenues of $92.4 million for the third quarter, up 4% year over year. However, the figure missed the Zacks Consensus Estimate by 0.1%.
At the constant exchange rate (CER), total revenues for the reported quarter increased 2.7% year over year.
Per management, the year-over-year uptick in the top line was primarily driven by continued higher demand from international and domestic business-to-business customers. However, this increase was partially offset by lower direct-to-consumer and rental revenue.
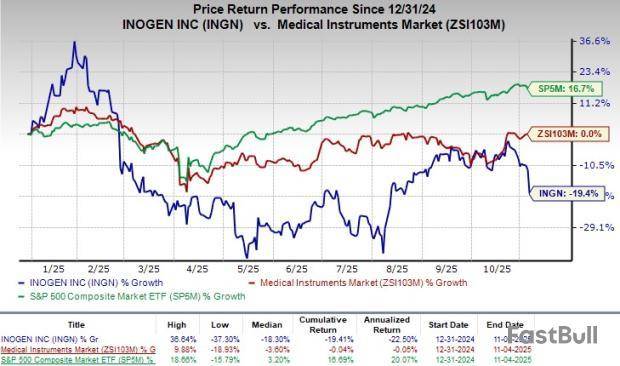
Shares of this company lost nearly 8.3% in yesterday’s trading. The company’s shares have plunged 19.4% in the year-to-date period compared with the industry’s flat growth. The broader S&P 500 Index has increased 16.7% in the same time frame.
Inogen’s Segmental Details
Inogen derives revenues from two sources — rental and sales.
Rental revenues for the reported quarter grossed $13.3 million, down 4.4% from the year-ago period both on a reported basis and at CER. Per management, the decrease resulted from continued lower average billing rates due to the mixed shift to private payers.
Sales revenues were $79.1 million, up 5.6% from the prior-year quarter.
INGN’s Revenues by Region & Category
Domestic business-to-business sales for third-quarter 2025 amounted to $24.9 million, up 6.6% on a year-over-year basis. Per management, this was driven by increased demand from new customers and resellers.
International business-to-business sales for the reported quarter amounted to $38.4 million, up 18.8% year over year on a reported basis and up 15.3%at CER. Per management, this was driven by an increase in demand from new and existing customers.
Domestic direct-to-consumer sales decreased 17.9% year over year to $15.8 million for the quarter.
Inogen’s Margins
In the quarter under review, Inogen’s adjusted gross profit declined 0.7% from the year-ago period to $44.3 million. The adjusted gross margin contracted 230 basis points to 47.9%.
Sales and marketing expenses decreased 3.5% from the year-ago quarter to $25.4 million. Research and development expenses increased 37.6% year over year to $4.8 million, while general and administrative expenses decreased 5.7% year over year to $18.2 million. Adjusted operating expenses of $43.6 million declined 4.8% year over year.
Adjusted operating loss totaled $2.3 million compared with the prior-year quarter’s $4.4 million.
Inogen, Inc Price, Consensus and EPS Surprise
Inogen, Inc price-consensus-eps-surprise-chart | Inogen, Inc Quote
INGN’s Financial Position
Inogen exited the third quarter of 2025 with cash and cash equivalents of $106.5 million compared with $103.7 million at the end of the second quarter of 2025.
The company ended the quarter with no debt on its balance sheet.
Cumulative net cash used in operating activities at the end of third-quarter 2025 was $10.3 million against the net cash provided by operating activities of $8.9 million a year ago.
Inogen’s Guidance
Inogen has provided its revenue outlook for the fourth quarter and 2025.
For the fourth quarter of 2025, Inogen expects revenues in the range of $87 million-$90 million (reflecting growth of approximately 10% at the midpoint of the range from the comparable fourth-quarter 2024 revenues). The Zacks Consensus Estimate is currently pegged at $89.4 million.
For 2025, Inogen has reiterated revenues in the range of $354 million-$357 million (reflecting approximately 6% growth at the midpoint of the range from the comparable 2024 revenues). The Zacks Consensus Estimate is currently pegged at $356.5 million.
Our Take
Inogen exited the third quarter of 2025 with a narrower-than-expected loss per share and better-than-expected revenues. Solid year-over-year top-line and bottom-line performances were encouraging. The robust year-over-year uptick in domestic and international business-to-business sales was impressive. The lowering of the adjusted operating expenses also bodes well.
During the quarter, Inogen advanced its innovation roadmap with the commercial launch of the Voxi 5, a new stationary oxygen concentrator developed in partnership with UL Medical. The company highlighted strong early market reception, particularly within its B2B channel, where it previously lacked a stationary solution, marking a meaningful expansion of its respiratory care portfolio. Voxi 5 delivers 1–5 liters per minute of continuous flow oxygen in a compact, quiet design, enabling Inogen to serve home-care patients better and strengthen DME partner relationships.
In parallel, Inogen initiated a limited U.S. market release of Simeox, its bronchial-decongestion solution, as it builds prescriber familiarity and clinical support ahead of broader commercialization. Clinical trials in Europe and China are also underway to advance reimbursement and registration pathways, positioning Simeox as a differentiated future growth driver across global respiratory care markets.
Yet, a decline in domestic direct-to-consumer salesand rentalrevenues was concerning. Inogen continued to incur operating losses in the third quarter, which did not bode well.
INGN’s Zacks Rank and Key Picks
Inogen currently has a Zacks Rank #3 (Hold).
Some better-ranked stocks in the broader medical space that have announced quarterly results are Boston Scientific Corporation BSX, West Pharmaceutical Services, Inc. WST and Exact Sciences Corporation EXAS.
Boston Scientific, carrying a Zacks Rank of 2 (Buy), reported third-quarter 2025 adjusted EPS of 75 cents, beating the Zacks Consensus Estimate by 5.6%. Revenues of $5.07 billion outpaced the consensus mark by 1.9%. You can see the complete list of today’s Zacks #1 Rank (Strong Buy) stocks here.
Boston Scientific has a long-term estimated growth rate of 16.4%. BSX’s earnings surpassed estimates in each of the trailing four quarters, the average surprise being 7.4%.
West Pharmaceutical reported third-quarter 2025 adjusted EPS of $1.96, beating the Zacks Consensus Estimate by 17.4%. Revenues of $804.6 million surpassed the Zacks Consensus Estimate by 2.4%. It currently carries a Zacks Rank #2.
West Pharmaceutical has a long-term estimated growth rate of 9.8%. WST’s earnings surpassed estimates in each of the trailing four quarters, the average surprise being 15.5%.
Exact Sciences reported third-quarter 2025 adjusted EPS of 24 cents, beating the Zacks Consensus Estimate by 84.6%. Revenues of $850.7 million surpassed the Zacks Consensus Estimate by 4.9%. It currently sports a Zacks Rank #1.
Exact Sciences has a long-term estimated growth rate of 30.1%. EXAS’ earnings surpassed estimates in each of the trailing four quarters, the average surprise being 352.3%.
This article originally published on Zacks Investment Research (zacks.com).
Zacks Investment Research
Revenue grew 4.0% in Q3 2025, driven by strong business-to-business sales, while net loss improved 11.2% year-over-year. Cash position remains strong at $106.5 million, and a strategic partnership with Yuwell expanded the product portfolio and market reach.
Original document: Inogen, Inc [INGN] SEC 10-Q Quarterly Report — Nov. 5 2025
Q3 2025 saw 4% revenue growth, positive adjusted EBITDA, and improved adjusted net loss. International B2B sales were strong, while direct-to-consumer segments declined. Full-year revenue guidance was reiterated and adjusted EBITDA outlook raised.
Original document: Inogen, Inc [INGN] SEC 8-K Current Report — Nov. 5 2025
728 RM B 7/F GEE LOK IND BLDG NO 34 HUNG TO RD KWUN TONG KLN HONG KONG


White Label
Data API
Web Plug-ins
Poster Maker
Affiliate Program
The risk of loss in trading financial instruments such as stocks, FX, commodities, futures, bonds, ETFs and crypto can be substantial. You may sustain a total loss of the funds that you deposit with your broker. Therefore, you should carefully consider whether such trading is suitable for you in light of your circumstances and financial resources.
No decision to invest should be made without thoroughly conducting due diligence by yourself or consulting with your financial advisors. Our web content might not suit you since we don't know your financial conditions and investment needs. Our financial information might have latency or contain inaccuracy, so you should be fully responsible for any of your trading and investment decisions. The company will not be responsible for your capital loss.
Without getting permission from the website, you are not allowed to copy the website's graphics, texts, or trademarks. Intellectual property rights in the content or data incorporated into this website belong to its providers and exchange merchants.
Not Logged In
Log in to access more features

FastBull Membership
Not yet
Purchase


Log In
Sign Up


