

Markets
News
Analysis
User
24/7
Economic Calendar
Education
Data
- Names
- Latest
- Prev


Signal Accounts for Members
All Signal Accounts
All Contests
 U.K. Trade Balance (Oct)
A:--
F: --
P: --
U.K. Services Index MoMA:--
F: --
P: --
U.K. Construction Output MoM (SA) (Oct)A:--
F: --
P: --
U.K. Industrial Output YoY (Oct)A:--
F: --
P: --
U.K. Trade Balance (SA) (Oct)A:--
F: --
P: --
U.K. Trade Balance EU (SA) (Oct)A:--
F: --
P: --
U.K. Manufacturing Output YoY (Oct)A:--
F: --
P: --
U.K. GDP MoM (Oct)A:--
F: --
P: --
U.K. GDP YoY (SA) (Oct)A:--
F: --
P: --
U.K. Industrial Output MoM (Oct)A:--
F: --
P: --
U.K. Construction Output YoY (Oct)A:--
F: --
P: --
 France HICP Final MoM (Nov)
A:--
F: --
P: --
 China, Mainland Outstanding Loans Growth YoY (Nov)
A:--
F: --
P: --
China, Mainland M2 Money Supply YoY (Nov)A:--
F: --
P: --
China, Mainland M0 Money Supply YoY (Nov)A:--
F: --
P: --
China, Mainland M1 Money Supply YoY (Nov)A:--
F: --
P: --
 India CPI YoY (Nov)
A:--
F: --
P: --
India Deposit Gowth YoYA:--
F: --
P: --
 Brazil Services Growth YoY (Oct)
A:--
F: --
P: --
 Mexico Industrial Output YoY (Oct)
A:--
F: --
P: --
 Russia Trade Balance (Oct)
A:--
F: --
P: --
 Philadelphia Fed President Henry Paulson delivers a speech
 Canada Building Permits MoM (SA) (Oct)
A:--
F: --
P: --
Canada Wholesale Sales YoY (Oct)A:--
F: --
P: --
Canada Wholesale Inventory MoM (Oct)A:--
F: --
P: --
Canada Wholesale Inventory YoY (Oct)A:--
F: --
P: --
Canada Wholesale Sales MoM (SA) (Oct)A:--
F: --
P: --
 Germany Current Account (Not SA) (Oct)
A:--
F: --
P: --
U.S. Weekly Total Rig CountA:--
F: --
P: --
U.S. Weekly Total Oil Rig CountA:--
F: --
P: --
 Japan Tankan Large Non-Manufacturing Diffusion Index (Q4)
--
F: --
P: --
Japan Tankan Small Manufacturing Outlook Index (Q4)--
F: --
P: --
Japan Tankan Large Non-Manufacturing Outlook Index (Q4)--
F: --
P: --
Japan Tankan Large Manufacturing Outlook Index (Q4)--
F: --
P: --
Japan Tankan Small Manufacturing Diffusion Index (Q4)--
F: --
P: --
Japan Tankan Large Manufacturing Diffusion Index (Q4)--
F: --
P: --
Japan Tankan Large-Enterprise Capital Expenditure YoY (Q4)--
F: --
P: --
U.K. Rightmove House Price Index YoY (Dec)--
F: --
P: --
China, Mainland Industrial Output YoY (YTD) (Nov)--
F: --
P: --
China, Mainland Urban Area Unemployment Rate (Nov)--
F: --
P: --
 Saudi Arabia CPI YoY (Nov)
--
F: --
P: --
 Euro Zone Industrial Output YoY (Oct)
--
F: --
P: --
Euro Zone Industrial Output MoM (Oct)--
F: --
P: --
Canada Existing Home Sales MoM (Nov)--
F: --
P: --
Euro Zone Total Reserve Assets (Nov)--
F: --
P: --
U.K. Inflation Rate Expectations--
F: --
P: --
Canada National Economic Confidence Index--
F: --
P: --
Canada New Housing Starts (Nov)--
F: --
P: --
U.S. NY Fed Manufacturing Employment Index (Dec)--
F: --
P: --
U.S. NY Fed Manufacturing Index (Dec)--
F: --
P: --
Canada Core CPI YoY (Nov)--
F: --
P: --
Canada Manufacturing Unfilled Orders MoM (Oct)--
F: --
P: --
Canada Manufacturing New Orders MoM (Oct)--
F: --
P: --
Canada Core CPI MoM (Nov)--
F: --
P: --
Canada Manufacturing Inventory MoM (Oct)--
F: --
P: --
Canada CPI YoY (Nov)--
F: --
P: --
Canada CPI MoM (Nov)--
F: --
P: --
Canada CPI YoY (SA) (Nov)--
F: --
P: --
Canada Core CPI MoM (SA) (Nov)--
F: --
P: --
Canada CPI MoM (SA) (Nov)--
F: --
P: --

No matching data
Latest Views
Latest Views
Trending Topics
Top Columnists
Latest Update
White Label
Data API
Web Plug-ins
Affiliate Program
View All
No data
Kimberly-Clark Corporation KMB is likely to register top and bottom-line declines when it reports first-quarter 2025 earnings on April 22. The Zacks Consensus Estimate for revenues is pegged at $4.9 billion. The figure indicates a 5.5% decrease from the year-ago quarter.
The Zacks Consensus Estimate for quarterly earnings has moved down by 2 cents in the past 30 days to $1.89 per share, indicating a dip of 6% from the year-ago quarter’s reported figure. KMB delivered a trailing four-quarter earnings surprise of 12.5%, on average. (Stay up-to-date with all quarterly releases: See Zacks Earnings Calendar.)
Kimberly-Clark Corporation Price, Consensus and EPS Surprise
Kimberly-Clark Corporation price-consensus-eps-surprise-chart | Kimberly-Clark Corporation Quote
Things to Know About KMB’s Upcoming Results
Kimberly-Clark is navigating a dynamic consumer and retail environment, where soft demand and ongoing retail inventory reductions have been weighing on its performance. As a result, our model expects sales decline of 0.9%, 12.5% and 8.8% from North America, International Personal Care and International Family Care & Professional segments, respectively, in the to-be-reported quarter.
Kimberly-Clark’s exit from private label creates a near-term revenue headwind, as strategic pullbacks are likely to have put pressure on the top line. In addition, the lingering effects of retailer destocking are likely to have dampened shipment volumes, adding to transitional challenges.
Cost pressures remain elevated, with higher pulp prices and limited pricing flexibility compressing margins. Our model expects first-quarter fiscal 2025 adjusted gross profit of $1,801.3 million, down from $1,911 million reported in the year-ago quarter.
Yet, Kimberly-Clark is on track with its Powering Care Strategy, which focuses on growth, operational efficiency and organizational alignment. Gains from volume-and-mix-led growth model, supported by innovation and increased adoption of premium products, are likely to have offered some respite in the to-be-reported quarter’s performance.
What the Zacks Model Predicts for KMB
Our proven model does not conclusively predict an earnings beat for Kimberly-Clark this time. The combination of a positive Earnings ESP and a Zacks Rank #1 (Strong Buy), 2 (Buy) or 3 (Hold) increases the odds of an earnings beat. However, that is not the case here.
Kimberly-Clark has a Zacks Rank #2 and an Earnings ESP of -0.73%. You can uncover the best stocks to buy or sell before they’re reported with our Earnings ESP Filter.
Stocks With the Favorable Combination
Here are some companies worth considering, as our model shows that these have the right combination of elements to beat on earnings this reporting cycle.
BJ's Wholesale Club Holdings, Inc. BJ currently has an Earnings ESP of +2.09% and a Zacks Rank of 2. You can see the complete list of today’s Zacks #1 Rank stocks here.
The Zacks Consensus Estimate for first quarter fiscal 2025 earnings per share (EPS) is pegged at 91 cents, which implies a 7.1% increase year over year. The Zacks Consensus Estimate for BJ's Wholesale Club’s quarterly revenues is pegged at $5.2 billion, which indicates growth of 5.3% from the figure reported in the prior-year quarter. BJ delivered a trailing four-quarter earnings surprise of 12%, on average.
Tyson Foods, Inc. TSN currently has an Earnings ESP of +2.35% and a Zacks Rank of 3. The Zacks Consensus Estimate for second-quarter fiscal 2025 EPS is pegged at 85 cents, which implies a 37.1% increase year over year.
The Zacks Consensus Estimate for Tyson Foods’ quarterly revenues is pegged at $13.1 billion, which indicates growth of 0.2% from the figure reported in the prior-year quarter. TSN delivered a trailing four-quarter earnings surprise of 52%, on average.
Freshpet, Inc. FRPT currently has an Earnings ESP of +2.56% and a Zacks Rank of 3. The Zacks Consensus Estimate for first quarter 2025 EPS is pegged at 13 cents, which implies a 38.1% decrease year over year.
The Zacks Consensus Estimate for Freshpet’s quarterly revenues is pegged at $262.3 million, which indicates growth of 17.2% from the figure reported in the prior-year quarter. FRPT delivered a trailing four-quarter earnings surprise of 78.8%, on average.
This article originally published on Zacks Investment Research (zacks.com).
Zacks Investment Research
The Procter & Gamble Company PG, also known as P&G, is set to report third-quarter fiscal 2025 results on April 24, before the opening bell. The company is expected to have witnessed year-over-year sales and earnings growth in the to-be-reported quarter.
The Zacks Consensus Estimate for fiscal third-quarter revenues is pegged at $20.3 billion, indicating a 0.7% rise from the prior-year quarter’s figure. The consensus mark for PG’s fiscal third-quarter earnings is pegged at $1.55 per share, indicating 2% growth from the year-ago quarter’s actual. The consensus mark has moved down by a penny in the past seven days. (Find the latest EPS estimates and surprises on Zacks Earnings Calendar.)
The Cincinnati, OH-based company has consistently delivered steady earnings, evidenced by its bottom-line beat trend over the past 10 quarters. PG has a trailing four-quarter earnings surprise of 3%, on average, including a 1.08% surprise in the most recent quarter. With this record, the question is whether PG can sustain this momentum.
PG’s Earnings Whispers
Our proven model does not conclusively predict an earnings beat for Procter & Gamble this time around. The combination of a positive Earnings ESP and a Zacks Rank #1 (Strong Buy), 2 (Buy) or 3 (Hold) increases the chances of an earnings beat. But that is not the case here. You can uncover the best stocks to buy or sell before they are reported with our Earnings ESP Filter.
Procter & Gamble has an Earnings ESP of -1.42% and a Zacks Rank of 3. You can see the complete list of today’s Zacks #1 Rank stocks here.
Key Trends to Watch Ahead of PG's Q3 Earnings
Procter & Gamble continues to assert its global market leadership by leveraging its strong brand portfolio to fuel organic sales growth. As a producer of everyday consumer goods, P&G’s recent success reflects its strategic execution and brand power. These ongoing trends are expected to have supported continued organic sales growth in the fiscal third quarter.
PG’s organic sales for the fiscal third quarter are anticipated to have benefited from strong pricing strategies, a favorable product mix and robust segmental performances.
Our model predicts year-over-year organic sales growth of 3.2% for P&G in the third quarter of fiscal 2025. Organic sales are expected to rise 4% each for the Beauty, Health Care and Baby, Feminine & Family Care segments, 3% for the Grooming and 2% for the Fabric & Home Care segment.
P&G has been actively implementing cost-saving initiatives and productivity enhancements to strengthen margins and reinforce its competitive edge. The company's strategic focus on driving efficiency while navigating macroeconomic cost pressures has played a key role in sustaining balanced growth across both revenues and earnings. These ongoing efforts are expected to have aided margins in the to-be-reported quarter.
We expect PG's core gross margin for the fiscal third quarter to have been influenced by significant productivity savings. Our model predicts a year-over-year core gross margin expansion of 150 bps for the to-be-reported quarter.
Procter & Gamble Company (The) Price and EPS Surprise
Procter & Gamble Company (The) price-eps-surprise | Procter & Gamble Company (The) Quote
However, Procter & Gamble continues to navigate several challenges, including market pressures in Greater China, geopolitical tensions and currency volatility. Among these, the situation in Greater China, P&G’s second-largest market, has been particularly pronounced, with a tough macroeconomic climate leading to a notable decline in consumer spending.
The company has also encountered brand-specific headwinds, especially with its flagship beauty brand SK-II, which has faced setbacks linked to its Japanese heritage. Additionally, heightened geopolitical tensions in certain regions have further weighed on consumer sentiment and dampened retail activity, compounding the broader market challenges.
On the last reported quarter’s earnings call, the company expected the global environment to remain volatile and challenging throughout fiscal 2025, relating to input costs, currencies, consumers, competitors, retailers and geopolitical dynamics. These are anticipated to have affected its performance in the fiscal third quarter.
Rising supply-chain costs, inflationary pressures and elevated transportation expenses have been driving up SG&A costs for Procter & Gamble. We estimate core SG&A expenses to grow 3.6% year over year for the fiscal third quarter. As a percentage of sales, core SG&A expenses are expected to increase 10 bps for the fiscal third quarter.
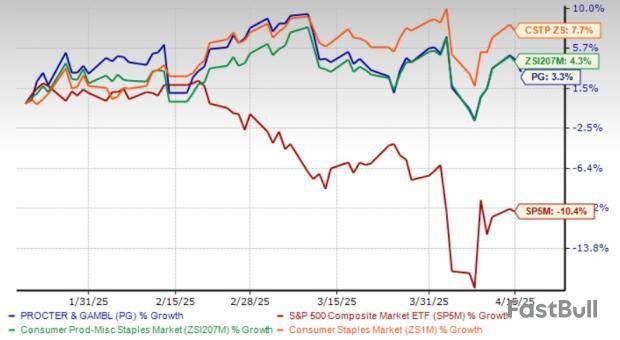
Price Performance & Valuation
PG shares have exhibited an uptrend in the past three months, recording growth of 3.3%. However, the leading consumer goods company’s shares have underperformed the industry and the Zacks Consumer Staples sector’s growth of 4.3% and 7.7%, respectively. Meanwhile, the stock has outperformed the S&P 500’s 10.4% decline.
PG's Three-Month Stock Performance
At the current price of $166.39, Procter & Gamble is trading close to its 52-week low of $153.52. This represents an 8.4% premium to the 52-week low mark.
From the valuation standpoint, PG is trading at a forward 12-month P/E multiple of 23.04X, exceeding the industry average of 20.94X and the S&P 500’s average of 19.85X. Procter & Gamble’s valuation appears quite pricey.
Given the premium valuation, investors could face significant risks if the company's future performance does not meet expectations. The consumer goods market is becoming increasingly competitive, and Procter & Gamble’s innovation and market expansion may not suffice to drive significant growth. Macroeconomic challenges and heightened competition could impede the company's ability to sustain its current growth trajectory.
Stocks With the Favorable Combination
Here are some companies that, according to our model, have the right combination of elements to beat on earnings this reporting cycle.
BJ's Wholesale Club BJ currently has an Earnings ESP of +2.09% and a Zacks Rank of 2. The company is likely to register an increase in the top and bottom line when it reports first-quarter fiscal 2025 numbers. The consensus mark for revenues is pegged at $5.2 billion, which implies growth of 5.3% from the year-ago quarter. You can see the complete list of today’s Zacks #1 Rank stocks here.
The Zacks Consensus Estimate for BJ’s quarterly earnings has moved up a penny in the past 30 days to 91 cents per share, indicating an increase of 7.1% from the prior-year quarter. BJ delivered an earnings surprise of 12% in the trailing four quarters, on average.
Church & Dwight Co. CHD currently has an Earnings ESP of +0.66% and a Zacks Rank of 3. The company is expected to register an increase in its top line when it reports first-quarter 2025 numbers. The Zacks Consensus Estimate for CHD’s quarterly revenues is pegged at $1.5 billion, which indicates growth of 0.6% from the prior-year quarter’s figure.
The consensus mark for Church & Dwight’s quarterly earnings has been unchanged in the past 30 days at 89 cents per share. The estimate indicates a decline of 7.3% from the year-ago quarter. CHD delivered an earnings surprise of 9.6% in the trailing four quarters, on average.
Tyson Foods TSN currently has an Earnings ESP of +2.35% and a Zacks Rank of 3. TSN is likely to register top and bottom-line growth when it reports second-quarter fiscal 2025 results. The Zacks Consensus Estimate for its quarterly revenues is pegged at $13.1 billion, indicating 0.2% growth from the figure in the year-ago quarter.
The consensus estimate for Tyson Foods’ fiscal second-quarter earnings is pegged at 85 cents per share, implying 37.1% growth from the year-earlier quarter. The consensus mark has declined 3.4% in the past 30 days. TSN delivered a negative earnings surprise of 52% in the trailing four quarters, on average.
This article originally published on Zacks Investment Research (zacks.com).
Zacks Investment Research
Philip Morris International Inc. PM is likely to register growth in its top and bottom lines when it reports first-quarter 2025 earnings on April 23. The Zacks Consensus Estimate for revenues is pegged at almost $9 billion, implying a 1.8% increase from the prior-year quarter’s reported figure.
The consensus mark for quarterly earnings has remained unchanged in the past 30 days at $1.61 per share, suggesting an increase of 7.3% from the figure reported in the year-ago quarter. PM has a trailing four-quarter earnings surprise of 4%, on average. (Stay up-to-date with all quarterly releases: See Zacks Earnings Calendar.)
Things to Know About PM’s Upcoming Results
Philip Morris’ ability to leverage strong pricing has been a key driver of its revenue and operating income growth. Smokers’ propensity to absorb price increases, given the addictive nature of cigarettes, has enabled the company to sustain revenue growth.
The company has also been benefiting from its significant strides toward a smoke-free future. Smoke-free products accounted for 40% of the company’s net revenues in the fourth quarter of 2024, reflecting the success of IQOS, its leading heat-not-burn device. Key innovations like IQOS ILUMA, ZYN nicotine pouches and VEEV ONE e-vapor have been making strong progress in the company's smoke-free business.
These upsides bode well for the quarter to be reported. The Zacks Consensus Estimate for total smoke-free product revenues (excluding Wellness and Healthcare) for the first quarter is pegged at $3,576.89 million, indicating an increase from $3,296 million recorded in the year-ago period. Apart from this, Philip Morris’ cost-saving measures and strategic initiatives to enhance its margins have been working well.
Philip Morris International Inc. Price and EPS Surprise
Philip Morris International Inc. price-eps-surprise | Philip Morris International Inc. Quote
In its last earnings call, management highlighted that it expects adjusted earnings per share (EPS) in the range of $1.58-$1.63 for the first quarter of 2025. However, volatile currency movements have been a concern for the tobacco giant. The company forecasts a 4-cent unfavorable currency impact on its first-quarter adjusted EPS. Apart from this, strict government regulations, such as mandatory precautionary labels and self-critical advertisements, hinder cigarette consumption.
Earnings Whispers for PM Stock
Our proven model doesn’t conclusively predict an earnings beat for Philip Morris this time. The combination of a positive Earnings ESP and a Zacks Rank #1 (Strong Buy), 2 (Buy) or 3 (Hold) increases the odds of an earnings beat, which is not the case here. You can uncover the best stocks to buy or sell before they’re reported with our Earnings ESP Filter.
Philip Morris currently carries a Zacks Rank #3 and has an Earnings ESP of -1.83%.
Stocks With the Favorable Combination
Here are some other companies worth considering, as our model shows that these also have the right combination of elements to beat on earnings this reporting cycle.
BJ's Wholesale Club Holdings, Inc. BJ currently has an Earnings ESP of +2.09% and a Zacks Rank of 2. The Zacks Consensus Estimate for first-quarter fiscal 2025 earnings per share (EPS) is pegged at 91 cents, which implies a 7.1% increase year over year. You can see the complete list of today’s Zacks #1 Rank stocks here.
The Zacks Consensus Estimate for BJ's Wholesale Club’s quarterly revenues is pegged at $5.2 billion, which indicates growth of 5.3% from the figure reported in the prior-year quarter. BJ has a trailing four-quarter earnings surprise of 12%, on average.
Tyson Foods, Inc. TSN currently has an Earnings ESP of +2.35% and a Zacks Rank of 3. The Zacks Consensus Estimate for second-quarter fiscal 2025 EPS is pegged at 85 cents, which implies a 37.1% increase year over year.
The Zacks Consensus Estimate for Tyson Foods’ quarterly revenues is pegged at $13.1 billion, which indicates growth of 0.2% from the figure reported in the prior-year quarter. TSN has a trailing four-quarter earnings surprise of 52%, on average.
Freshpet, Inc. FRPT currently has an Earnings ESP of +2.56% and a Zacks Rank of 3. The Zacks Consensus Estimate for the first quarter of 2025 EPS is pegged at 13 cents, which implies a 38.1% decrease year over year.
The Zacks Consensus Estimate for Freshpet’s quarterly revenues is pegged at $262.3 million, which indicates growth of 17.2% from the figure reported in the prior-year quarter. FRPT has a trailing four-quarter earnings surprise of 78.8%, on average.
This article originally published on Zacks Investment Research (zacks.com).
Zacks Investment Research
728 RM B 7/F GEE LOK IND BLDG NO 34 HUNG TO RD KWUN TONG KLN HONG KONG


White Label
Data API
Web Plug-ins
Poster Maker
Affiliate Program
The risk of loss in trading financial instruments such as stocks, FX, commodities, futures, bonds, ETFs and crypto can be substantial. You may sustain a total loss of the funds that you deposit with your broker. Therefore, you should carefully consider whether such trading is suitable for you in light of your circumstances and financial resources.
No decision to invest should be made without thoroughly conducting due diligence by yourself or consulting with your financial advisors. Our web content might not suit you since we don't know your financial conditions and investment needs. Our financial information might have latency or contain inaccuracy, so you should be fully responsible for any of your trading and investment decisions. The company will not be responsible for your capital loss.
Without getting permission from the website, you are not allowed to copy the website's graphics, texts, or trademarks. Intellectual property rights in the content or data incorporated into this website belong to its providers and exchange merchants.
Not Logged In
Log in to access more features

FastBull Membership
Not yet
Purchase


Log In
Sign Up


