

Markets
News
Analysis
User
24/7
Economic Calendar
Education
Data
- Names
- Latest
- Prev


Signal Accounts for Members
All Signal Accounts
All Contests
 U.K. Trade Balance (Oct)
A:--
F: --
P: --
U.K. Services Index MoMA:--
F: --
P: --
U.K. Construction Output MoM (SA) (Oct)A:--
F: --
P: --
U.K. Industrial Output YoY (Oct)A:--
F: --
P: --
U.K. Trade Balance (SA) (Oct)A:--
F: --
P: --
U.K. Trade Balance EU (SA) (Oct)A:--
F: --
P: --
U.K. Manufacturing Output YoY (Oct)A:--
F: --
P: --
U.K. GDP MoM (Oct)A:--
F: --
P: --
U.K. GDP YoY (SA) (Oct)A:--
F: --
P: --
U.K. Industrial Output MoM (Oct)A:--
F: --
P: --
U.K. Construction Output YoY (Oct)A:--
F: --
P: --
 France HICP Final MoM (Nov)
A:--
F: --
P: --
 China, Mainland Outstanding Loans Growth YoY (Nov)
A:--
F: --
P: --
China, Mainland M2 Money Supply YoY (Nov)A:--
F: --
P: --
China, Mainland M0 Money Supply YoY (Nov)A:--
F: --
P: --
China, Mainland M1 Money Supply YoY (Nov)A:--
F: --
P: --
 India CPI YoY (Nov)
A:--
F: --
P: --
India Deposit Gowth YoYA:--
F: --
P: --
 Brazil Services Growth YoY (Oct)
A:--
F: --
P: --
 Mexico Industrial Output YoY (Oct)
A:--
F: --
P: --
 Russia Trade Balance (Oct)
A:--
F: --
P: --
 Philadelphia Fed President Henry Paulson delivers a speech
 Canada Building Permits MoM (SA) (Oct)
A:--
F: --
P: --
Canada Wholesale Sales YoY (Oct)A:--
F: --
P: --
Canada Wholesale Inventory MoM (Oct)A:--
F: --
P: --
Canada Wholesale Inventory YoY (Oct)A:--
F: --
P: --
Canada Wholesale Sales MoM (SA) (Oct)A:--
F: --
P: --
 Germany Current Account (Not SA) (Oct)
A:--
F: --
P: --
U.S. Weekly Total Rig CountA:--
F: --
P: --
U.S. Weekly Total Oil Rig CountA:--
F: --
P: --
 Japan Tankan Large Non-Manufacturing Diffusion Index (Q4)
--
F: --
P: --
Japan Tankan Small Manufacturing Outlook Index (Q4)--
F: --
P: --
Japan Tankan Large Non-Manufacturing Outlook Index (Q4)--
F: --
P: --
Japan Tankan Large Manufacturing Outlook Index (Q4)--
F: --
P: --
Japan Tankan Small Manufacturing Diffusion Index (Q4)--
F: --
P: --
Japan Tankan Large Manufacturing Diffusion Index (Q4)--
F: --
P: --
Japan Tankan Large-Enterprise Capital Expenditure YoY (Q4)--
F: --
P: --
U.K. Rightmove House Price Index YoY (Dec)--
F: --
P: --
China, Mainland Industrial Output YoY (YTD) (Nov)--
F: --
P: --
China, Mainland Urban Area Unemployment Rate (Nov)--
F: --
P: --
 Saudi Arabia CPI YoY (Nov)
--
F: --
P: --
 Euro Zone Industrial Output YoY (Oct)
--
F: --
P: --
Euro Zone Industrial Output MoM (Oct)--
F: --
P: --
Canada Existing Home Sales MoM (Nov)--
F: --
P: --
Euro Zone Total Reserve Assets (Nov)--
F: --
P: --
U.K. Inflation Rate Expectations--
F: --
P: --
Canada National Economic Confidence Index--
F: --
P: --
Canada New Housing Starts (Nov)--
F: --
P: --
U.S. NY Fed Manufacturing Employment Index (Dec)--
F: --
P: --
U.S. NY Fed Manufacturing Index (Dec)--
F: --
P: --
Canada Core CPI YoY (Nov)--
F: --
P: --
Canada Manufacturing Unfilled Orders MoM (Oct)--
F: --
P: --
Canada Manufacturing New Orders MoM (Oct)--
F: --
P: --
Canada Core CPI MoM (Nov)--
F: --
P: --
Canada Manufacturing Inventory MoM (Oct)--
F: --
P: --
Canada CPI YoY (Nov)--
F: --
P: --
Canada CPI MoM (Nov)--
F: --
P: --
Canada CPI YoY (SA) (Nov)--
F: --
P: --
Canada Core CPI MoM (SA) (Nov)--
F: --
P: --
Canada CPI MoM (SA) (Nov)--
F: --
P: --

No matching data
Latest Views
Latest Views
Trending Topics
Top Columnists
Latest Update
White Label
Data API
Web Plug-ins
Affiliate Program
View All
No data
Economic uncertainty and a major crypto exchange hack pushed down the total value locked in decentralized finance (DeFi) protocols to $156 billion in the first quarter of 2025, but AI and social apps gained ground with a rise in network users, according to a crypto analytics firm.
“Broader economic uncertainty and lingering aftershocks from the Bybit exploit” were the main contributing factors to the DeFi sector’s 27% quarter-on-quarter fall in TVL, according to an April 3 report from DappRadar, which noted that Ether fell 45% to $1,820 over the same period.
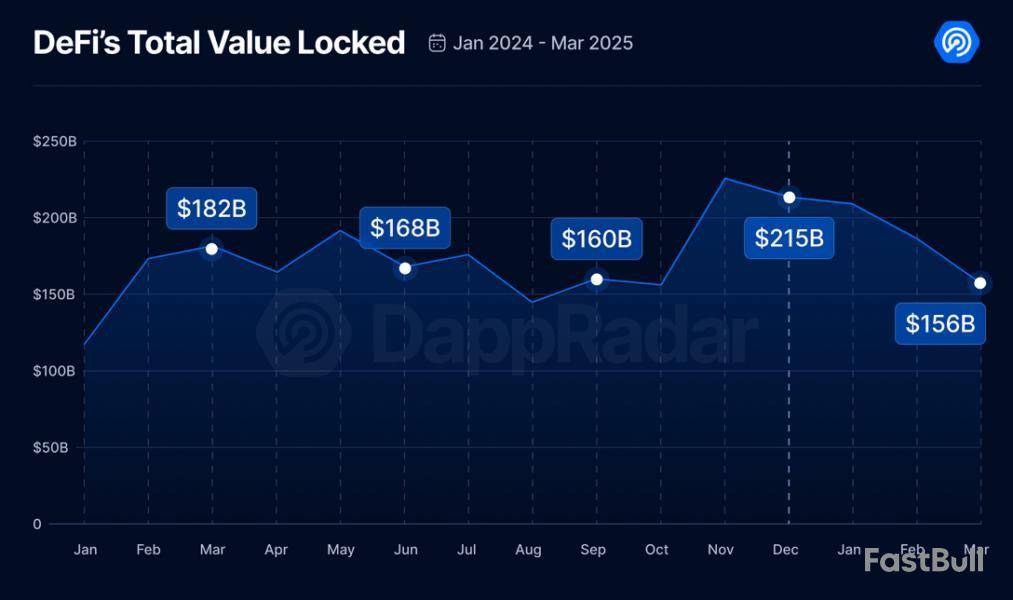
The largest blockchain by TVL, Ethereum, fell 37% to $96 billion, while Sui was the hardest hit of the top 10 blockchains by TVL, falling 44% to $2 billion.
Solana, Tron and the Arbitrum blockchains also had their TVLs slashed over 30%.
Meanwhile, blockchains that experienced a larger volume of DeFi withdrawals and had a smaller share of stablecoins locked in their protocols faced extra pressure on top of the falling token prices.
The newly launched Berachain was the only top-10 blockchain by TVL to rise, accumulating $5.17 billion between Feb. 6 and March 31, DappRadar noted.
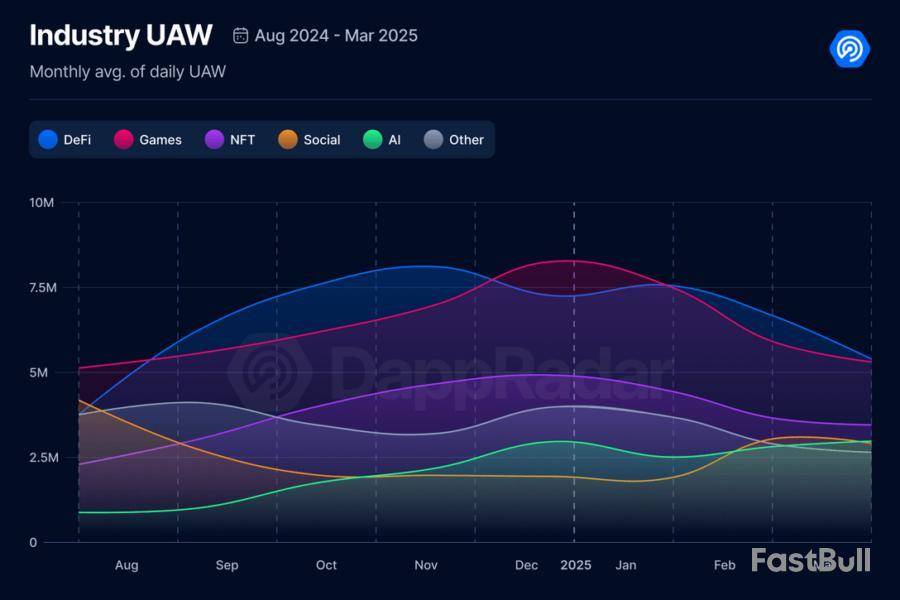
Market fall didn’t stunt AI and social app user growth
However, the number of daily unique active wallets (DUAW) interacting with AI protocols and social apps increased 29% and 10%, respectively, in Q1, while non-fungible token and GameFi protocols regressed, DappRadar’s data shows.
The monthly average of DUAWs interacting on the AI and social protocols rose to 2.6 million and 2.8 million, while DeFi and GameFi protocols fell double-digits.
DappRadar said there was “explosive growth” in AI agent protocols, stating that they’re “no longer a concept.”
“They’re here, and they’re shaping new user behaviors,” said the firm.
Meanwhile, NFT trading volume fell 25% to $1.5 billion, with OKX’s NFT marketplace taking in the most sales at $606 million, while OpenSea and Blur saw $599 million and $565 million, respectively.
Pudgy Penguins NFTs were the most sold collectibles at $177 million, while CryptoPunks NFTs netted $63.6 million from just 477 sales, DappRadar noted.
Bitcoin, which has been exhibiting signs of stabilization after weeks of hesitancy and erratic trading, is currently holding steady at $84,000. The long-awaited tariffs have finally been formally introduced, eliminating a significant layer of uncertainty that had kept markets cautious.
This is an important step for Bitcoin, which eliminates a massive layer of risk for the asset. Volume and momentum had clearly slowed due to the fear of unanticipated regulatory shocks and Bitcoin was finding it difficult to hold levels above its 200-day moving average. But now that the risk event has passed, market players seem to be regaining their confidence, which could pave the way for a new bullish trend. Chart by TradingView">
Technically speaking, the black 200 EMA served as a dependable dynamic support, and Bitcoin has successfully recovered from it. The relative strength index (RSI) remains neutral, suggesting there is ample room for upside. The fact that Bitcoin is once again getting close to a crucial resistance zone between $87,000 and $89,000, which is indicated by the convergence of short- and mid-term moving averages, is more encouraging.
The road to six figures could be opened up quickly by a breakout here. The recent green daily bars suggest accumulation rather than distribution, but the volume is still a little muted in comparison to the exuberant November run. It might only take a few weeks, not months, for Bitcoin to retest its all-time highs of $100,000 if bullish momentum holds and it overcomes resistance in the days ahead.
XRP stays up
As it firmly maintains the important $2 price level and finally stabilizes around 200 EMA, XRP is once again demonstrating its resilience. According to the price's recent behavior, the $2 mark is functioning as a technical and psychological anchor and might provide the groundwork for a midterm recovery.
Since the asset's explosive rise in the latter part of last year, the 200 EMA has been a reliable level of support, and XRP has successfully defended it on the daily chart at about $1.94. There have historically been brief bullish impulses following each bounce from this level, and this time is no exception.
On the upside, the $2.27 area, which corresponds to the 50-day EMA and has served as resistance in recent weeks, is one of the next levels to keep an eye on. If XRP breaks above this level, it may move toward the descending resistance line, which has held back the asset's growth since January and is located around $2.60. An effective break above that trendline might indicate that the current consolidation phase is coming to an end and that there may be a potential reacceleration toward the $3 mark.
A moderate but steady recovery is indicated by volume analysis, with green daily candles gradually gaining ground. When the price holds a critical level as firmly as XRP has done with $2, this type of low-volatility accumulation frequently signals a breakout. On a larger scale, the price structure of XRP is currently forming a falling wedge, which is a historically bullish pattern that frequently leads to upward breakouts.
Although the overall market direction and macro uncertainty are still important considerations, XRP's localized strength around $2 is a sign of bulls' confidence. A new bullish phase might be approaching if XRP keeps consolidating above this level and strengthens toward the $2.27-$2.60 zone.
No Ethereum momentum
Ethereum is once again showing signs of weakness, with its price struggling to maintain any upward momentum near the $2,000 mark. Even with small intraday gains, the overall technical setup indicates that ETH is still far from making a significant comeback, much less hitting its prior highs of about $3,000.
According to the current daily chart, Ethereum has been in a downward trend since early March, with lower highs and lower lows creating a descending channel. At $1,821 the asset is trading significantly below its 50-day EMA and battling the crucial 26-day EMA (blue line), which is still convergent with regional price peaks. Further escalating the bearish momentum, this convergence suggests a higher likelihood of rejection at these resistance points.
Bulls are unlikely to get traction until ETH overcomes this dynamic resistance and regains higher ground, like the $2,200 level. Red candles dominated most trading sessions, indicating waning buyer interest according to volume analysis. While it is close to 38, the Relative Strength Index (RSI) shows bearish sentiment without hitting oversold levels that could lead to a recovery bounce.
The larger market environment for ETH is also not helping. Ethereum is still quiet and performs poorly in contrast to Bitcoin and other assets, which have made attempts at recovery. ETH seems particularly vulnerable as the crypto market is threatened by macroeconomic issues like international tariffs and ambiguous regulatory frameworks.
Ethereum is far from $2,000 and its downward trend indicates that it might keep falling in the absence of a significant change in volume or investor sentiment. If the key support level, which is located close to $1,700, is broken, ETH may retest the lower limit of its descending channel with a potential target price of $1,600 or less. Before considering long entries, investors should exercise caution and keep an eye out for any indications of a reversal.
Stellar is down more than 5% on Thursday, with its market capitalization dropping to $8 billion. XLM technical indicators are flashing strong bearish signals, suggesting continued downward momentum that could test critical support levels around $0.22.
While a reversal scenario remains possible with resistance targets at $0.27, $0.29, and $0.30, such an upside move would require a substantial shift in market sentiment.
XLM RSI Shows Sellers Are In Control
Stellar’s Relative Strength Index (RSI) has dropped sharply to 38.99, down from 59.54 just two days ago—signaling a notable shift in momentum.
The RSI is a widely used momentum oscillator that measures the speed and magnitude of recent price changes, typically ranging between 0 and 100.
Readings above 70 suggest overbought conditions, while levels below 30 indicate oversold territory. A reading between 30 and 50 often reflects bearish momentum but is not yet extreme enough to trigger an immediate reversal.
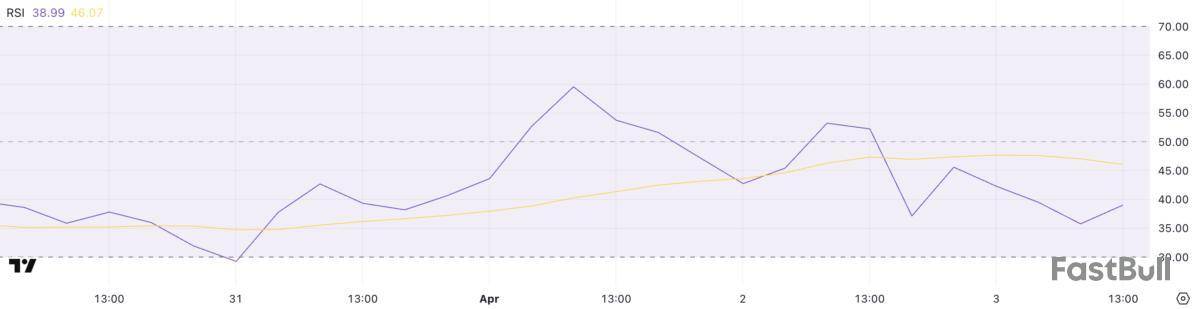
With Stellar’s RSI now below the key midpoint of 50 and approaching the oversold threshold, the current reading of 38.99 suggests that sellers are gaining control.
While it’s not yet in oversold territory, it does signal weakening buying pressure and increasing downside risk.
If the RSI continues to fall, XLM could face further price declines unless buyers step in soon to stabilize the trend and prevent a slide into more deeply oversold levels.
Stellar CMF Heavily Dropped Since April 1
Stellar’s Chaikin Money Flow (CMF) has plunged to -10, a sharp decline from 0.19 just two days ago, signaling a significant shift in capital flow dynamics.
The CMF is an indicator that measures the volume-weighted average of accumulation and distribution over a set period—essentially tracking whether money is flowing into or out of an asset.
Positive values suggest buying pressure and accumulation, while negative values point to selling pressure and capital outflow.
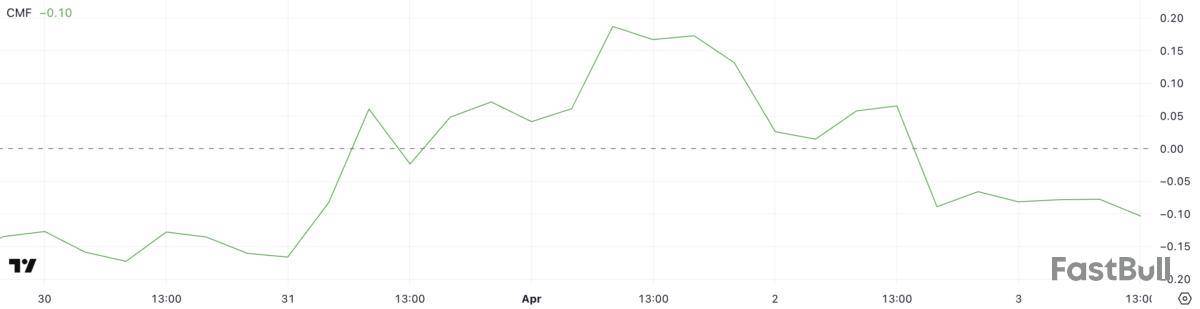
With XLM’s CMF now deep in negative territory at -10, it indicates that sellers are firmly in control and substantial capital is leaving the asset.
This level of negative flow can put downward pressure on price, especially if it aligns with other bearish technical signals. Unless buying volume returns to offset this outflow, XLM could continue to weaken in the near term.
Will Stellar Fall To Five-Month Lows?
Stellar price action presents concerning signals as EMA indicators point to a strong bearish trend with significant downside potential.
Technical analysis suggests this downward momentum could push XLM to test critical support around $0.22. It could breach this level and fall below the psychologically important $0.20 threshold—a price not seen since November 2024.
This technical deterioration warrants caution from traders and investors as selling pressure appears to be intensifying.
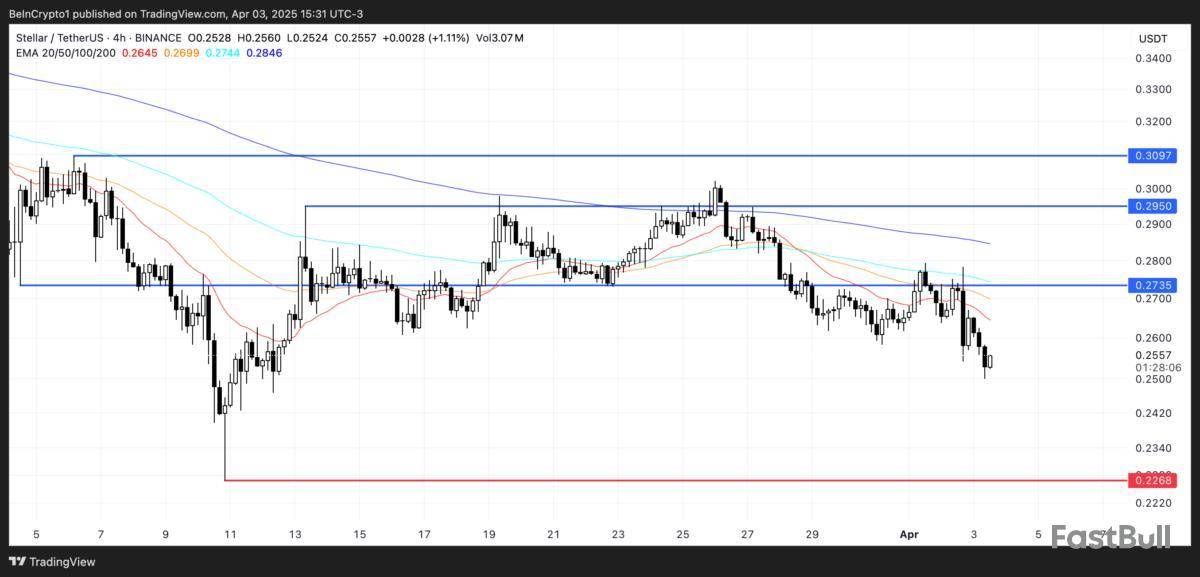
Conversely, a trend reversal scenario would require a substantial shift in market sentiment. Should bulls regain control, XLM could challenge the immediate resistance at $0.27, with further upside targets at $0.29 and the key $0.30 level.
However, this optimistic outlook faces considerable obstacles, as only a dramatic sentiment shift coupled with the emergence of a powerful uptrend would enable such a recovery.
Until clearer bullish signals manifest, the prevailing technical structure continues to favor the bearish case.
On April 3rd, the USDC Treasury, in its regular attempt to boost the supply of USDC in circulation, created 250 million fresh USDC tokens on the Solana blockchain, according to data provided by blockchain tracker Whale Alert.
The token creation, which happened about three hours before press time, saw $249,971,649 worth of USDC injected into the Solana blockchain as investors seek more liquidity on the seventh-largest cryptocurrency by market capitalization.
The massive USDC mint on Solana comes less than a month after the network hit a major USDC milestone following its integration with Circle, the USDC issuer—a strategy aimed at increasing USDC’s footprint on the blockchain.
It is noteworthy that the increasing supply of USDC on Solana is attributable to the ongoing surge in DeFi activity on the network, including remarkable trading volumes. Data from DefiLlama shows that Solana has emerged as the second-largest network by DEX volume, accounting for up to $6.28 billion in total value locked in DeFi.
With 250 million USDC entering circulation, there are indications that the need for liquidity is on the rise, traceable to demand from institutions and retail investors.
The consistent move by the Treasury to continue issuing the Circle-backed stablecoin, USDC, comes as no surprise, as recent regulatory support has sparked global interest in the cryptocurrency within the broader crypto ecosystem. Notably, USDC’s growing supply has been boosted by regulatory shifts in the stablecoin market, particularly in Europe.
The Treasury’s decision to create more stablecoins also appears to be a response to investor demand for refuge in stable assets—especially in times like this, when the crypto market is highly volatile and major cryptocurrencies continue to plunge significantly.
According to new data from Arkham Intelligence, three major Bitcoin ETF issuers are acquiring huge amounts of BTC today. The ETFs had $220 million in net inflows yesterday, and the issuers are potentially expecting a spike in demand.
Although Bitcoin has seen wild fluctuations over the past couple of days, institutional investors might show more confidence in the leading cryptocurrency than the TradFi market.
Why are ETF Issuers Buying Bitcoin?
The crypto market experienced wider liquidations today, and fears of a broader recession are circulating heavily. Since President Trump imposed much higher tariffs than expected, crypto is mirroring the TradFi stock market with notable downturns.
However, the US spot Bitcoin ETFs market shows that institutional demand might rebound in the short term.
“Donald Trump just tariffed the entire world. So? Grayscale is buying Bitcoin, Fidelity is buying Bitcoin, Ark Invest is buying Bitcoin,” Arkham Intelligence noted on social media.
Arkham Intelligence, a prominent blockchain analysis platform, is not the only one noticing this trend in Bitcoin ETFs. Although Bitcoin’s price has been very volatile over the last two days, it has consistently managed to return to a rough baseline.
The asset’s long-short ratio was 0.94 last week, and it shifted to 1 today. This signals a move toward more balanced investor positioning.
Previously, with 48.5% long positions against 51.5% short positions, the market exhibited a slight bearish tilt. Today, the equal split—with 50.5% long positions—signals that investors have neutralized their stance, reducing the bearish bias.
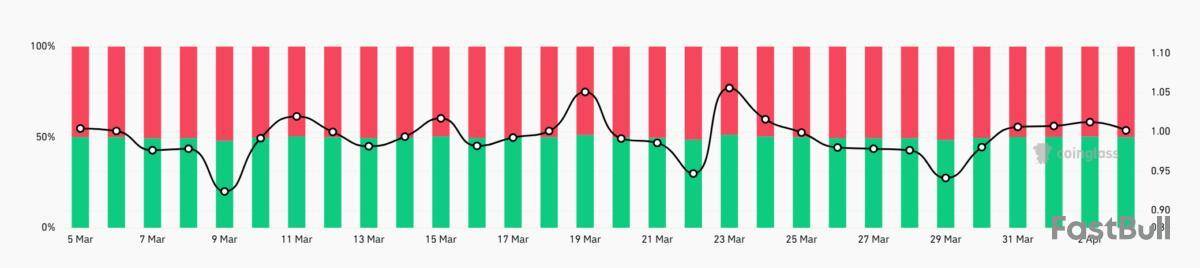
This balanced positioning suggests that market sentiment has stabilized, potentially reflecting increased uncertainty about near-term price movements. Bitcoin investors may now be awaiting clearer market signals before committing to a more directional bias.
Additionally, the Bitcoin ETFs have performed well in another key area. According to data from SoSo Value, the entire asset category had net inflows of $220 million yesterday.
Granted, Trump made his Liberation Day announcements after the stock market closed yesterday, but that’s still a very impressive amount of growth.
It is currently unclear exactly what impact today’s market turmoil had on the Bitcoin ETFs as an asset category. However, Arkham’s data suggests that these issuers are making notable investments in BTC.
If nothing else, it suggests that these firms are anticipating an uptick in demand in the near future. There are still many unanswered questions about tariffs, crypto markets, and the global economy as a whole.
If ETF inflows continue throughout this week, it will reflect institutional investors’ betting on BTC to remain more stable and sustainable than TradFi markets amid recession concerns.
The Dogecoin price has been defying broader market weakness by establishing a series of higher lows. Amidst the market downturn, technical indicators suggest that Dogecoin could be setting the stage for an explosive rally, with analysts predicting a 270% surge to a new price high.
Dogecoin Price Prepares For 270% Surge
A Dogecoin price chart shared by crypto analyst Javon Marks reveals a critical shift in momentum. Following a prolonged downtrend that saw the meme coin’s price crash to significant lows, Dogecoin has now broken out of a descending trendline, signaling the potential end of its bear cycle.
Since reaching a cycle low, Dogecoin has consistently posted higher lows — a common sign of growing buying pressure and a steady uptrend. Following the formation of its latest higher low, Marks believes that DOGE is now positioned in a bullish set-up.
Historically, similar patterns have preceded parabolic moves in the Dogecoin price, suggesting that the meme coin could be gearing up for an uptrend continuation. According to Marks‘ analysis, if Dogecoin follows the established trend, the next impulsive wave could push its price to $0.653, marking an explosive 270% surge.
While past higher low formations support the likelihood of the analyst’s projected rally, Dogecoin’s recent breakout from the descending trendline reinforces its bullish structure. Marks also suggests that a climb to the $0.63 level could serve as a launchpad for Dogecoin, potentially driving its price even higher to $1.25 if its momentum persists.
Despite the ongoing market volatility, DOGE continues to hold key support levels as it eyes a fresh breakout. Notably, a surge to the $1.25 target would mark an impressive 681.25% increase from the meme coin’s current market value of $0.16.
DOGE Faces Make Or Break Level
According to crypto analyst Ali Martinez, the Dogecoin price is currently at a make-or-break point, meaning that its next move could determine whether it sees a significant breakout or a sharp decline. Sharing a price chart highlighting Fibonacci retracements and trend channels, the analyst revealed that Dogecoin is sitting on a key ascending trendline that has acted as support since 2018.
This trend line aligns with the 0.796 Fibonacci retracement level at $0.16, marking it a crucial support zone. If Dogecoin holds above this level, it could trigger a bullish continuation, with the next major Fibonacci extension level at $0.57. Surpassing this price mark could also propel Dogecoin to the 1.272 Fib at $2.77.
On the flip side, if Dogecoin breaks below $0.16, the next major support lies around the 0.618 Fib at $0.06. The analyst’s chart also highlights a possible breakdown to $0.0066 or even as low as $0.0016 if bearish momentum persists.
Circle appears set to become the second-largest pure-play crypto firm to go public in the U.S., after filing a prospectus with the SEC on Tuesday. The move marks a tremendous step forward for the firm, which had canceled a previous attempt at a public listing through a SPAC merger during the last bull market, as the country’s regulatory freeze begins to thaw under the crypto-friendly Trump administration.
While the filing lays the groundwork for its much-anticipated IPO, it has also given industry observers the opportunity to examine the stablecoin issuer’s books, with some raising questions as to why the firm hasn’t been nearly as profitable as its offshore rival Tether.
According to Circle’s Form S-1, the company's net income was just $155.7 million, down 42% from $267.6 million in 2023. This decline contrasts with a net loss of $768.8 million in 2022 during the marketwide downturn. Tether, on the other hand, recorded record profits of $13 billion in 2024, with over 50% derived from U.S. Treasury yield.
According to Kevin Lehtiniitty, the CEO of Borderless.xyz, who helped develop the first U.S.-based, fully reserved stablecoin, TrueUSD, Circle’s shrinking profits last year may reflect increased operational costs for a firm pursuing a regulatory compliance strategy.
Commoditized market
"Comparing Circle's headcount — Tether has taken the much more permissionless crypto native approach to building," a highly skeptical Lehtiniitty told The Block in an interview. "They don't have any of the costs — whether it's direct licensing costs or indirect licensing costs in the sense of staffing, payroll and things like lobbying — that Circle spends a ton of money on."
Ultimately, Lehtiniitty said, this is all Circle’s cost of "distribution."
According to its filing, Circle paid $908 million to Coinbase, its primary distribution partner, in 2024 to facilitate USDC circulation on the exchange. This significant outlay underscores the cost of maintaining market presence, he added.
"That's the cost of distribution to be number two, not even the cost of distribution to be number one," Lehtiniitty said. "It’s a great word of caution to anybody who's now looking to launch their own stablecoin."
Lehtiniitty has been in the stablecoin business for nearly a decade, longer than Circle has issued USDC. Borderless is a "picks and shovels" type of business that acts as a global stablecoin orchestration and liquidity network to help global firms integrate stablecoins.
As he sees it, despite Circle’s close working relationship with Coinbase (the two firms collaborated to launch USDC by co-creating the since dissolved CENTRE Consortium), the second-largest stablecoin doesn’t have a "unique advantage" when it comes to distribution. USDC is a stablecoin that can be outcompete.
"PayPal is a great example here, right? PayPal has a massively unfair advantage when it comes to the distribution of PYUSD if they integrate it very deeply into PayPal's products," he said. "World Liberty would have to prove this, but they probably have a very unique advantage to distribution. I would imagine being the president gives you some advantage in an uptake."
Regulatory advantage
Given that stablecoins are a "commoditized product" with relatively simple underlying technology, Lehtiniitty argues that Circle's only way to compete is by creating regulatory policies that push competitors out. "Creating regulatory policies that are self-serving is certainly a solvable problem," he said.
"Look at how big an industry lobbying is in our country. But it is an incredibly capex-heavy ordeal. And Circle is going to have to continue spending absolutely ridiculous amounts of money," added Lehtiniitty.
Circle’s filing comes at a time of rapid regulatory and legislative progress for stablecoins in the U.S., after years of inactivity. President Trump, for instance, has said he is looking to sign a stablecoin bill into law by the end of the summer. The so-called GENIUS Act recently passed the House and will be worked on alongside an analogous bill drafted by the Senate.
Lehtiniitty, who sometimes calls himself the "cranky old man of stablecoins," is uncharacteristically bullish on these bills. "These stablecoin bills have been extremely well thought out, pretty measured and generally very positive — especially from the consumer protection standpoint," he said.
In particular, Lehtiniitty praised the work done creating a framework where individual states can oversee smaller stablecoins that then graduate to national oversight through the Office of the Comptroller of the Currency once they reach a certain size.
"Having small market cap stablecoins use state-level licensing, like MTLs [money transmitter licenses], is going to allow for a lot of startup experimentation and innovation to develop," Lehtiniitty said. "But then, allowing the larger market cap stablecoins to operate under an OCC regulation framework is going to give them the ability to have national regulatory clarity, which is missing in the state MTL regimes."
Disclaimer: The Block is an independent media outlet that delivers news, research, and data. As of November 2023, Foresight Ventures is a majority investor of The Block. Foresight Ventures invests in other companies in the crypto space. Crypto exchange Bitget is an anchor LP for Foresight Ventures. The Block continues to operate independently to deliver objective, impactful, and timely information about the crypto industry. Here are our current financial disclosures.
© 2025 The Block. All Rights Reserved. This article is provided for informational purposes only. It is not offered or intended to be used as legal, tax, investment, financial, or other advice.
728 RM B 7/F GEE LOK IND BLDG NO 34 HUNG TO RD KWUN TONG KLN HONG KONG


White Label
Data API
Web Plug-ins
Poster Maker
Affiliate Program
The risk of loss in trading financial instruments such as stocks, FX, commodities, futures, bonds, ETFs and crypto can be substantial. You may sustain a total loss of the funds that you deposit with your broker. Therefore, you should carefully consider whether such trading is suitable for you in light of your circumstances and financial resources.
No decision to invest should be made without thoroughly conducting due diligence by yourself or consulting with your financial advisors. Our web content might not suit you since we don't know your financial conditions and investment needs. Our financial information might have latency or contain inaccuracy, so you should be fully responsible for any of your trading and investment decisions. The company will not be responsible for your capital loss.
Without getting permission from the website, you are not allowed to copy the website's graphics, texts, or trademarks. Intellectual property rights in the content or data incorporated into this website belong to its providers and exchange merchants.
Not Logged In
Log in to access more features

FastBull Membership
Not yet
Purchase


Log In
Sign Up


