• Trade
  • Markets
  • Copy
  • Contests
  • News
  • 24/7
  • Calendar
  • Q&A
  • Chats
Trending
Screeners
SYMBOL
LAST
BID
ASK
HIGH
LOW
NET CHG.
%CHG.
SPREAD
SPX
S&P 500 Index
6827.42
6827.42
6827.42
6899.86
6801.80
-73.58
-1.07%
--
DJI
Dow Jones Industrial Average
48458.04
48458.04
48458.04
48886.86
48334.10
-245.98
-0.51%
--
IXIC
NASDAQ Composite Index
23195.16
23195.16
23195.16
23554.89
23094.51
-398.69
-1.69%
--
USDX
US Dollar Index
97.950
98.030
97.950
98.500
97.950
-0.370
-0.38%
--
EURUSD
Euro / US Dollar
1.17394
1.17409
1.17394
1.17496
1.17192
+0.00011
+ 0.01%
--
GBPUSD
Pound Sterling / US Dollar
1.33707
1.33732
1.33707
1.33997
1.33419
-0.00148
-0.11%
--
XAUUSD
Gold / US Dollar
4299.39
4299.39
4299.39
4353.41
4257.10
+20.10
+ 0.47%
--
WTI
Light Sweet Crude Oil
57.233
57.485
57.233
58.011
56.969
-0.408
-0.71%
--

Community Accounts

Signal Accounts
--
Profit Accounts
--
Loss Accounts
--
View More

Become a signal provider

Sell trading signals to earn additional income

View More

Guide to Copy Trading

Get started with ease and confidence

View More

Signal Accounts for Members

All Signal Accounts

Best Return
  • Best Return
  • Best P/L
  • Best MDD
Past 1W
  • Past 1W
  • Past 1M
  • Past 1Y

All Contests

  • All
  • Trump Updates
  • Recommend
  • Stocks
  • Cryptocurrencies
  • Central Banks
  • Featured News
Top News Only
Share

Kuwait's Oil Minister Says Searching For Partner In Petrochemical Project In Oman's Duqm But Ready To Move Ahead With Oman If No Investor Found

Share

Kuwait's Oil Minister Says: We Expected Prices To Remain At Least As They Were, If Not Better, But We Were Surprised By Their Drop

Share

Kuwait Sees Fair Oil Price At $60-$68 A Barrel Under Current Conditions

Share

Syria Produces About 100000 Barrels/Day And Aims To Boost Output If Issues East Of The Euphrates Are Resolved

Share

Australia Intelligence Official: National Terrorism Threat Level Remains At Probable

Share

Australia Intelligence Official: We're Looking To See If There Are Anyone In The Community That Has Similar Intent

Share

Australia Intelligence Official: We Are Looking At The Identities Of The Attackers

Share

Australia Prime Minister: Tells Jews We Will Dedicate Every Resource Required To Making Sure You Are Safe And Protected

Share

Australia Prime Minister: Police And Security Agencies Are Working To Determine Anyone Associated With This Outrage

Share

Australia Police: Police Bomb Disposal Unit Currently Working On Several Suspected Improvised Explosive Devices

Share

Syria's Oil Ministry Forecasts Country's Gas Production To Increase To 15 Million Cubic Meters By End Of 2026

Share

His Office: Ukraine's President Zelenskiy Landed In Germany

Share

Australia Police: This Is Not A Time For Retribution. This Is A Time To Allow The Police To Do Their Duty

Share

Australia Police: We Know That We Have Two Definite Offenders, But We Want To Make Sure The Community Is Safe

Share

Australia Police: Our Counter-Terrorism Command Will Lead This Investigation With Investigators From The State Crime Command. No Stone Will Be Left Unturned

Share

Australia Police: This Is A Terrorist Incident

Share

Ukraine President Zelenskiy: Ukraine-Russia Ceasefire Along The Current Frontlines Would Be A Fair Option

Share

New South Wales Premier Chris Minns: This Is A Massive, Complex And Just Beginning Investigation

Share

New South Wales Premier Chris Minns: 12 Killed In Bondi Shooting

Share

Ukraine President Zelenskiy: Security Guarantees Should Be Legally Binding

TIME
ACT
FCST
PREV
U.K. Trade Balance (Oct)

A:--

F: --

P: --

U.K. Services Index MoM

A:--

F: --

P: --

U.K. Construction Output MoM (SA) (Oct)

A:--

F: --

P: --

U.K. Industrial Output YoY (Oct)

A:--

F: --

P: --

U.K. Trade Balance (SA) (Oct)

A:--

F: --

P: --

U.K. Trade Balance EU (SA) (Oct)

A:--

F: --

P: --

U.K. Manufacturing Output YoY (Oct)

A:--

F: --

P: --

U.K. GDP MoM (Oct)

A:--

F: --

P: --

U.K. GDP YoY (SA) (Oct)

A:--

F: --

P: --

U.K. Industrial Output MoM (Oct)

A:--

F: --

P: --

U.K. Construction Output YoY (Oct)

A:--

F: --

P: --

France HICP Final MoM (Nov)

A:--

F: --

P: --

China, Mainland Outstanding Loans Growth YoY (Nov)

A:--

F: --

P: --

China, Mainland M2 Money Supply YoY (Nov)

A:--

F: --

P: --

China, Mainland M0 Money Supply YoY (Nov)

A:--

F: --

P: --

China, Mainland M1 Money Supply YoY (Nov)

A:--

F: --

P: --

India CPI YoY (Nov)

A:--

F: --

P: --

India Deposit Gowth YoY

A:--

F: --

P: --

Brazil Services Growth YoY (Oct)

A:--

F: --

P: --

Mexico Industrial Output YoY (Oct)

A:--

F: --

P: --

Russia Trade Balance (Oct)

A:--

F: --

P: --

Philadelphia Fed President Henry Paulson delivers a speech
Canada Building Permits MoM (SA) (Oct)

A:--

F: --

P: --

Canada Wholesale Sales YoY (Oct)

A:--

F: --

P: --

Canada Wholesale Inventory MoM (Oct)

A:--

F: --

P: --

Canada Wholesale Inventory YoY (Oct)

A:--

F: --

P: --

Canada Wholesale Sales MoM (SA) (Oct)

A:--

F: --

P: --

Germany Current Account (Not SA) (Oct)

A:--

F: --

P: --

U.S. Weekly Total Rig Count

A:--

F: --

P: --

U.S. Weekly Total Oil Rig Count

A:--

F: --

P: --

Japan Tankan Large Non-Manufacturing Diffusion Index (Q4)

--

F: --

P: --

Japan Tankan Small Manufacturing Outlook Index (Q4)

--

F: --

P: --

Japan Tankan Large Non-Manufacturing Outlook Index (Q4)

--

F: --

P: --

Japan Tankan Large Manufacturing Outlook Index (Q4)

--

F: --

P: --

Japan Tankan Small Manufacturing Diffusion Index (Q4)

--

F: --

P: --

Japan Tankan Large Manufacturing Diffusion Index (Q4)

--

F: --

P: --

Japan Tankan Large-Enterprise Capital Expenditure YoY (Q4)

--

F: --

P: --

U.K. Rightmove House Price Index YoY (Dec)

--

F: --

P: --

China, Mainland Industrial Output YoY (YTD) (Nov)

--

F: --

P: --

China, Mainland Urban Area Unemployment Rate (Nov)

--

F: --

P: --

Saudi Arabia CPI YoY (Nov)

--

F: --

P: --

Euro Zone Industrial Output YoY (Oct)

--

F: --

P: --

Euro Zone Industrial Output MoM (Oct)

--

F: --

P: --

Canada Existing Home Sales MoM (Nov)

--

F: --

P: --

Euro Zone Total Reserve Assets (Nov)

--

F: --

P: --

U.K. Inflation Rate Expectations

--

F: --

P: --

Canada National Economic Confidence Index

--

F: --

P: --

Canada New Housing Starts (Nov)

--

F: --

P: --

U.S. NY Fed Manufacturing Employment Index (Dec)

--

F: --

P: --

U.S. NY Fed Manufacturing Index (Dec)

--

F: --

P: --

Canada Core CPI YoY (Nov)

--

F: --

P: --

Canada Manufacturing Unfilled Orders MoM (Oct)

--

F: --

P: --

Canada Manufacturing New Orders MoM (Oct)

--

F: --

P: --

Canada Core CPI MoM (Nov)

--

F: --

P: --

Canada Manufacturing Inventory MoM (Oct)

--

F: --

P: --

Canada CPI YoY (Nov)

--

F: --

P: --

Canada CPI MoM (Nov)

--

F: --

P: --

Canada CPI YoY (SA) (Nov)

--

F: --

P: --

Canada Core CPI MoM (SA) (Nov)

--

F: --

P: --

Canada CPI MoM (SA) (Nov)

--

F: --

P: --

Q&A with Experts
    • All
    • Chatrooms
    • Groups
    • Friends
    Connecting
    .
    .
    .
    Type here...
    Add Symbol or Code

      No matching data

      All
      Trump Updates
      Recommend
      Stocks
      Cryptocurrencies
      Central Banks
      Featured News
      • All
      • Russia-Ukraine Conflict
      • Middle East Flashpoint
      • All
      • Russia-Ukraine Conflict
      • Middle East Flashpoint
      Search
      Products

      Charts Free Forever

      Chats Q&A with Experts
      Screeners Economic Calendar Data Tools
      Membership Features
      Data Warehouse Market Trends Institutional Data Policy Rates Macro

      Market Trends

      Market Sentiment Order Book Forex Correlations

      Top Indicators

      Charts Free Forever
      Markets

      News

      News Analysis 24/7 Columns Education
      From Institutions From Analysts
      Topics Columnists

      Latest Views

      Latest Views

      Trending Topics

      Top Columnists

      Latest Update

      Signals

      Copy Rankings Latest Signals Become a signal provider AI Rating
      Contests
      Brokers

      Overview Brokers Assessment Rankings Regulators News Claims
      Broker listing Forex Brokers Comparison Tool Live Spread Comparison Scam
      Q&A Complaint Scam Alert Videos Tips to Detect Scam
      More

      Business
      Events
      Careers About Us Advertising Help Center

      White Label

      Data API

      Web Plug-ins

      Affiliate Program

      Awards Institution Evaluation IB Seminar Salon Event Exhibition
      Vietnam Thailand Singapore Dubai
      Fans Party Investment Sharing Session
      FastBull Summit BrokersView Expo
      Recent Searches
        Top Searches
          Markets
          News
          Analysis
          User
          24/7
          Economic Calendar
          Education
          Data
          • Names
          • Latest
          • Prev

          View All

          No data

          Scan to Download

          Faster Charts, Chat Faster!

          Download App
          English
          • English
          • Español
          • العربية
          • Bahasa Indonesia
          • Bahasa Melayu
          • Tiếng Việt
          • ภาษาไทย
          • Français
          • Italiano
          • Türkçe
          • Русский язык
          • 简中
          • 繁中
          Open Account
          Search
          Products
          Charts Free Forever
          Markets
          News
          Signals

          Copy Rankings Latest Signals Become a signal provider AI Rating
          Contests
          Brokers

          Overview Brokers Assessment Rankings Regulators News Claims
          Broker listing Forex Brokers Comparison Tool Live Spread Comparison Scam
          Q&A Complaint Scam Alert Videos Tips to Detect Scam
          More

          Business
          Events
          Careers About Us Advertising Help Center

          White Label

          Data API

          Web Plug-ins

          Affiliate Program

          Awards Institution Evaluation IB Seminar Salon Event Exhibition
          Vietnam Thailand Singapore Dubai
          Fans Party Investment Sharing Session
          FastBull Summit BrokersView Expo

          Crypto trader turns $2K PEPE into $43M, sells for $10M profit

          Cointelegraph
          Litecoin / Tether
          -1.64%
          1inch / Tether
          -4.20%
          AAVE / Tether
          -1.93%
          Fusionist / Tether
          -5.59%

          A savvy cryptocurrency trader reportedly turned $2,000 into more than $43 million by investing in the memecoin Pepe at its peak valuation, despite the token’s extreme volatility and lack of underlying technical value.

          The trader made an over 4,700-fold return on investment on the popular frog-themed Pepe cryptocurrency, according to blockchain intelligence platform Lookonchain.

          “This OG spent only $2,184 to buy 1.5T $PEPE($43M at the peak) in the early stage. He sold 1.02T $PEPE for $6.66M, leaving 493B $PEPE($3.64M), with a total profit of $10.3M(4,718x), Lookonchain wrote in a March 29 X post.

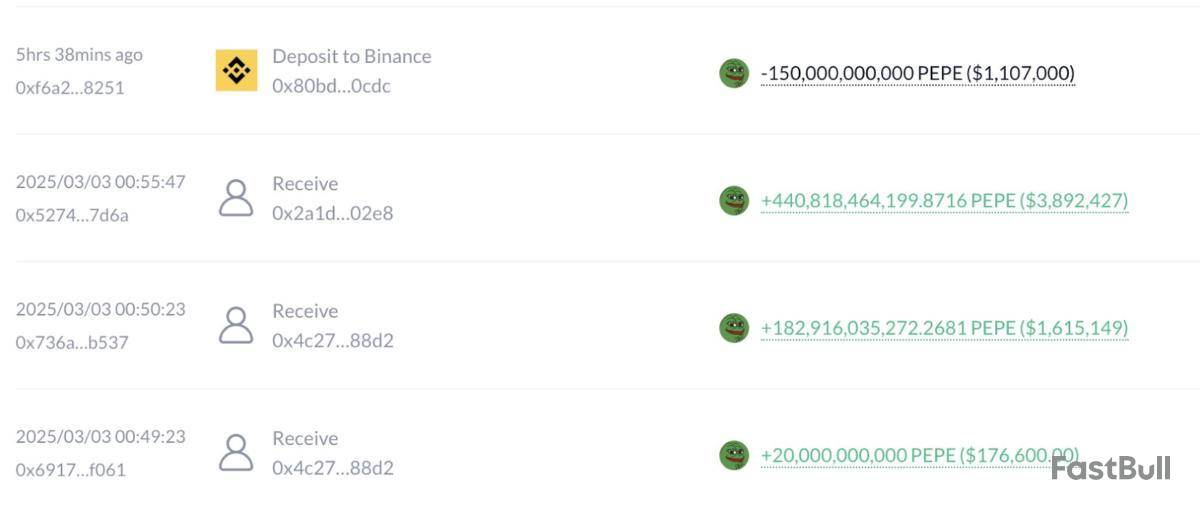
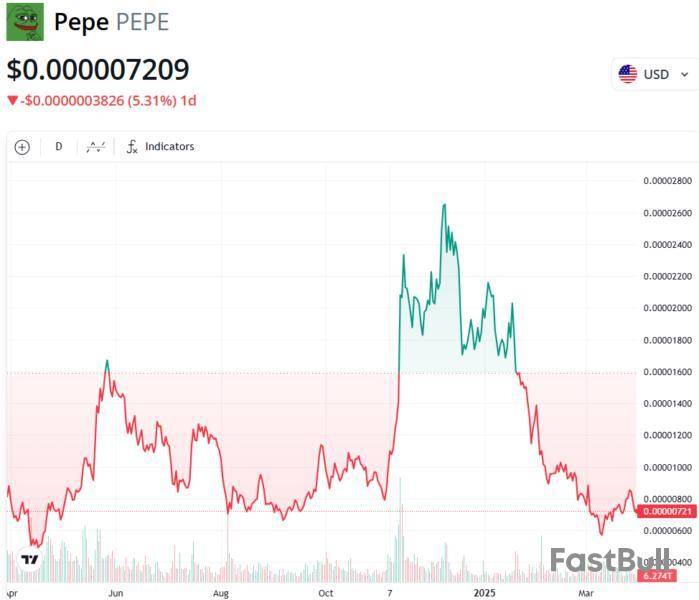
          The trader realized over $10 million in profit despite Pepe’s price falling over 74% from its all-time high of $0.00002825, which it reached on Dec. 9, 2024, Cointelegraph Markets Pro data shows.

          Memecoins are considered some of the most speculative and volatile digital assets, with price action driven largely by online enthusiasm and social sentiment rather than fundamental utility or innovation.

          Still, they’ve proven capable of generating life-changing returns. In May 2024, another early Pepe investor turned $27 into $52 million — a 1.9 million-fold return — according to onchain data.

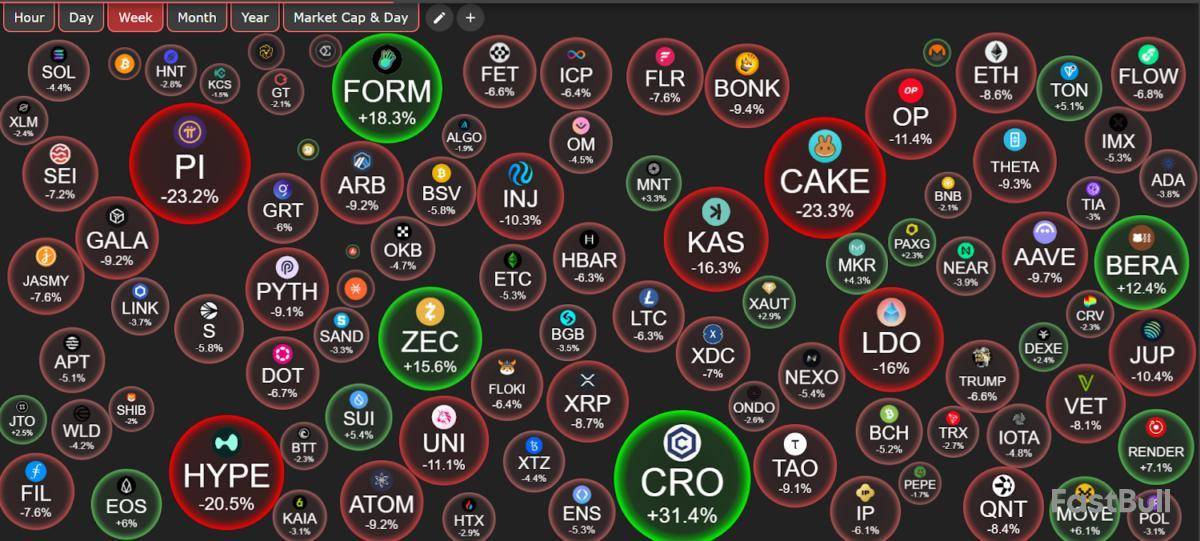
          Memecoins are stealing the spotlight from altcoins

          Despite their intrinsic lack of utility, memecoins continued to steal the spotlight from more established cryptocurrencies, Stella Zlatareva, dispatch editor at digital asset investment platform Nexo, told Cointelegraph:

          “High-beta, i.e., volatile tokens, are stealing the spotlight. Case in point, memecoins surged 5.6% on average, with DOGE, PEPE, and FLOKI responding to rate cut optimism and broader crypto strength.”

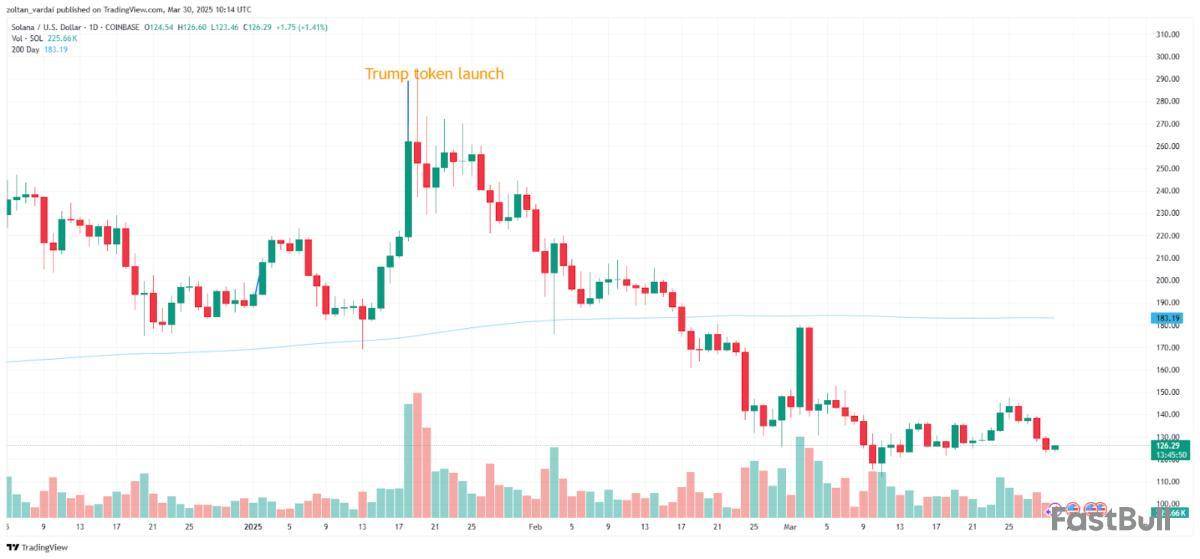
          While investor demand for memecoins has surged, it may also be siphoning capital from more established assets. For example, Solana (SOL) has fallen more than 51% since the launch of the Official Trump (TRUMP) token in January, according to Cointelegraph data.

          Memecoins “don’t tend to draw in much external capital flow; instead existing eco-system capital ‘round-robins’ from one meme to the next,” Dan Hughes, founder of the decentralized finance platform Radix, told Cointelegraph, adding:

          “Even in the case of TRUMP, most of the inbound liquidity was outflow from other crypto assets, people selling their crypto portfolio to buy TRUMP in extreme FOMO [fear of missing out].”

          Insider scams and fraudulent activity have plagued the memecoin industry, and US regulators are taking note. On March 5, New York lawmakers introduced a bill aimed at protecting crypto investors from rug pulls and similar insider scams shortly after the scandal around the Libra (LIBRA) token, which was endorsed by Argentine President Javier Milei.

          Risk Warnings and Disclaimers
          You understand and acknowledge that there is a high degree of risk involved in trading. Following any strategies or investment methods may lead to potential losses. The content on the site is provided by our contributors and analysts for information purposes only. You are solely responsible for determining whether any trading assets, securities, strategy, or any other product is suitable for investing based on your own investment objectives and financial situation.
          Add to Favorites
          Share

          XRP 1 Million Mark Is Held: Here's What's Happening

          U.Today
          Litecoin / Tether
          -1.64%
          1inch / Tether
          -4.20%
          AAVE / Tether
          -1.93%
          Fusionist / Tether
          -5.59%

          The on-chain activity of XRP exhibits resilience despite recent price volatility considering the fact that one of the most telling metrics — daily transaction volume — remains stable above the 1 million mark. The most recent data shows that on March 29, 2025, more than 11.1 million payments were made, supporting the notion that despite market challenges, user activity on XRP Ledger is still robust.

          Following a decline that saw it fall below $2.20, XRP is currently making an effort to stabilize its price. The 200 EMA (black line) supports the critical support level near $2, which is just above where XRP is located on the chart. A short-term floor may be provided by buyers aggressively defending the level, as indicated by the bounce from this zone. Chart by TradingView">

          XRP, on the other hand, is still trapped in a descending wedge pattern with lower highs continuously applying pressure from the top. Furthermore, the 100 EMA and 50 EMA serve as dynamic resistance points. The continuous fight for bullish momentum is highlighted by the earlier in the week's failure to break above these moving averages.

          The upside outlook for XRP is still limited unless it makes a clear move above $2.35-$2.40. However, the persistent strength in on-chain metrics such as payment counts indicates that XRP's usefulness is still present. Strong network activity has historically frequently preceded price recoveries, particularly when paired with resilience in the support zone as is the case at $2.

          Despite technical obstacles, there is hope due to the continued on-chain activity, particularly the maintenance of over 1 million daily payments. The way to retest $2.60 might become available if this transactional strength persists and XRP is able to recover ground above $2.35. While prudence is advised until then, the foundations are still very strong.

          Risk Warnings and Disclaimers
          You understand and acknowledge that there is a high degree of risk involved in trading. Following any strategies or investment methods may lead to potential losses. The content on the site is provided by our contributors and analysts for information purposes only. You are solely responsible for determining whether any trading assets, securities, strategy, or any other product is suitable for investing based on your own investment objectives and financial situation.
          Add to Favorites
          Share

          Enormous Pepe (PEPE) Price Loss: This Whale to Cause Volatility

          U.Today
          Litecoin / Tether
          -1.64%
          1inch / Tether
          -4.20%
          AAVE / Tether
          -1.93%
          Fusionist / Tether
          -5.59%

          On a leveraged long position, a prominent Pepe trader is experiencing an unrealized loss of an astounding $3.36 million. The trader used Hyperliquid to go all in on PEPE with a 10x cross-margin leverage. He entered the token at $0.0000814 and is now keeping an eye on it hovering around $0.0000720, a significant divergence that could lead to liquidation.

          At its height, the position's value was approximately $27.4 million or more than 378 billion PEPE tokens. Given PEPE's poor price performance and brittle market structure, the liquidation price is $0.020, which is dangerously close. The whale partially closed approximately 67 million tokens and injected an additional $3.08 million USDC across several deposits in an effort to evade the impending liquidation, recovering nearly $490,000. Chart by TradingView">

          However, the PEPE market is exposed to significant volatility risks due to this degree of pressured activity. Technically speaking, PEPE has not maintained its prior breakout. It abruptly reversed, printing red candles with increasing sell volume after testing resistance close to the 50 EMA.

          According to the current chart, PEPE is having difficulty staying above the $0.0000700 support, which is a crucial psychological level that distinguishes a partial trend breakdown from a major recovery. The RSI is trending below 50, which indicates that bears are taking charge. Additional position closures could occur if the whale experiences further drawdown, which could flood the market with tokens and further suppress the price. As a ticking volatility bomb, the entire cryptocurrency community is now keeping an eye on this address.

          If the whale's plan fails and liquidation is initiated, the ensuing sell pressure may push PEPE down to levels seen in November 2024. Conversely, any positive momentum from PEPE could enable this position to bounce back. However, for the time being, this wallet is a focal point of market uncertainty due to the whale's loss and obvious desperation. PEPE traders take caution — there will be turbulence soon.

          Risk Warnings and Disclaimers
          You understand and acknowledge that there is a high degree of risk involved in trading. Following any strategies or investment methods may lead to potential losses. The content on the site is provided by our contributors and analysts for information purposes only. You are solely responsible for determining whether any trading assets, securities, strategy, or any other product is suitable for investing based on your own investment objectives and financial situation.
          Add to Favorites
          Share

          5 Signs Bitcoin Is Primed to Pump Again This Year (Opinion)

          CryptoPotato
          Litecoin / Tether
          -1.64%
          1inch / Tether
          -4.20%
          AAVE / Tether
          -1.93%
          Fusionist / Tether
          -5.59%

          In a blog post on Tuesday, the chief investment officer for the institutional grade Bitcoin ETF issuer wrote:

          “Two years ago, it was common for Bitwise clients to allocate ~1% of their portfolio to bitcoin and other crypto assets, an amount they could easily afford to lose.”

          But he’snoticeda big change over the last 24 months:

          “In today’s environment, it’s a different story. We more frequently see 3% allocations. As more of the world wakes up to the massive derisking we’ve seen in bitcoin, I think you’ll see this number rise to 5% and beyond.”

          ABC’s “Shark Tank” investing star Kevin O’Leary followed this exact trajectory to massive profits from his Bitcoin investments. Only he was years ahead of the curve.

          O’Learydevoted 3%of his portfolio to BTC in 2021. A year later hebumped upthat balance to 5%.

          Here are five signal factors driving support for Bitcoin’s price growth in 2025.1. Bullish BTC Falling Flag Continuation Pattern

          After correcting from the Jan. 20 historic record high of $109,000,Bitcoin’s pricerallied for 14 days starting on Mar. 10, from $78,500 to $87,450 by Mar. 25 (+12% gain).

          That represents a decisive breakout, confirming the falling flag pattern BTC charted during its correction. This bullish crypto chart pattern often signals the continuation of an uptrend.

          According to Investopedia, these are some of the most reliable chart signals traders use in markets like crypto and stocks:

          “These patterns are among the most reliable continuation patterns that traders use because they generate a setup for entering an existing trend that is ready to continue.”

          The pattern is more reliable as a bull signal if the daily trading volume chart matches the price, tracing a descending rhombus shape that looks like a flag falling in the wind.

          In this case, Bitcoin’s volume nicely matched the price’s consolidation channel. So it’s a fairly classic example of this bullish sign.

          Meanwhile, as Bitcoin’s price moved higher into a more sure-footed recovery, the 10-day through 200-day moving average BTC technical indicators all flipped to a Strong Buy recommendation.2. Bitcoin Price Rally on Trump Tariff Pivot

          In addition to the Bitcoin’s decisive breakout in March from a 50-day falling flag channel within a steep 16-month uptrend, there’s President Donald Trump’s pivot on tariffs in March.

          Markets rallied as the Trump relaxed his stance on tariffing imports. Before that, crypto prices fell along with stocks in February over a news cycle heavily focused on tariffs and rumors of more taxes.

          But, Bitcoin prices began to recover a few days after Trump suspended tariffs on Mexican and Canadian imports. It surged again on Mar. 24 and 25 after reports emerged that the White House was about to narrow its tariff agenda significantly.

          Instead of broad industry tariffs on major trading partners, Trump would focus tariffs in a more targeted plan to be levied on countries with the most severe US trade imbalances.

          BTC continued to notch gains on Mar. 26 as Trump confirmed the softer tariff stance in an interview:

          “I’ll probably be more lenient than reciprocal, because if I was reciprocal, that would be very tough for people.”

          These confluences signal the crypto rout over February was more about global tariff worries than a reversal in Bitcoin’s earthshaking 28-month uptrend since Dec. 2022.3. Wall St. Bitcoin ETFs Roar Back to Life

          Another rather bullish signal for a Bitcoin trend continuation is the decisive return of inflows to Bitcoin ETFs over several consecutive days beginning on Mar. 14.

          Flows were heavy on St. Patrick’s Day (Mar. 17), with a total quarter billion worth of Bitcoin ETF purchases by regulated Wall Street investors. The following day inflows topped another $200 billion.

          Wall St. is more practical and cautious in its BTC trading than the high-conviction Internet cabal of technology futurists, devout political radicals, and laptop capitalists hooked on crypto market ROIs.

          So, the institutional crowd’s return to bagging crypto ETFs with issuers like BlackRock, Fidelity, and VanEck potentially represents another bullish tailwind that will support more Bitcoin price growth in 2025’s next quarter.4. Social Sentiment Score Flips Positive

          In a solid start to crypto’s week, Bitcoin reached as high as $88.5K for the first time in 17 days. Ethereum also jumped above $2,100 for the first time in 14 days. Comments across social media are becoming quite positive, indicating many expect this rally to continue. pic.twitter.com/3w3ZCs512n

          — Santiment (@santimentfeed) March 24, 2025

          As these bullish indicators emerged for Bitcoin’s rally, social sentiment flipped from FUD (fear, uncertainty, and doubt) to FOMO (fear of missing out).

          Blockchain intelligence company Santiment reported on Mar. 24 that positive Bitcoin sentiment had reached its most bullish levels seen in 6 weeks.

          “Comments across social media are becoming quite positive, indicating many expect this rally to continue,” Santiment said in a post on the X app.

          In addition to these other signals, they may be encouraged by the bevy of Bitcoin whales who bought 200,000 BTC over the period of one month in March.5. White House Floats Gold Sale to Buy Bitcoin

          Executive Director of the @WhiteHouse crypto working group @BoHines talks $BTC, ways to buy more of it and the thinking behind including $ETH, $XRP, $ADA and $SOL in the separate stockpile. https://t.co/dBe1trxAAH pic.twitter.com/mz5Y5p4HgB

          — Eleanor Terrett (@EleanorTerrett) March 21, 2025

          Trump and the crypto segment got married last year during his historic presidential reelection bid. During a whirlwind of the first 65 days in office, it appears that the honeymoon is far from over.

          The president and his appointees continue to give strong assurances of legal clarity and fairness to the crypto industry, while making serious moves toward taking a big bite out of the 21 million Bitcoin that will ever be mined and holding it in reserve for the United States government and citizens.

          But, in a shocking development, a White House crypto official in late March suggested that the government may sell gold from its official stockpile to buy BTC with the proceeds.

          It’s another reminder that Bitcoin is far from a flash in the pan Internet fad, as many have taken pains to point out over the past years. The US government’s embrace signals a sea change in the forward outlook for BTC and support for a stellar secular growth trend on the scale of years and decades.

          Plus in the more immediate term, the cryptocurrency will likely continue to enjoy price support this year from further developments in the US federal policy agenda.

          Risk Warnings and Disclaimers
          You understand and acknowledge that there is a high degree of risk involved in trading. Following any strategies or investment methods may lead to potential losses. The content on the site is provided by our contributors and analysts for information purposes only. You are solely responsible for determining whether any trading assets, securities, strategy, or any other product is suitable for investing based on your own investment objectives and financial situation.
          Add to Favorites
          Share

          Barely Anyone Searching for XRP Now

          U.Today
          Litecoin / Tether
          -1.64%
          1inch / Tether
          -4.20%
          AAVE / Tether
          -1.93%
          Fusionist / Tether
          -5.59%

          XRP search interest has plummeted to 17 across the globe, according to data provided by Google Trends. This marks yet another 2025 low for the popular Ripple-linked cryptocurrency.

          This shows a dramatic decrease from the peak that was recorded back in December.

          The Google Trends website measures the popularity of a certain term on a scale ranging from 0 to 100.

          XRP experienced a massive surge in search interest in late November. This coincided with the token's massive price rally that stole the show in the fourth quarter of 2024.

          After experiencing a significant decline in January, XRP search interest then surged back to a peak of 72 during that month. This coincided with another notable rally that was partially fueled by new regulatory developments, including the departure of SEC Chair Gary Gensler, which kickstarted the loosening of the agency's crypto policies.

          However, search interest has started to steadily decline since then with occasional minor spikes.

          The SEC dropping its appeal against Ripple in mid-March did very little to rekindle interest in XRP, which partially explains why the token also underperformed price-wise. The token also failed to rally at all after Ripple announced what appears to be the final resolution of the case later this month.

          However, with more than a dozen XRP ETF filings awaiting the SEC's verdicts, there is still a way for the token to potentially reappear on the radar.

          As reported by U.Today, BlackRock and Fidelity are also expected to join the fray by one of the leading ETF analysts. This could give the token a much-needed boost.

          Risk Warnings and Disclaimers
          You understand and acknowledge that there is a high degree of risk involved in trading. Following any strategies or investment methods may lead to potential losses. The content on the site is provided by our contributors and analysts for information purposes only. You are solely responsible for determining whether any trading assets, securities, strategy, or any other product is suitable for investing based on your own investment objectives and financial situation.
          Add to Favorites
          Share

          Ethereum (ETH) Awaiting Crucial Crossover: Details

          U.Today
          Litecoin / Tether
          -1.64%
          1inch / Tether
          -4.20%
          AAVE / Tether
          -1.93%
          Fusionist / Tether
          -5.59%

          Ethereum , the second largest cryptocurrency by market capitalization, might be on the verge of a potentially significant shift, as analysts closely monitor the Market Value to Realized Value (MVRV) Ratio. According to crypto analyst Ali, a key crossover could signal an accumulation phase for ETH.

          In a tweet, Ali highlighted the significance of the MVRV Ratio, stating, "Watch the MVRV Ratio closely. A crossover above its 160-day MA has historically signaled strong Ethereum ETH accumulation zones."

          Ali
          @ali_charts

          Watch the MVRV Ratio closely. A crossover above its 160-day MA has historically signaled strong #Ethereum $ETH accumulation zones. pic.twitter.com/Oz06q41EsL

          Mar 29, 2025

          This indicator, which compares ETH’s market value to its realized value, previously signaled key accumulation when it crossed over the 160-day moving average (MA).

          At the time of writing, Ethereum was in red amid an extended sell-off since the past week. At the time of writing, ETH was down 2.03% in the last 24 hours to $1,843, having marked five consecutive days of declines since March 25.

          Top coins fell to their lowest levels in at least a week as stock markets were shaken by macroeconomic concerns. The sell-off continued throughout the weekend, amid hotter-than-expected inflation data released on Friday.

          Ethereum bearish outlook: Is reversal imminent?

          Ethereum has declined by around 44% in 2025 and is on track for its largest quarterly decrease since the bear market in 2022.

          The active developers working on Ethereum-related software fell about 17% last year, according to a December report from Electric Capital. Standard Chartered analysts put out a report this month slashing its year-end forecast for Ethereum by 60%, noting that "its dominance has been waning for some time."

          ETH fell to a low of $1,797 on March 29 following five straight days of losses before recovering to $1,848 in the early Sunday session.

          Bulls might need to push and hold the price over $2,111 to indicate that the bearish trend is fading. The 50-day SMA around $2,293 may act as a barrier to the upside, but if broken, ETH might rise to $2,550.

          On the downside, the $1,800–$1,754 support zone remains critical. Buyers are expected to actively defend this range, as a break below it might reignite the downtrend. The next target in this scenario would be $1,550.

          Risk Warnings and Disclaimers
          You understand and acknowledge that there is a high degree of risk involved in trading. Following any strategies or investment methods may lead to potential losses. The content on the site is provided by our contributors and analysts for information purposes only. You are solely responsible for determining whether any trading assets, securities, strategy, or any other product is suitable for investing based on your own investment objectives and financial situation.
          Add to Favorites
          Share

          The Truth About Ripple (XRP) ETFs: Should You Be Worried?

          CryptoPotato
          Litecoin / Tether
          -1.64%
          1inch / Tether
          -4.20%
          AAVE / Tether
          -1.93%
          Fusionist / Tether
          -5.59%

          XRP’s price has been one of the hottest topics for discussion amongst the crypto community for a while now and that’s understandable.

          After all, it’s an O.G. cryptocurrency that’s here for the past few cycles, but it’s status has been debated at length, especially during Ripple’s legal battle with the US Securities and Exchange Commission. The outcome of this was long touted as a massive catalyst for XRP’s price and it appears that the dispute has reached a turning point and one that is seemingly in favor of the company.XRP and the Outcome of the Ripple v. SEC Lawsuit

          Just recently, Brad Garlinghouse,took it to social mediato share the big news – the Commission quit the pursue of its appeal, essentially putting a de-facto end to the lawsuit – the moment the community was waiting for.

          There it was – the massive catalyst everyone was waiting for, so how did the XRP price react? Initially, there was a sruge, but things calmed down almost immediately and the price has since retraced to the levels from before the self-proclaimed victory.

          This begs the question – what now? Well, it appears that the market is chasing the next potential catalyst – namely, the approval of spot XRP exchange-traded funds in the US.XRP ETFs: The Reality

          Multiple high-profile asset managers have filed applications for the approval of a spot XRP ETF in the United States, the majority of which are awaiting decision by the end of this year. The list includes, but is not limited to Franklin Templeton, Grayscale, Bitwise, Canary Capital, and so forth.

          Many industry expertsare of the opinionthat following Ripple’s de-facto victory in the battle against the US Securities and Exchange Commission, the path to an approval is more or less paved. Why? Well, according to the standing decision of Judge Analisa Torres, XRP sales on the secondary market to regular users do not constitute an investment contract.

          But is the approval of an XRP ETF a potential catalyst for a surge in its price? This depends on one major factor – demand.

          BTC has seen a massively healthy flow in spot-based ETF products since their inception (with the occasional market-drive exceptions), but that’s because of its nature and widely-accepted status of a digital store of value. Its supply is fairly distributed with no single entity controling a dominant share, which is the absolute opposite for ripple.

          XRP’s supply is heavily concentrated and the company behind it – Ripple – controls the market – it’s as simple as that. No locking structures and promises can change the fact that there’s a single centralized entity capable of shifting the market dynamics at any time – something that could be seen as a major deterrent for serious investors even upon the potential approval of a spot XRP ETF.

          And while a short-term surge is likely a given, the longer-term impact on ETFs on XRP’s price is far from certain.

          Risk Warnings and Disclaimers
          You understand and acknowledge that there is a high degree of risk involved in trading. Following any strategies or investment methods may lead to potential losses. The content on the site is provided by our contributors and analysts for information purposes only. You are solely responsible for determining whether any trading assets, securities, strategy, or any other product is suitable for investing based on your own investment objectives and financial situation.
          Add to Favorites
          Share
          FastBull
          Copyright © 2025 FastBull Ltd

          728 RM B 7/F GEE LOK IND BLDG NO 34 HUNG TO RD KWUN TONG KLN HONG KONG

          TelegramInstagramTwitterfacebooklinkedin
          App Store Google Play Google Play
          Products
          Charts

          Chats

          Q&A with Experts
          Screeners
          Economic Calendar
          Data
          Tools
          Membership
          Features
          Function
          Markets
          Copy Trading
          Latest Signals
          Contests
          News
          Analysis
          24/7
          Columns
          Education
          Company
          Careers
          About Us
          Contact Us
          Advertising
          Help Center
          Feedback
          User Agreement
          Privacy Policy
          Business

          White Label

          Data API

          Web Plug-ins

          Poster Maker

          Affiliate Program

          Risk Disclosure

          The risk of loss in trading financial instruments such as stocks, FX, commodities, futures, bonds, ETFs and crypto can be substantial. You may sustain a total loss of the funds that you deposit with your broker. Therefore, you should carefully consider whether such trading is suitable for you in light of your circumstances and financial resources.

          No decision to invest should be made without thoroughly conducting due diligence by yourself or consulting with your financial advisors. Our web content might not suit you since we don't know your financial conditions and investment needs. Our financial information might have latency or contain inaccuracy, so you should be fully responsible for any of your trading and investment decisions. The company will not be responsible for your capital loss.

          Without getting permission from the website, you are not allowed to copy the website's graphics, texts, or trademarks. Intellectual property rights in the content or data incorporated into this website belong to its providers and exchange merchants.

          Not Logged In

          Log in to access more features

          FastBull Membership

          Not yet

          Purchase

          Become a signal provider
          Help Center
          Customer Service
          Dark Mode
          Price Up/Down Colors

          Log In

          Sign Up

          Position
          Layout
          Fullscreen
          Default to Chart
          The chart page opens by default when you visit fastbull.com