• Trade
  • Markets
  • Copy
  • Contests
  • News
  • 24/7
  • Calendar
  • Q&A
  • Chats
Trending
Screeners
SYMBOL
LAST
BID
ASK
HIGH
LOW
NET CHG.
%CHG.
SPREAD
SPX
S&P 500 Index
6870.39
6870.39
6870.39
6895.79
6858.28
+13.27
+ 0.19%
--
DJI
Dow Jones Industrial Average
47954.98
47954.98
47954.98
48133.54
47871.51
+104.05
+ 0.22%
--
IXIC
NASDAQ Composite Index
23578.12
23578.12
23578.12
23680.03
23506.00
+72.99
+ 0.31%
--
USDX
US Dollar Index
98.900
98.980
98.900
98.960
98.730
-0.050
-0.05%
--
EURUSD
Euro / US Dollar
1.16504
1.16511
1.16504
1.16717
1.16341
+0.00078
+ 0.07%
--
GBPUSD
Pound Sterling / US Dollar
1.33256
1.33265
1.33256
1.33462
1.33136
-0.00056
-0.04%
--
XAUUSD
Gold / US Dollar
4204.55
4204.98
4204.55
4218.85
4190.61
+6.64
+ 0.16%
--
WTI
Light Sweet Crude Oil
59.372
59.402
59.372
60.084
59.291
-0.437
-0.73%
--

Community Accounts

Signal Accounts
--
Profit Accounts
--
Loss Accounts
--
View More

Become a signal provider

Sell trading signals to earn additional income

View More

Guide to Copy Trading

Get started with ease and confidence

View More

Signal Accounts for Members

All Signal Accounts

Best Return
  • Best Return
  • Best P/L
  • Best MDD
Past 1W
  • Past 1W
  • Past 1M
  • Past 1Y

All Contests

  • All
  • Trump Updates
  • Recommend
  • Stocks
  • Cryptocurrencies
  • Central Banks
  • Featured News
Top News Only
Share

GFZ Revises Magnitude Of Earthquake In Turkey To 4.9 From 5.45

Share

EU To Delay Proposals For Automotive Sector, Including Co2 Emissions, To Dec 16, Draft EU Commission Document Shows

Share

Kremlin: India Buys Energy Where It Is Profitable To And As Far As We Understand They Will Continue To Do That

Share

Turkey's Main Banking Index Up 2.5%

Share

Turkey's Main BIST-100 Index Up 1.9%

Share

Hungary's Preliminary November Budget Balance Huf -403 Billion

Share

Indian Rupee Down 0.1% At 90.07 Per USA Dollar As Of 3:30 P.M. Ist, Previous Close 89.98

Share

India's Nifty 50 Index Provisionally Ends 0.96% Lower

Share

[JPMorgan: US Stock Rally May Stagnate Following Fed Rate Cut] JPMorgan Strategists Say The Recent Rally In US Stocks May Stall As Investors Take Profits Following The Anticipated Fed Rate Cut. The Market Currently Predicts A 92% Probability Of The Fed Lowering Borrowing Costs On Wednesday. Expectations Of A Rate Cut Have Continued To Rise, Fueled By Positive Signals From Policymakers In Recent Weeks. "Investors May Be More Inclined To Lock In Gains At The End Of The Year Rather Than Increase Directional Exposure," Mislav Matejka's Team Wrote In A Report

Share

Russian Defence Ministry: Russian Forces Take Control Of Novodanylivka In Ukraine's Zaporizhzhia Region

Share

Russian Defence Ministry: Russian Forces Take Control Of Chervone In Ukraine's Donetsk Region

Share

French Finance Ministry: Government Started Process To Block Temporarily Shein Platform

Share

Finance Minister: Indonesia To Impose Coal Export Tax Of Up To 5% Next Year

Share

[Trump Considering Fired Homeland Security Secretary Noem? White House Denies] According To Reports From US Media Outlets Such As The Daily Beast And The UK's Independent, The White House Has Denied Reports That US President Trump Is Considering Firing Homeland Security Secretary Noem. White House Spokesperson Abigail Jackson Posted On Social Media On The 7th Local Time, Calling The Claims "fake News" And Stating That "Secretary Noem Has Done An Excellent Job Implementing The President's Agenda And 'making America Safe Again'."

Share

HKEX: Standard Chartered Bought Back 571604 Total Shares On Other Exchanges For Gbp9.5 Million On Dec 5

Share

Morgan Stanley Reiterates Bullish Outlook On US Stocks Due To Fed Rate Cut Expectations. Morgan Stanley Strategists Believe That The US Stock Market Faces A "bullish Outlook" Given Improved Earnings Expectations And Anticipated Fed Rate Cuts. They Expect Strong Corporate Earnings By 2026, And Anticipate The Fed Will Cut Rates Based On Lagging Or Mildly Weak Labor Markets. They Expect The US Consumer Discretionary Sector And Small-cap Stocks To Continue To Outperform

Share

China's National Development And Reform Commission Announced That Starting From 24:00 On December 8, The Retail Price Limit For Gasoline And Diesel In China Will Be Reduced By 55 Yuan Per Ton, Which Translates To A Reduction Of 0.04 Yuan Per Liter For 92-octane Gasoline, 0.05 Yuan Per Liter For 95-octane Gasoline, And 0.05 Yuan Per Liter For 0# Diesel

Share

Tkms CEO: US Security Strategy Highlights Need For Europe To Take Care Of Its Own Defences

Share

USA S&P 500 E-Mini Futures Up 0.1%, NASDAQ 100 Futures Up 0.18%, Dow Futures Down 0.02%

Share

London Metal Exchange (LME): Copper Inventories Increased By 2,000 Tons, Aluminum Inventories Decreased By 2,500 Tons, Nickel Inventories Increased By 228 Tons, Zinc Inventories Increased By 2,375 Tons, Lead Inventories Decreased By 3,725 Tons, And Tin Inventories Decreased By 10 Tons

TIME
ACT
FCST
PREV
France Industrial Output MoM (SA) (Oct)

A:--

F: --

P: --
France Trade Balance (SA) (Oct)

A:--

F: --

P: --
Euro Zone Employment YoY (SA) (Q3)

A:--

F: --

P: --
Canada Part-Time Employment (SA) (Nov)

A:--

F: --

P: --

Canada Unemployment Rate (SA) (Nov)

A:--

F: --

P: --

Canada Full-time Employment (SA) (Nov)

A:--

F: --

P: --

Canada Labor Force Participation Rate (SA) (Nov)

A:--

F: --

P: --

Canada Employment (SA) (Nov)

A:--

F: --

P: --

U.S. PCE Price Index MoM (Sept)

A:--

F: --

P: --

U.S. Personal Income MoM (Sept)

A:--

F: --

P: --

U.S. Core PCE Price Index MoM (Sept)

A:--

F: --

P: --

U.S. PCE Price Index YoY (SA) (Sept)

A:--

F: --

P: --

U.S. Core PCE Price Index YoY (Sept)

A:--

F: --

P: --

U.S. Personal Outlays MoM (SA) (Sept)

A:--

F: --

P: --
U.S. 5-10 Year-Ahead Inflation Expectations (Dec)

A:--

F: --

P: --

U.S. Real Personal Consumption Expenditures MoM (Sept)

A:--

F: --

P: --
U.S. Weekly Total Rig Count

A:--

F: --

P: --

U.S. Weekly Total Oil Rig Count

A:--

F: --

P: --

U.S. Consumer Credit (SA) (Oct)

A:--

F: --

P: --
China, Mainland Foreign Exchange Reserves (Nov)

A:--

F: --

P: --

Japan Trade Balance (Oct)

A:--

F: --

P: --

Japan Nominal GDP Revised QoQ (Q3)

A:--

F: --

P: --

China, Mainland Imports YoY (CNH) (Nov)

A:--

F: --

P: --

China, Mainland Exports (Nov)

A:--

F: --

P: --

China, Mainland Imports (CNH) (Nov)

A:--

F: --

P: --

China, Mainland Trade Balance (CNH) (Nov)

A:--

F: --

P: --

China, Mainland Exports YoY (USD) (Nov)

A:--

F: --

P: --

China, Mainland Imports YoY (USD) (Nov)

A:--

F: --

P: --

Germany Industrial Output MoM (SA) (Oct)

A:--

F: --

P: --
Euro Zone Sentix Investor Confidence Index (Dec)

A:--

F: --

P: --

Canada National Economic Confidence Index

--

F: --

P: --

U.K. BRC Like-For-Like Retail Sales YoY (Nov)

--

F: --

P: --

U.K. BRC Overall Retail Sales YoY (Nov)

--

F: --

P: --

Australia Overnight (Borrowing) Key Rate

--

F: --

P: --

RBA Rate Statement
RBA Press Conference
Germany Exports MoM (SA) (Oct)

--

F: --

P: --

U.S. NFIB Small Business Optimism Index (SA) (Nov)

--

F: --

P: --

Mexico 12-Month Inflation (CPI) (Nov)

--

F: --

P: --

Mexico Core CPI YoY (Nov)

--

F: --

P: --

Mexico PPI YoY (Nov)

--

F: --

P: --

U.S. Weekly Redbook Index YoY

--

F: --

P: --

U.S. JOLTS Job Openings (SA) (Oct)

--

F: --

P: --

China, Mainland M1 Money Supply YoY (Nov)

--

F: --

P: --

China, Mainland M0 Money Supply YoY (Nov)

--

F: --

P: --

China, Mainland M2 Money Supply YoY (Nov)

--

F: --

P: --

U.S. EIA Short-Term Crude Production Forecast For The Year (Dec)

--

F: --

P: --

U.S. EIA Natural Gas Production Forecast For The Next Year (Dec)

--

F: --

P: --

U.S. EIA Short-Term Crude Production Forecast For The Next Year (Dec)

--

F: --

P: --

EIA Monthly Short-Term Energy Outlook
U.S. API Weekly Gasoline Stocks

--

F: --

P: --

U.S. API Weekly Cushing Crude Oil Stocks

--

F: --

P: --

U.S. API Weekly Crude Oil Stocks

--

F: --

P: --

U.S. API Weekly Refined Oil Stocks

--

F: --

P: --

South Korea Unemployment Rate (SA) (Nov)

--

F: --

P: --

Japan Reuters Tankan Non-Manufacturers Index (Dec)

--

F: --

P: --

Japan Reuters Tankan Manufacturers Index (Dec)

--

F: --

P: --

Japan Domestic Enterprise Commodity Price Index MoM (Nov)

--

F: --

P: --

Japan Domestic Enterprise Commodity Price Index YoY (Nov)

--

F: --

P: --

China, Mainland PPI YoY (Nov)

--

F: --

P: --

Q&A with Experts
    • All
    • Chatrooms
    • Groups
    • Friends
    Connecting
    .
    .
    .
    Type here...
    Add Symbol or Code

      No matching data

      All
      Trump Updates
      Recommend
      Stocks
      Cryptocurrencies
      Central Banks
      Featured News
      • All
      • Russia-Ukraine Conflict
      • Middle East Flashpoint
      • All
      • Russia-Ukraine Conflict
      • Middle East Flashpoint
      Search
      Products

      Charts Free Forever

      Chats Q&A with Experts
      Screeners Economic Calendar Data Tools
      Membership Features
      Data Warehouse Market Trends Institutional Data Policy Rates Macro

      Market Trends

      Market Sentiment Order Book Forex Correlations

      Top Indicators

      Charts Free Forever
      Markets

      News

      News Analysis 24/7 Columns Education
      From Institutions From Analysts
      Topics Columnists

      Latest Views

      Latest Views

      Trending Topics

      Top Columnists

      Latest Update

      Signals

      Copy Rankings Latest Signals Become a signal provider AI Rating
      Contests
      Brokers

      Overview Brokers Assessment Rankings Regulators News Claims
      Broker listing Forex Brokers Comparison Tool Live Spread Comparison Scam
      Q&A Complaint Scam Alert Videos Tips to Detect Scam
      More

      Business
      Events
      Careers About Us Advertising Help Center

      White Label

      Data API

      Web Plug-ins

      Affiliate Program

      Awards Institution Evaluation IB Seminar Salon Event Exhibition
      Vietnam Thailand Singapore Dubai
      Fans Party Investment Sharing Session
      FastBull Summit BrokersView Expo
      Recent Searches
        Top Searches
          Markets
          News
          Analysis
          User
          24/7
          Economic Calendar
          Education
          Data
          • Names
          • Latest
          • Prev

          View All

          No data

          Scan to Download

          Faster Charts, Chat Faster!

          Download App
          English
          • English
          • Español
          • العربية
          • Bahasa Indonesia
          • Bahasa Melayu
          • Tiếng Việt
          • ภาษาไทย
          • Français
          • Italiano
          • Türkçe
          • Русский язык
          • 简中
          • 繁中
          Open Account
          Search
          Products
          Charts Free Forever
          Markets
          News
          Signals

          Copy Rankings Latest Signals Become a signal provider AI Rating
          Contests
          Brokers

          Overview Brokers Assessment Rankings Regulators News Claims
          Broker listing Forex Brokers Comparison Tool Live Spread Comparison Scam
          Q&A Complaint Scam Alert Videos Tips to Detect Scam
          More

          Business
          Events
          Careers About Us Advertising Help Center

          White Label

          Data API

          Web Plug-ins

          Affiliate Program

          Awards Institution Evaluation IB Seminar Salon Event Exhibition
          Vietnam Thailand Singapore Dubai
          Fans Party Investment Sharing Session
          FastBull Summit BrokersView Expo

          Crypto Market Crash Today [ LIVE] Updates October 11th

          Coinpedia
          Ethereum / Tether
          +4.22%
          Avantis / USD Coin
          -0.32%
          Toshi / USD Coin
          0.00%
          Avantis / Tether
          -1.21%
          Toshi / Tether
          +3.29%

          October 11, 2025 06:11:45 UTC

          TimeValue Indicator Signals Crypto Bottom Amid Market Outflows

          The crypto crash likely came as no surprise. In the short term, capital outflows from both US and Hong Kong markets are exceeding long-term movements, signaling temporary market pressure. Despite this, the cryptocurrency market remains fundamentally healthy, and the key focus is on identifying the right entry point. The TimeValue indicator has proven effective at capturing market bottoms, offering potential opportunities in the coming days for prepared investors.

          October 11, 2025 06:05:39 UTC

          Bitcoin Price Today

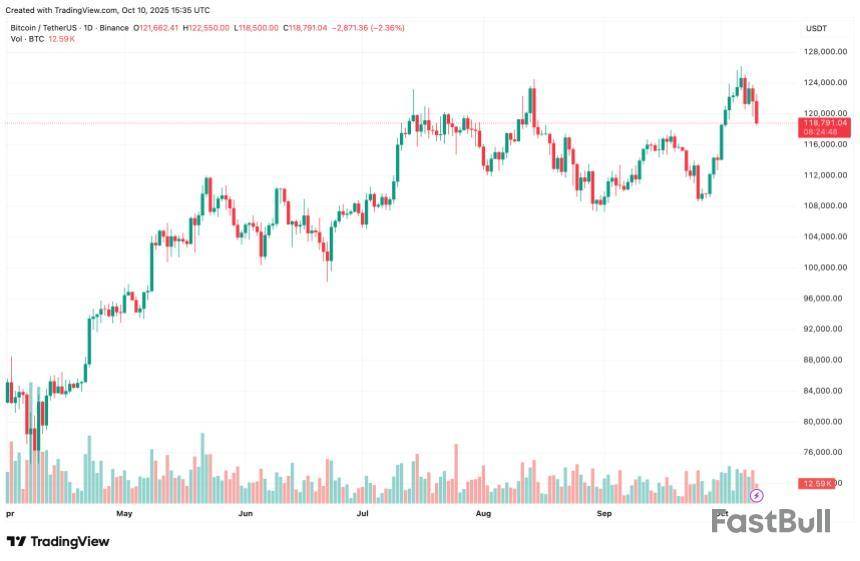
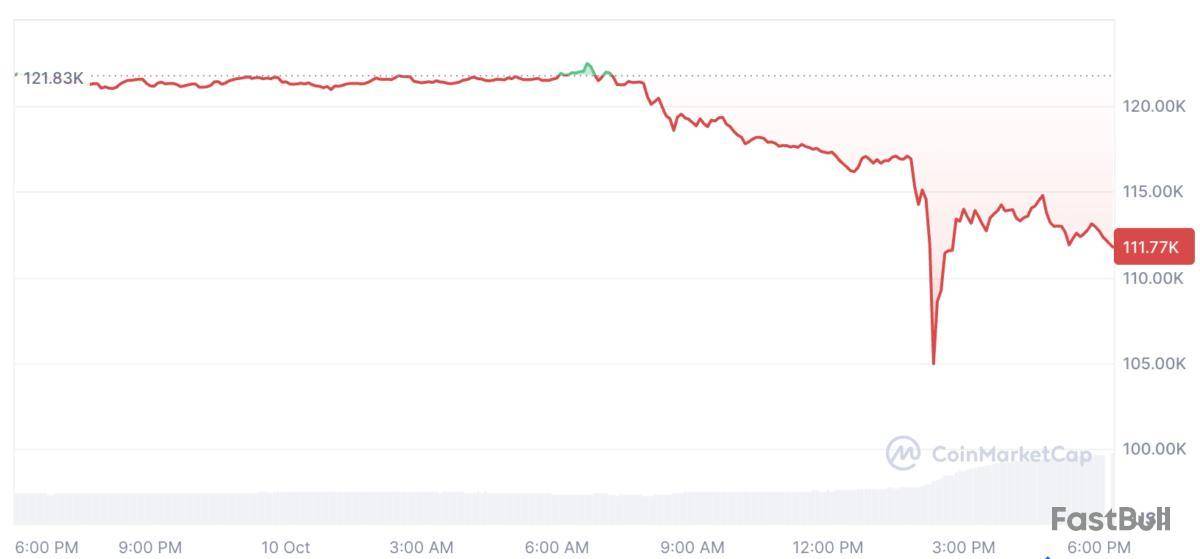
          Bitcoin is currently in a consolidation phase after a recent sharp drop, trading around $113,055 with slight volatility over the last 24 hours. The short-term trend is neutral with a slight bearish bias, as the market seeks direction. Key support is seen at $112,000, which must hold to prevent further downside, while crucial resistance at $114,000 needs to be broken for the next upward move. Market pressure is influenced by US macroeconomic news and profit-taking after recent highs, suggesting that BTC will likely continue sideways trading until fresh economic data provides a clearer trend.

          October 11, 2025 06:03:58 UTC

          Crypto Crash, BTC Price Crash Follows S&P 500 Drop

          Global markets entered risk-off mode after Trump announced 100% tariffs on China, sparking renewed trade war fears. The S&P 500 dropped 2.7%, and Bitcoin followed suit, highlighting that this is a macro liquidity shock, not just a crypto-specific issue. Historically, BTC bottoms when fear peaks, as smart money quietly accumulates during panic. While volatility may continue, the risk-off wave often fades once markets fully price in shocks, potentially setting the stage for strategic buying.

          October 11, 2025 05:52:25 UTC

          Bitcoin Price Crash Today

          Bitcoin is trading at $112,594, down 7.24% in the last 24 hours, marking one of its largest single-day drops in recent weeks. The sharp decline reflects intensified profit-taking and rising market volatility. The drop signals a corrective phase after highs above $124K, with sellers controlling the market. Key support lies around $111K–$110K, while investor sentiment turns cautious. Short-term traders should monitor $111K for rebounds or deeper corrections. Long-term investors may view this pullback as a strategic accumulation opportunity.

          October 11, 2025 05:52:25 UTC

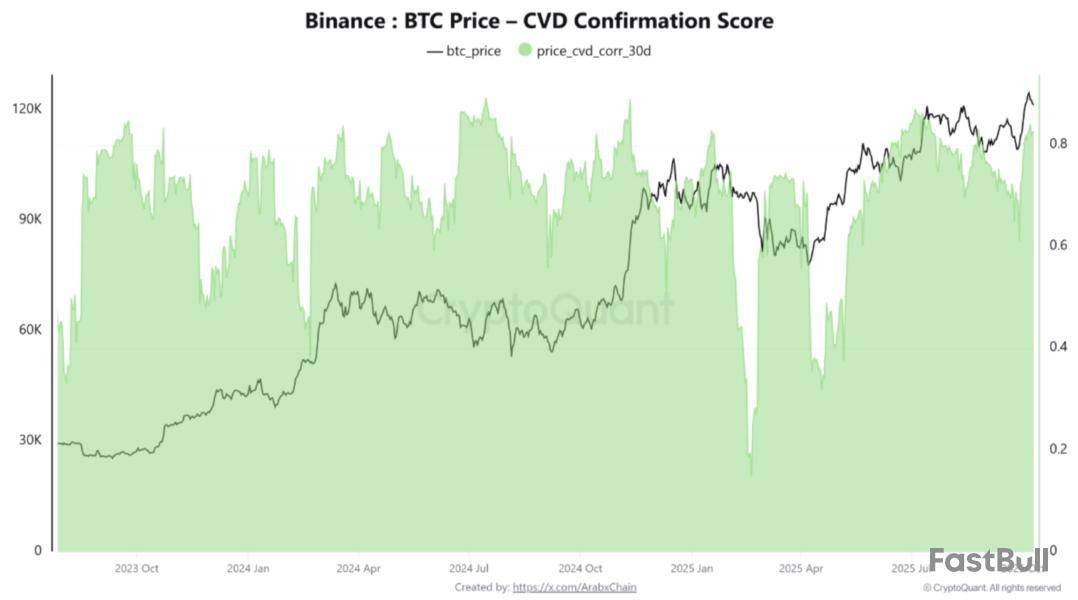
          Bitcoin Bull Run Intact Despite Recent Volatility

          Despite recent dips, Bitcoin remains above its 200-day SMA ($106,800) and just below the STH cost basis ($114,000), signaling that the bull market is still intact. The current pattern shows range-bound consolidation, building a solid base before steady upward moves, no blow-off top, just healthy, gradual growth. If this pattern continues, the Bitcoin cycle could extend well into next year. Prices at these levels are consistent with recent weeks, reflecting ongoing market resilience.

          October 11, 2025 05:43:17 UTC

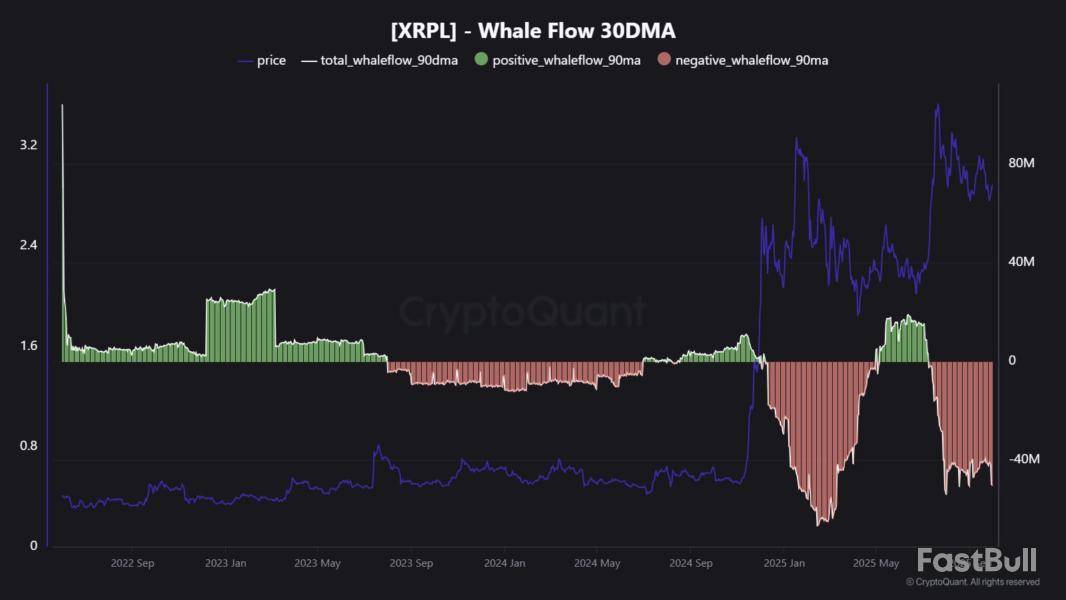
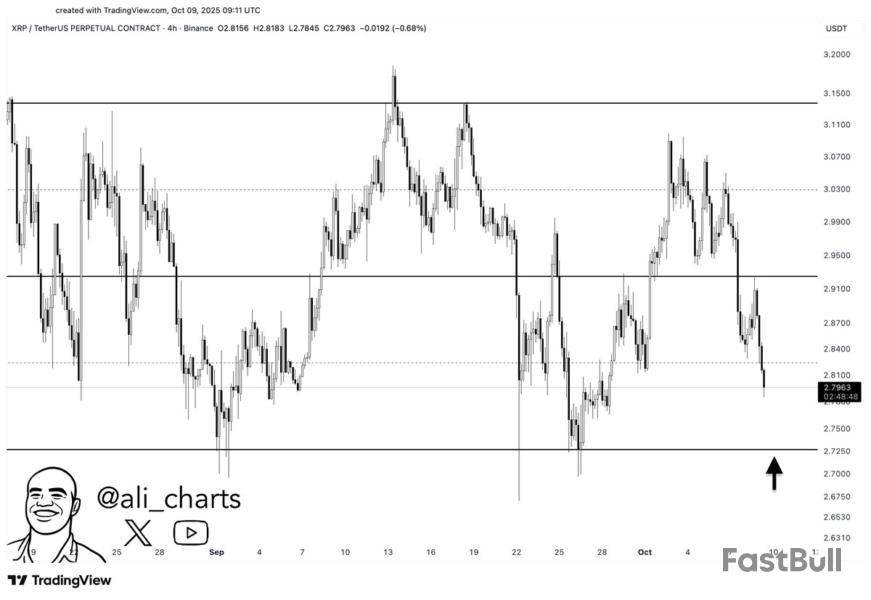
          Bitcoin, Ethereum and XRP Price Crash

          Bitcoin () tumbled from an intraday high of $122,456 to a low of $105,262, dropping 6.83% and currently holding at $112,975. Ethereum fell 12.15%, Binance Coin dropped 9.87%, and XRP plunged from $2.83 to $1.89, marking a 13.17% loss. The sharp declines across major cryptocurrencies highlight intense selling pressure and ongoing market volatility, leaving traders cautious as the market seeks its next support levels.

          October 11, 2025 05:43:17 UTC

          Crypto Market Crash: Crypto Liquidations Shake the Market

          The entire crypto market crashed within a single candle. Leverage traders faced massive liquidations as panic spread across exchanges. Bitcoin, Ethereum, and top altcoins turned deep red while liquidity vanished in minutes, leaving order books thin and spreads wide. Trading bots and algorithms amplified the chaos, accelerating the crash. As traders rushed to exit, the market showed no mercy. The plunge was a stark reminder that crypto rewards the brave but punishes the careless.

          October 11, 2025 05:42:33 UTC

          Crypto Bloodbath: 96% of Traders Wiped Out as Institutions Quietly Accumulate

          A massive crypto crash has wiped out nearly 96% of futures traders, triggering widespread panic selling among spot holders. Billions in liquidations swept through the market as prices plunged across major assets. Yet behind the chaos, institutions are quietly accumulating, mirroring the pattern seen after the March 2020 COVID crash, which later sparked one of the biggest altcoin seasons in history. While retail fear dominates, smart money appears to be buying the dip once again.

          October 11, 2025 05:24:21 UTC

          Was This Crypto Crash Planned?

          The October 2025 crypto crash wasn’t just chaos; it looked orchestrated. While retail traders were liquidated, insiders made billions. Hours before Trump announced 100% China tariffs, a 2011 Bitcoin whale opened billion-dollar shorts on BTC and ETH, which were soon mirrored by linked wallets. When markets plunged Bitcoin down 13%, Ethereum down 18%, and altcoins down 90% that whale doubled down, earning around $200 million. Over $1T was erased, 1.4M traders were wiped out, and stablecoins even depegged.

          October 11, 2025 05:24:21 UTC

          Bitcoin Whale Sits on $35.8M Profit After Perfectly Timed Shorts

          A Bitcoin whale who opened massive short positions on BTC and ETH just before the recent crash is now sitting on over $35.8 million in unrealized profit and still hasn’t closed their trades. The move suggests they expect prices to fall even further. The timing has fueled speculation of insider knowledge, as the market plunged shortly after Trump’s tariff announcement. Once again, it appears the crypto market’s biggest moves favor those in the know.

          October 11, 2025 05:24:21 UTC

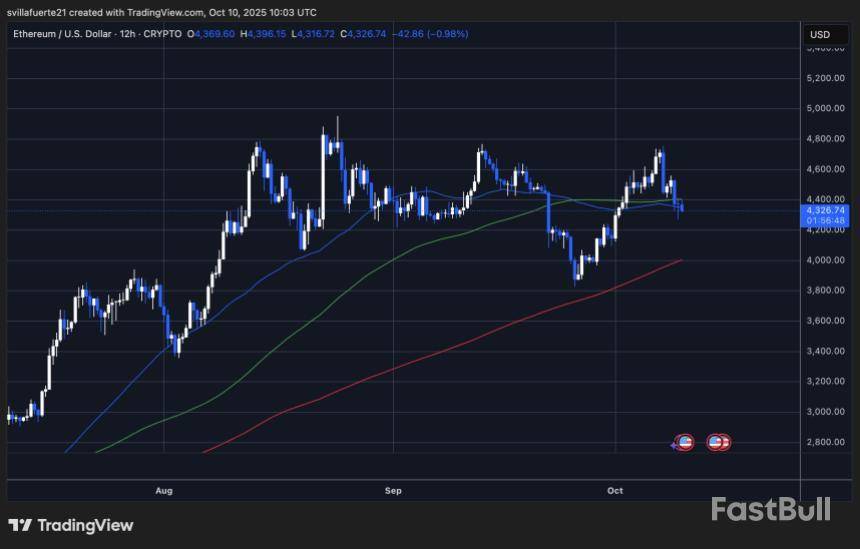
          Ethereum Price Crash Faces More Than Bitcoin

          Gold advocate and Bitcoin critic Peter Schiff has sounded another alarm—this time on Ethereum’s sharp decline. While Bitcoin has dropped about 10% from its all-time high, Ether is down over 21%, now hovering near $3,900. Schiff cautioned that if ETH breaks its key support at $3,350, it could swiftly plunge toward $1,500. Known for his bearish stance on crypto, Schiff urged investors to “get out now,” predicting deeper pain if market sentiment worsens.

          Peter Schiff
          @PeterSchiff

          As bad as Bitcoin looks, Ethereum looks even worse. While Bitcoin is only down about 10% from its record high priced in U.S. dollars, Ether is down 21%. It’s now trading near $3,900. If it breaks support around $3,350, a quick move down to $1,500 is a real risk. Get out now!

          Oct 10, 2025

          October 11, 2025 05:12:37 UTC

          The Truth Behind the Crypto Crash Today

          The recent crypto crash became the perfect storm for the biggest liquidation event in history, wiping out over $19 billion as hidden leverage across the market unraveled. Traders and funds had shifted from spot to leveraged positions chasing perp DEX airdrops, masking true market risk. When Trump’s 100% tariff announcement hit an already overbought equities market, it triggered a chain reaction. Fragile altcoin liquidity, overexposed leverage, and mismatched valuations caused a violent unwinding, forcing funds to liquidate. A brutal reset yet a setup for the next cycle.

          October 11, 2025 05:12:37 UTC

          Crypto Liquidation Today Hit $19.16 billion

          The crypto market just witnessed its largest liquidation event in history, with over $19.16 billion wiped out in hours nearly 20x bigger than the March 2020 Covid crash and far surpassing the $1.6 billion FTX collapse. Triggered by Trump’s 100% tariff announcement on Chinese imports, Bitcoin plunged to $102K, altcoins crashed up to 90%, and over $1 trillion in market cap vanished. The event marks a historic leverage flush, resetting the market for the next potential bull phase.

          October 11, 2025 05:12:37 UTC

          Why Crypto Market is Crashing?

          The crypto market crashed after Trump announced 100% tariffs on Chinese imports starting November 1, shocking global markets. Bitcoin plunged to $102K, altcoins dropped up to 90%, and over $1 trillion in market cap vanished within hours. On-chain data revealed a whale had opened massive shorts on BTC and ETH days before the announcement, profiting $200M from the crash. The event wiped out leverage and weak hands signaling a potential market reset rather than the end of the bull cycle.

          Risk Warnings and Disclaimers
          You understand and acknowledge that there is a high degree of risk involved in trading. Following any strategies or investment methods may lead to potential losses. The content on the site is provided by our contributors and analysts for information purposes only. You are solely responsible for determining whether any trading assets, securities, strategy, or any other product is suitable for investing based on your own investment objectives and financial situation.
          Add to Favorites
          Share

          Bitcoin Buyers Dominate On Binance As CVD Confirmation Nears 0.9, Signaling $130K Target Zone

          NewsBTC
          Ethereum / Tether
          +4.22%
          Avantis / USD Coin
          -0.32%
          Toshi / USD Coin
          0.00%
          Avantis / Tether
          -1.21%
          Toshi / Tether
          +3.29%

          Following a new all-time high (ATH) of $126,199 on Binance, Bitcoin (BTC) is now consolidating in the low $120,000 range. Latest exchange data – such as Cumulative Volume Delta (CVD) Confirmation Score – suggests that BTC is benefitting from strong underlying demand.

          CVD Confirmation Shows Strong Demand For Bitcoin

          According to a CryptoQuant Quicktake post by contributor Arab Chain, Bitcoin’s CVD Confirmation Score – a 30-day rolling correlation between Bitcoin’s price and the CVD – is suggesting a strong resynchronization of the trend.

          For the uninitiated, the CVD Confirmation Score measures the 30-day correlation between Bitcoin’s price and the CVD, which tracks the net difference between taker buy and sell volumes on exchanges. A high score (above 0.7) indicates that price increases are backed by real buying pressure, while a low or negative score suggests weak or speculative momentum.

          Latest data from Binance shows that the CVD Confirmation Score currently hovers around 0.8 to 0.9, indicating that the current price surge is largely driven by genuine taker buying rather than a technical bounce or a short squeeze.

          cq1

          Past data also suggests that whenever this data point has remained about 0.7 for an extended period, price corrections tend to be relatively shallow and short-lived. This is because new liquidity in the market quickly absorbs any incoming supply of BTC.

          The CryptoQuant analyst remarked that if the CVD Confirmation Score continues to hover above 0.7 – coupled with a decisive breakout above the $124,000 – $126,000 resistance zone – then it could be on its way to a potential target of as high as $135,000.

          However, any negative divergence with BTC price rising and CVD Confirmation Score dropping below 0.4 should be seen as a warning sign, as it increases the likelihood of distribution or liquidation pressure.

          Conversely, the $112,000 – $115,000 and $108,000 – $110,000 stand out as strong support levels for BTC. At these price levels, the CVD Confirmation Score should remain steady to ensure the uptrend remains intact. Arab Chain added:

          The underlying trend is bullish and supported by real inflows on Binance, the highest-volume exchange globally. Monitor three confirmation signals: CVD Confirmation stays high, open interest remains moderate, and funding does not become excessive. Any clear imbalance across these metrics will be the first warning of a momentum shift.

          Is BTC Due For A Correction?

          While bulls are hoping for an extended rally for BTC, some analysts aren’t quite convinced about the digital asset surging to new highs in the near term. For instance, crypto analyst ZVN recently stated that BTC may witness a pullback before its next surge to $150,000.

          Similarly, fellow crypto analyst Dick Dandy recently predicted that BTC may witness a massive 60% price correction, falling all the way down to $43,900. At press time, BTC trades at $118,791, down 1.8% in the past 24 hours.

          bitcoin
          Risk Warnings and Disclaimers
          You understand and acknowledge that there is a high degree of risk involved in trading. Following any strategies or investment methods may lead to potential losses. The content on the site is provided by our contributors and analysts for information purposes only. You are solely responsible for determining whether any trading assets, securities, strategy, or any other product is suitable for investing based on your own investment objectives and financial situation.
          Add to Favorites
          Share

          XRP Whales Are Selling: $50 Million Exiting Wallets Every Day

          NewsBTC
          Ethereum / Tether
          +4.22%
          Avantis / USD Coin
          -0.32%
          Toshi / USD Coin
          0.00%
          Avantis / Tether
          -1.21%
          Toshi / Tether
          +3.29%

          On-chain data shows the 30-day netflow of the XRP whales has remained deep negative recently, a sign that the asset is under persistent selling pressure.

          XRP Whale Flow Is At A Negative $50 Million Per Day At The Moment

          As explained by CryptoQuant community analyst Maartunn in a new post on X, XRP whales have been offloading coins recently. “Whales” refer to the big-money investors who hold significant amounts in their wallets and carry some influence in the market.

          The behavior of these key investors can often be worth keeping an eye on, as even if it may not always directly correlate with the asset’s trajectory, it can still be revealing about how the influential entities are feeling about the cryptocurrency.

          There are many ways to track the behavior of the XRP whales, with one such being the metric cited by Maartunn: the Whale Flow. This indicator measures the net amount of coins that’s entering into or exiting out of the wallets of this cohort.

          Below is the chart shared by the analyst that shows the trend in the 30-day moving average (MA) of the XRP Whale Flow over the last few years:

          XRP Whale Flow

          As is visible in the above graph, the 30-day MA XRP Whale Flow plunged to a highly negative value in July as the coin reached its top above $3.6. This suggests that the large holders took the opportunity of the rally to participate in profit-taking.

          Interestingly, since this plummet in the indicator, its value has remained at a similarly red value until today, meaning that the whales have only continued to apply selling pressure.

          At present, the metric is sitting at a negative value of $50 million per day, meaning that whales have been withdrawing an average of $50 million every day for the past month. This could be a reason why the cryptocurrency hasn’t seen any big rally recently, while Bitcoin and other coins have been flying.

          In some other news, analyst Ali Martinez has identified a price level that could help turn XRP around. As the below chart shared by Martinez in an X post shows, the coin has seemingly been trading inside a Parallel Channel over the last couple of months.

          XRP Parallel Channel

          A Parallel Channel is a technical analysis (TA) consolidation pattern that forms when an asset trades between two parallel trendlines. The lower level of the pattern acts as a support line. From the chart, it’s visible that in the case of this XRP Parallel Channel, it’s situated at $2.73.

          The analyst has noted that if this support level holds, the coin could see a rebound to the upper level at $3.10.

          XRP Price

          At the time of writing, XRP is trading around $0.745, down more than 11% over the last week.

          Risk Warnings and Disclaimers
          You understand and acknowledge that there is a high degree of risk involved in trading. Following any strategies or investment methods may lead to potential losses. The content on the site is provided by our contributors and analysts for information purposes only. You are solely responsible for determining whether any trading assets, securities, strategy, or any other product is suitable for investing based on your own investment objectives and financial situation.
          Add to Favorites
          Share

          RLUSD Stablecoin Bags Major Booster As Ripple Expands Into Bahrain Via New Strategic Partnership

          ZyCrypto
          Ethereum / Tether
          +4.22%
          Avantis / USD Coin
          -0.32%
          Toshi / USD Coin
          0.00%
          Avantis / Tether
          -1.21%
          Toshi / Tether
          +3.29%

          Ripple's RLUSD Eyes Multi-Billion-Dollar USDT European Market Following Regulatory Debacle
          Ripple is expanding its footprint in Bahrain through a new tie-up with a local fintech ecosystem builder.

          Risk Warnings and Disclaimers
          You understand and acknowledge that there is a high degree of risk involved in trading. Following any strategies or investment methods may lead to potential losses. The content on the site is provided by our contributors and analysts for information purposes only. You are solely responsible for determining whether any trading assets, securities, strategy, or any other product is suitable for investing based on your own investment objectives and financial situation.
          Add to Favorites
          Share

          LTC Price Soars 11% to $129: Analysts Eye $135 Breakout as ETF Approval Buzz Grows

          NewsBTC
          Ethereum / Tether
          +4.22%
          Avantis / USD Coin
          -0.32%
          Toshi / USD Coin
          0.00%
          Avantis / Tether
          -1.21%
          Toshi / Tether
          +3.29%

          Litecoin (LTC) ripped as much as 11% to $129–$131, outpacing Bitcoin and Ethereum during a market pullback as fresh spot ETF momentum stoked bids. Trading volume exploded 143% to $1.66B, while futures open interest jumped 25% to $1.21B, signaling new leverage and renewed directional conviction.

          The catalyst is linked to the growing confidence that a U.S.-listed spot Litecoin ETF could be near the finish line. Canary Capital’s updated S-1 now includes ticker LTCC and a 0.95% fee, the kind of last-mile filing detail ETF watchers say typically appears “before go-time.”

          With Grayscale and CoinShares also in the hunt, analysts argue LTC’s commodity-like profile and long proof-of-work history make it one of the cleaner alt candidates for regulated fund access once the SEC resumes normal operations.

          Litecoin Technical setup: $130 reclaim tees up $135–$138

          On the charts, Litecoin blasted through the $127.45 swing high and reclaimed stacked moving averages (7- and 30-day SMAs), turning the multi-month range from ceiling to potential floor. RSI (68) shows strong momentum without a blow-off, and MACD remains firmly positive.

          Immediate resistance sits at $130–$131; a daily close above opens a path to $134–$135, then $138 and $150. Should FOMO follow an ETF headline, bulls point to a broader vacuum up to the $150–$160 zone, Litecoin’s highest region since early 2022.

          On higher time frames, some technicians note a breakout from a year-long diagonal that, if confirmed, preserves a stretch target toward $275 over the coming months; that scenario likely requires sustained ETF-driven inflows.

          Litecoin LTC LTCUSD

          LTC Levels That Matter, And What Could Invalidate

          For momentum traders, the line in the sand is $125: lose it decisively and swift profit-taking could drag LTC back into $122–$125 support, with $115–$118 as a deeper retest.

          Hold above $125 and reclaim $130 with volume, and bulls keep control into $135–$138. Macro remains a swing factor; government shutdown timing, SEC throughput, and broader crypto risk appetite can still inject volatility.

          As long as $125 holds and $130 flips to support, the $135–$138 breakout looks within reach, while a green light for LTCC could be the spark that extends the move toward $150–$160 next. For searchers tracking the Litecoin price, keep your eyes on $130: it’s the path to the next leg.

          Cover image from ChatGPT, LTCUSD chart from Tradingview

          Risk Warnings and Disclaimers
          You understand and acknowledge that there is a high degree of risk involved in trading. Following any strategies or investment methods may lead to potential losses. The content on the site is provided by our contributors and analysts for information purposes only. You are solely responsible for determining whether any trading assets, securities, strategy, or any other product is suitable for investing based on your own investment objectives and financial situation.
          Add to Favorites
          Share

          Bitmine Receives 23,823 Ethereum From BitGo As Institutional Accumulation Continues

          NewsBTC
          Ethereum / Tether
          +4.22%
          Avantis / USD Coin
          -0.32%
          Toshi / USD Coin
          0.00%
          Avantis / Tether
          -1.21%
          Toshi / Tether
          +3.29%

          Ethereum is trading at critical price levels after a sharp 10% decline from the $4,750 mark, reflecting growing uncertainty across the broader crypto market. The recent correction has pushed ETH toward the $4,300 support zone, a level that bulls are now fiercely defending to prevent a deeper retracement. Despite the pullback, on-chain data suggests that large holders remain confident, signaling that this dip may be part of a healthy market reset rather than the start of a downtrend.

          According to recent data, Bitmine continues its aggressive accumulation of ETH, adding to its holdings even as prices fluctuate. This steady inflow from institutional players highlights strong conviction in Ethereum’s long-term fundamentals, particularly as the network maintains dominance in DeFi and smart contract activity.

          Still, sentiment among retail traders remains mixed. Some fear that sustained weakness below $4,300 could trigger another wave of selling pressure, while others see this as a potential accumulation opportunity before the next major move. As Ethereum stabilizes at these levels, the coming days will be crucial to determine whether the market resumes its bullish momentum or enters a prolonged consolidation phase amid heightened volatility.

          Ethereum Accumulation Continues As Bitmine Strengthens Its Position

          According to data shared by Lookonchain, institutional accumulation around Ethereum remains strong despite recent market volatility. Just a few hours ago, Bitmine received another 23,823 ETH (worth $103.68 million) from BitGo, marking yet another significant inflow of capital. This move comes only two days after Bitmine acquired 20,020 ETH ($89.7 million) via FalconX, underscoring their consistent strategy of building exposure during price dips rather than chasing rallies.

          Bitmine buying ETH from Falcon X (October 8) | Source: Lookonchain

          Such accumulation patterns are often seen as a sign of confidence in Ethereum’s long-term fundamentals, particularly from institutional investors who view ETH as a core asset within the broader digital economy. While short-term sentiment remains cautious after the recent correction, these inflows suggest that smart money continues to see value around current prices.

          The coming days will be critical for Ethereum’s technical structure. Bulls must defend the $4,300 support zone to maintain momentum and set up a potential recovery toward the $4,600–$4,750 resistance area. A strong defense here could pave the way for a new all-time high, confirming renewed investor confidence and establishing $4,300 as a key accumulation level.

          Bulls Defend $4,300 Support

          Ethereum (ETH) is currently trading near $4,325, showing signs of consolidation after a 10% decline from its recent high of $4,750. The 12-hour chart reveals that ETH has fallen below the 50-day moving average (blue line), signaling short-term weakness, while the 100-day (green) and 200-day (red) moving averages are still trending upward — a sign that the broader uptrend remains intact.

          ETH consolidation continues | Source: ETHUSDT chart on TradingView

          The $4,300 level now acts as a key support zone, with bulls attempting to establish a base and prevent further downside pressure. If this level holds, the next target would be a retest of $4,500–$4,600, where sellers are likely to reappear. However, a break below $4,250 could expose Ethereum to a deeper pullback toward the $4,000 psychological level, an area that previously served as a strong accumulation zone in late September.

          Momentum indicators suggest that selling pressure is easing, aligning with the recent on-chain data showing continued accumulation from large entities such as Bitmine. This reinforces the idea that institutional confidence remains strong, even amid volatility. For now, holding above $4,300 is critical — a successful defense could mark the foundation for Ethereum’s next push toward new highs.

          Featured image from ChatGPT, chart from TradingView.com

          Risk Warnings and Disclaimers
          You understand and acknowledge that there is a high degree of risk involved in trading. Following any strategies or investment methods may lead to potential losses. The content on the site is provided by our contributors and analysts for information purposes only. You are solely responsible for determining whether any trading assets, securities, strategy, or any other product is suitable for investing based on your own investment objectives and financial situation.
          Add to Favorites
          Share

          Bitcoin slump may rebound up to 21% in 7 days if history repeats: Economist

          Cointelegraph
          Ethereum / Tether
          +4.22%
          Avantis / USD Coin
          -0.32%
          Toshi / USD Coin
          0.00%
          Avantis / Tether
          -1.21%
          Toshi / Tether
          +3.29%

          Bitcoin’s price may recover up to 21% over the coming seven days if October’s historical trends hold, an economist suggests.

          “Drops of more than 5% in October are exceedingly rare. This has happened only 4 times in the past 10 years,” economist Timothy Peterson said in an X post on Friday.’

          He said those instances occurred in October 2017, 2018, 2019, and 2021. In the week following each drop, Bitcoin (BTC) rebounded by 16% in 2017, 4% in 2018, and 21% in 2019. The only exception was 2021, when the crypto asset fell a further 3%.

          October is often dubbed “Uptober” for its historically strong returns.

          Cryptocurrencies, Bitcoin Price

          Since 2013, October has been Bitcoin’s second-best performing month on average, delivering an average return of 20.10%, trailing only November, which has had an average gain of 46.02%, according to data from CoinGlass.

          If history repeats, Bitcoin may skyrocket to $124,000

          Peterson’s comments came after Bitcoin plunged to $102,000 on Friday following US President Donald Trump’s announcement of a 100% tariff on China.

          At the time of publication, Bitcoin has already slightly recovered to $112,468, after only reaching a new all-time high of $125,100 on Monday, according to CoinMarketCap.

          Cryptocurrencies, Bitcoin Price

          If history repeats and Bitcoin mirrors its strongest October rebound — the 21% surge in 2019 — a similar move from Friday’s low of $102,000 would place the cryptocurrency just below its latest all-time high, around $124,000, within a week.

          Bitcoiners emphasize that it is still early in October

          Several other Bitcoin advocates remain confident that the uptrend will continue.

          In an X post on Friday, Jan3 founder Samson Mow said, “There are still 21 days left in Uptober.” MN Trading Capital founder Michael van de Poppe said, “This is the bottom of the current cycle.”

          “The biggest liquidation crash in history. COVID-19 was the bottom of the previous cycle,” he said.

          Some analysts took a longer-term view. The Bitcoin Libertarian said, “In a few years, Bitcoin will crash from $1M to $0.8M in a few hours, and we’ll all be talking about a new record high amount of liquidations.”

          “Let history repeat,” he said.

          Risk Warnings and Disclaimers
          You understand and acknowledge that there is a high degree of risk involved in trading. Following any strategies or investment methods may lead to potential losses. The content on the site is provided by our contributors and analysts for information purposes only. You are solely responsible for determining whether any trading assets, securities, strategy, or any other product is suitable for investing based on your own investment objectives and financial situation.
          Add to Favorites
          Share
          FastBull
          Copyright © 2025 FastBull Ltd

          728 RM B 7/F GEE LOK IND BLDG NO 34 HUNG TO RD KWUN TONG KLN HONG KONG

          TelegramInstagramTwitterfacebooklinkedin
          App Store Google Play Google Play
          Products
          Charts

          Chats

          Q&A with Experts
          Screeners
          Economic Calendar
          Data
          Tools
          Membership
          Features
          Function
          Markets
          Copy Trading
          Latest Signals
          Contests
          News
          Analysis
          24/7
          Columns
          Education
          Company
          Careers
          About Us
          Contact Us
          Advertising
          Help Center
          Feedback
          User Agreement
          Privacy Policy
          Business

          White Label

          Data API

          Web Plug-ins

          Poster Maker

          Affiliate Program

          Risk Disclosure

          The risk of loss in trading financial instruments such as stocks, FX, commodities, futures, bonds, ETFs and crypto can be substantial. You may sustain a total loss of the funds that you deposit with your broker. Therefore, you should carefully consider whether such trading is suitable for you in light of your circumstances and financial resources.

          No decision to invest should be made without thoroughly conducting due diligence by yourself or consulting with your financial advisors. Our web content might not suit you since we don't know your financial conditions and investment needs. Our financial information might have latency or contain inaccuracy, so you should be fully responsible for any of your trading and investment decisions. The company will not be responsible for your capital loss.

          Without getting permission from the website, you are not allowed to copy the website's graphics, texts, or trademarks. Intellectual property rights in the content or data incorporated into this website belong to its providers and exchange merchants.

          Not Logged In

          Log in to access more features

          FastBull Membership

          Not yet

          Purchase

          Become a signal provider
          Help Center
          Customer Service
          Dark Mode
          Price Up/Down Colors

          Log In

          Sign Up

          Position
          Layout
          Fullscreen
          Default to Chart
          The chart page opens by default when you visit fastbull.com