• Trade
  • Markets
  • Copy
  • Contests
  • News
  • 24/7
  • Calendar
  • Q&A
  • Chats
Trending
Screeners
SYMBOL
LAST
BID
ASK
HIGH
LOW
NET CHG.
%CHG.
SPREAD
SPX
S&P 500 Index
6827.42
6827.42
6827.42
6899.86
6801.80
-73.58
-1.07%
--
DJI
Dow Jones Industrial Average
48458.04
48458.04
48458.04
48886.86
48334.10
-245.98
-0.51%
--
IXIC
NASDAQ Composite Index
23195.16
23195.16
23195.16
23554.89
23094.51
-398.69
-1.69%
--
USDX
US Dollar Index
97.950
98.030
97.950
98.500
97.950
-0.370
-0.38%
--
EURUSD
Euro / US Dollar
1.17394
1.17409
1.17394
1.17496
1.17192
+0.00011
+ 0.01%
--
GBPUSD
Pound Sterling / US Dollar
1.33707
1.33732
1.33707
1.33997
1.33419
-0.00148
-0.11%
--
XAUUSD
Gold / US Dollar
4299.39
4299.39
4299.39
4353.41
4257.10
+20.10
+ 0.47%
--
WTI
Light Sweet Crude Oil
57.233
57.485
57.233
58.011
56.969
-0.408
-0.71%
--

Community Accounts

Signal Accounts
--
Profit Accounts
--
Loss Accounts
--
View More

Become a signal provider

Sell trading signals to earn additional income

View More

Guide to Copy Trading

Get started with ease and confidence

View More

Signal Accounts for Members

All Signal Accounts

Best Return
  • Best Return
  • Best P/L
  • Best MDD
Past 1W
  • Past 1W
  • Past 1M
  • Past 1Y

All Contests

  • All
  • Trump Updates
  • Recommend
  • Stocks
  • Cryptocurrencies
  • Central Banks
  • Featured News
Top News Only
Share

Thai Leader Anutin: Landmine Blast That Killed Thai Soldiers 'Not A Roadside Accident'

Share

Thai Leader Anutin: Thailand To Continue Military Action Until 'We Feel No More Harm'

Share

Cambodian Prime Minister Hun Manet Says He Had Phone Calls With Trump And Malaysian Leader Anwar About Ceasefire

Share

Cambodia's Hun Manet Says USA, Malaysia Should Verify 'Which Side Fired First' In Latest Conflict

Share

Cambodia's Hun Manet: Cambodia Maintains Its Stance In Seeking Peaceful Resolution Of Disputes

Share

Nasdaq Companies: Allergan, Ferrovia, Insmed, Monolithic Power Systems, Seagate Technology, And Western Digital Will Be Added To The NASDAQ 100 Index. Biogen, CdW, GlobalFoundries, Lululemon, ON Semiconductor, And Tradedesk Will Be Removed From The NASDAQ 100 Index

Share

Witkoff Headed To Berlin This Weekend To Meet With Zelenskiy, European Leaders -Wsj Reporter On X

Share

Russia Attacks Two Ukrainian Ports, Damaging Three Turkish-Owned Vessels

Share

[Historic Flooding Occurs In At Least Four Rivers In Washington State Due To Days Of Torrential Rains] Multiple Areas In Washington State Have Been Hit By Severe Flooding Due To Days Of Torrential Rains, With At Least Four Rivers Experiencing Historic Flooding. Reporters Learned On The 12th That The Floods Caused By The Torrential Rains In Washington State Have Destroyed Homes And Closed Several Highways. Experts Warn That Even More Severe Flooding May Occur In The Future. A State Of Emergency Has Been Declared In Washington State

Share

Trump Says Proposed Free Economic Zone In Donbas Would Work

Share

Trump: I Think My Voice Should Be Heard

Share

Trump Says Will Be Choosing New Fed Chair In Near Future

Share

Trump Says Proposed Free Economic Zone In Donbas Complex But Would Work

Share

Trump Says Land Strikes In Venezuela Will Start Happening

Share

US President Trump: Thailand And Cambodia Are In A Good Situation

Share

State Media: North Korean Leader Kim Hails Troops Returning From Russia Mission

Share

The 10-year Treasury Yield Rose About 5 Basis Points During The "Fed Rate Cut Week," And The 2/10-year Yield Spread Widened By About 9 Basis Points. On Friday (December 12), In Late New York Trading, The Yield On The Benchmark 10-year US Treasury Note Rose 2.75 Basis Points To 4.1841%, A Cumulative Increase Of 4.90 Basis Points For The Week, Trading Within A Range Of 4.1002%-4.2074%. It Rose Steadily From Monday To Wednesday (before The Fed Announced Its Rate Cut And Treasury Bill Purchase Program), Subsequently Exhibiting A V-shaped Recovery. The 2-year Treasury Yield Fell 1.82 Basis Points To 3.5222%, A Cumulative Decrease Of 3.81 Basis Points For The Week, Trading Within A Range Of 3.6253%-3.4989%

Share

Trump: Lots Of Progress Being Made On Russia-Ukraine

Share

NOPA November US Soybean Crush Estimated At 220.285 Million Bushels

Share

SPDR Gold Trust Reports Holdings Up 0.22%, Or 2.28 Tonnes, To 1053.11 Tonnes By Dec 12

TIME
ACT
FCST
PREV
U.K. Trade Balance Non-EU (SA) (Oct)

A:--

F: --

P: --

U.K. Trade Balance (Oct)

A:--

F: --

P: --

U.K. Services Index MoM

A:--

F: --

P: --

U.K. Construction Output MoM (SA) (Oct)

A:--

F: --

P: --

U.K. Industrial Output YoY (Oct)

A:--

F: --

P: --

U.K. Trade Balance (SA) (Oct)

A:--

F: --

P: --

U.K. Trade Balance EU (SA) (Oct)

A:--

F: --

P: --

U.K. Manufacturing Output YoY (Oct)

A:--

F: --

P: --

U.K. GDP MoM (Oct)

A:--

F: --

P: --

U.K. GDP YoY (SA) (Oct)

A:--

F: --

P: --

U.K. Industrial Output MoM (Oct)

A:--

F: --

P: --

U.K. Construction Output YoY (Oct)

A:--

F: --

P: --

France HICP Final MoM (Nov)

A:--

F: --

P: --

China, Mainland Outstanding Loans Growth YoY (Nov)

A:--

F: --

P: --

China, Mainland M2 Money Supply YoY (Nov)

A:--

F: --

P: --

China, Mainland M0 Money Supply YoY (Nov)

A:--

F: --

P: --

China, Mainland M1 Money Supply YoY (Nov)

A:--

F: --

P: --

India CPI YoY (Nov)

A:--

F: --

P: --

India Deposit Gowth YoY

A:--

F: --

P: --

Brazil Services Growth YoY (Oct)

A:--

F: --

P: --

Mexico Industrial Output YoY (Oct)

A:--

F: --

P: --

Russia Trade Balance (Oct)

A:--

F: --

P: --

Philadelphia Fed President Henry Paulson delivers a speech
Canada Building Permits MoM (SA) (Oct)

A:--

F: --

P: --

Canada Wholesale Sales YoY (Oct)

A:--

F: --

P: --

Canada Wholesale Inventory MoM (Oct)

A:--

F: --

P: --

Canada Wholesale Inventory YoY (Oct)

A:--

F: --

P: --

Canada Wholesale Sales MoM (SA) (Oct)

A:--

F: --

P: --

Germany Current Account (Not SA) (Oct)

A:--

F: --

P: --

U.S. Weekly Total Rig Count

A:--

F: --

P: --

U.S. Weekly Total Oil Rig Count

A:--

F: --

P: --

Japan Tankan Large Non-Manufacturing Diffusion Index (Q4)

--

F: --

P: --

Japan Tankan Small Manufacturing Outlook Index (Q4)

--

F: --

P: --

Japan Tankan Large Non-Manufacturing Outlook Index (Q4)

--

F: --

P: --

Japan Tankan Large Manufacturing Outlook Index (Q4)

--

F: --

P: --

Japan Tankan Small Manufacturing Diffusion Index (Q4)

--

F: --

P: --

Japan Tankan Large Manufacturing Diffusion Index (Q4)

--

F: --

P: --

Japan Tankan Large-Enterprise Capital Expenditure YoY (Q4)

--

F: --

P: --

U.K. Rightmove House Price Index YoY (Dec)

--

F: --

P: --

China, Mainland Industrial Output YoY (YTD) (Nov)

--

F: --

P: --

China, Mainland Urban Area Unemployment Rate (Nov)

--

F: --

P: --

Saudi Arabia CPI YoY (Nov)

--

F: --

P: --

Euro Zone Industrial Output YoY (Oct)

--

F: --

P: --

Euro Zone Industrial Output MoM (Oct)

--

F: --

P: --

Canada Existing Home Sales MoM (Nov)

--

F: --

P: --

Euro Zone Total Reserve Assets (Nov)

--

F: --

P: --

U.K. Inflation Rate Expectations

--

F: --

P: --

Canada National Economic Confidence Index

--

F: --

P: --

Canada New Housing Starts (Nov)

--

F: --

P: --

U.S. NY Fed Manufacturing Employment Index (Dec)

--

F: --

P: --

U.S. NY Fed Manufacturing Index (Dec)

--

F: --

P: --

Canada Core CPI YoY (Nov)

--

F: --

P: --

Canada Manufacturing Unfilled Orders MoM (Oct)

--

F: --

P: --

Canada Manufacturing New Orders MoM (Oct)

--

F: --

P: --

Canada Core CPI MoM (Nov)

--

F: --

P: --

Canada Manufacturing Inventory MoM (Oct)

--

F: --

P: --

Canada CPI YoY (Nov)

--

F: --

P: --

Canada CPI MoM (Nov)

--

F: --

P: --

Canada CPI YoY (SA) (Nov)

--

F: --

P: --

Canada Core CPI MoM (SA) (Nov)

--

F: --

P: --

Q&A with Experts
    • All
    • Chatrooms
    • Groups
    • Friends
    Connecting
    .
    .
    .
    Type here...
    Add Symbol or Code

      No matching data

      All
      Trump Updates
      Recommend
      Stocks
      Cryptocurrencies
      Central Banks
      Featured News
      • All
      • Russia-Ukraine Conflict
      • Middle East Flashpoint
      • All
      • Russia-Ukraine Conflict
      • Middle East Flashpoint
      Search
      Products

      Charts Free Forever

      Chats Q&A with Experts
      Screeners Economic Calendar Data Tools
      Membership Features
      Data Warehouse Market Trends Institutional Data Policy Rates Macro

      Market Trends

      Market Sentiment Order Book Forex Correlations

      Top Indicators

      Charts Free Forever
      Markets

      News

      News Analysis 24/7 Columns Education
      From Institutions From Analysts
      Topics Columnists

      Latest Views

      Latest Views

      Trending Topics

      Top Columnists

      Latest Update

      Signals

      Copy Rankings Latest Signals Become a signal provider AI Rating
      Contests
      Brokers

      Overview Brokers Assessment Rankings Regulators News Claims
      Broker listing Forex Brokers Comparison Tool Live Spread Comparison Scam
      Q&A Complaint Scam Alert Videos Tips to Detect Scam
      More

      Business
      Events
      Careers About Us Advertising Help Center

      White Label

      Data API

      Web Plug-ins

      Affiliate Program

      Awards Institution Evaluation IB Seminar Salon Event Exhibition
      Vietnam Thailand Singapore Dubai
      Fans Party Investment Sharing Session
      FastBull Summit BrokersView Expo
      Recent Searches
        Top Searches
          Markets
          News
          Analysis
          User
          24/7
          Economic Calendar
          Education
          Data
          • Names
          • Latest
          • Prev

          View All

          No data

          Scan to Download

          Faster Charts, Chat Faster!

          Download App
          English
          • English
          • Español
          • العربية
          • Bahasa Indonesia
          • Bahasa Melayu
          • Tiếng Việt
          • ภาษาไทย
          • Français
          • Italiano
          • Türkçe
          • Русский язык
          • 简中
          • 繁中
          Open Account
          Search
          Products
          Charts Free Forever
          Markets
          News
          Signals

          Copy Rankings Latest Signals Become a signal provider AI Rating
          Contests
          Brokers

          Overview Brokers Assessment Rankings Regulators News Claims
          Broker listing Forex Brokers Comparison Tool Live Spread Comparison Scam
          Q&A Complaint Scam Alert Videos Tips to Detect Scam
          More

          Business
          Events
          Careers About Us Advertising Help Center

          White Label

          Data API

          Web Plug-ins

          Affiliate Program

          Awards Institution Evaluation IB Seminar Salon Event Exhibition
          Vietnam Thailand Singapore Dubai
          Fans Party Investment Sharing Session
          FastBull Summit BrokersView Expo

          Crypto Market Cap On Track To $4.5 Trillion As Q3 Unfolds – Details

          NewsBTC
          1inch / Tether
          +3.83%
          Vaulta / Tether
          +1.09%
          AAVE / Tether
          +0.73%
          Fusionist / Tether
          +2.69%

          Popular market analyst and key opinion leader (KOL) Ted Pillows is projecting the crypto market to hit a $4.5 trillion valuation before Q3 2025 ends. This interestingly bullish forecast comes off the back of another Bitcoin price rejection allowing the total crypto market cap to maintain the choppy price movement seen in the last month.

          Rally Ahead? Crypto Market Tests $3.5T Barrier

          In an X post on July 4, Pillows shares an insightful technical analysis on the total crypto market cap. Using the daily CryptoCap chart from Tradingview, the renowned analyst highlights the recent formation of a bull flag hinting at an impending price breakout.

          For context, the bull flag is a classic bullish continuation pattern. It starts with the formation of a flagpole i.e. a strong upward price movement, as seen between early April to late May when Bitcoin reached a new all-time high. This structure is followed by the “flag,” i.e., a descending price channel that reflects a period of consolidation. This market action is seen from late May to the present, as the crypto market cap entered a temporary pullback phase.

          Crypto

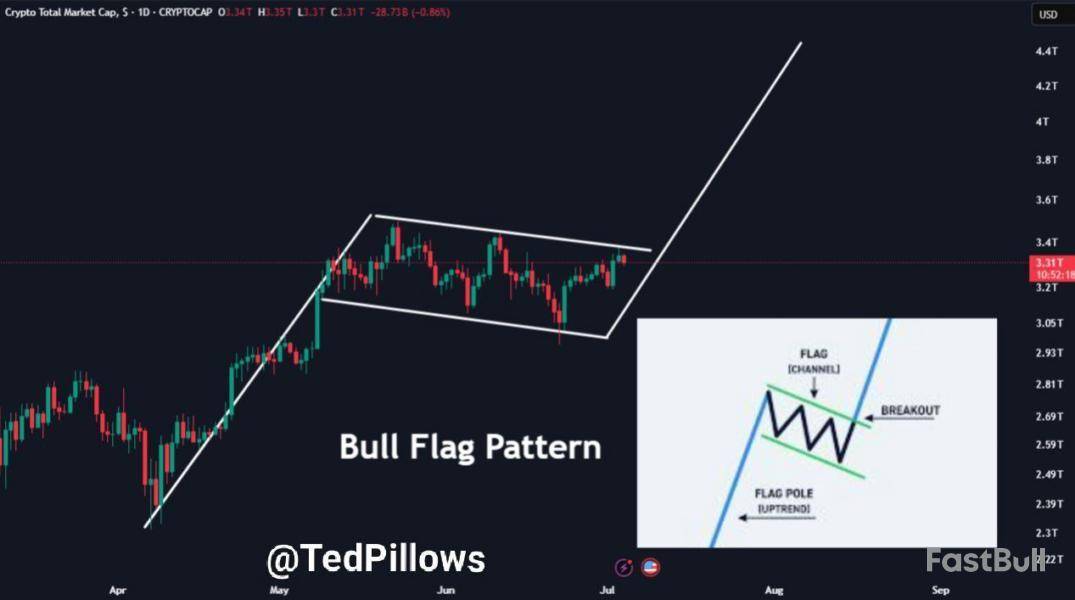
          Pillows’ analysis shows a complete bull flag formation. However, the crypto market cap must achieve a decisive price close above the $3.5 trillion mark which represents the upper boundary of the flag to confirm a price breakout. If this bullish scenario occurs, Ted Pillows predicts the crypto total market cap to surge to around $4.3 trillion – $4.5 trillion in Q3 2025.

          Considering its market dominance levels of 62.77%, Bitcoin’s market cap could also rise to around $2.82 trillion in such bullish conditions providing a market price of $141,800 per unit. However, it’s worth noting that the occurrence of an altseason amidst this crypto price surge could alter the projected market status for the premier cryptocurrency.

          Crypto Market Overview

          According to data from Coingecko, the total cryptocurrency cap is presently valued at $3.39 trillion following a 5.21% decline in the past day in line with the negative price changes with the Bitcoin market. However, the ongoing crypto bull run has delivered an impressive 51.24% gain over the past year.The market leader, Bitcoin, is presently valued at $108,118 reflecting a 1.46% loss in the last 24 hours as previously stated. The maiden cryptocurrency is also witnessing a 14.40% fall in daily trading volume indicating crash in transactions and market activity.

          Risk Warnings and Disclaimers
          You understand and acknowledge that there is a high degree of risk involved in trading. Following any strategies or investment methods may lead to potential losses. The content on the site is provided by our contributors and analysts for information purposes only. You are solely responsible for determining whether any trading assets, securities, strategy, or any other product is suitable for investing based on your own investment objectives and financial situation.
          Add to Favorites
          Share

          XRP’s Tight Range Signals Imminent Move–Experts Predict Major Breakout

          Coinpedia
          1inch / Tether
          +3.83%
          Vaulta / Tether
          +1.09%
          AAVE / Tether
          +0.73%
          Fusionist / Tether
          +2.69%
          Risk Warnings and Disclaimers
          You understand and acknowledge that there is a high degree of risk involved in trading. Following any strategies or investment methods may lead to potential losses. The content on the site is provided by our contributors and analysts for information purposes only. You are solely responsible for determining whether any trading assets, securities, strategy, or any other product is suitable for investing based on your own investment objectives and financial situation.
          Add to Favorites
          Share

          Ethereum Gains 4% This Week, What are the Next Targets? ETH Price Analysis

          CryptoPotato
          1inch / Tether
          +3.83%
          Vaulta / Tether
          +1.09%
          AAVE / Tether
          +0.73%
          Fusionist / Tether
          +2.69%

          Ethereum remains range-bound between the 100-day and 200-day moving averages, signalling a consolidation phase.

          However, a decisive breakout in either direction will likely define the next major trend, with market sentiment leaning toward a potential bullish breakout in the coming days.ETH Price Analysis: Technicals

          By ShayanThe Daily Chart

          ETH is currently consolidating between the 100-day and 200-day moving averages, entering a decisive phase in its price action.

          After breaking above the pivotal 200-day MA around $2.5K, an area that has acted as strong resistance in recent weeks, the price has pulled back to retest this level. This pullback is crucial: if bullish demand resurfaces and holds ETH above this moving average, it would likely ignite another leg upward, targeting the $2.8K resistance zone.

          For now, the cryptocurrency appears to be range-bound between $2.5K and $2.8K, and a clear breakout from this zone will likely set the stage for the next significant trend direction. Market participants are closely watching for a bullish continuation, which could solidify ETH’s reversal structure.The 4-Hour Chart

          On the lower timeframe, ETH’s recent rally encountered resistance at a key bearish order block between $2625 and $2670, where sellers re-entered the market. This rejection has pushed the price back toward the $2.5K support level, a historically significant zone for ETH.

          This area now serves as a crucial battleground. If buyers manage to defend it, Ethereum could regain momentum and reattempt a breakout above the overhead supply.

          However, failure to hold $2.5K could trigger extended consolidation or even a retracement toward lower supports.Onchain Analysis

          By Shayan

          The funding rate remains a key indicator of market sentiment in Ethereum’s futures market. In a healthy uptrend, this metric typically trends upward, reflecting increasing confidence and positioning from long-biased traders in both spot and perpetual markets.

          Currently, however, ETH’s funding rates have been declining amid price consolidation between the 100-day and 200-day moving averages. This suggests reduced bullish conviction and signs of buyer exhaustion, raising the likelihood of continued short-term sideways movement.

          For Ethereum to break above the critical $2.6K and $2.8K resistance zones, stronger demand must flow into the derivatives market, lifting the funding rate to more positive levels. Until that shift materializes, the consolidation phase is likely to persist.

          Risk Warnings and Disclaimers
          You understand and acknowledge that there is a high degree of risk involved in trading. Following any strategies or investment methods may lead to potential losses. The content on the site is provided by our contributors and analysts for information purposes only. You are solely responsible for determining whether any trading assets, securities, strategy, or any other product is suitable for investing based on your own investment objectives and financial situation.
          Add to Favorites
          Share

          SHIB Price Prediction for July 5

          U.Today
          1inch / Tether
          +3.83%
          Vaulta / Tether
          +1.09%
          AAVE / Tether
          +0.73%
          Fusionist / Tether
          +2.69%

          Bulls are weaker than bears at the beginning of the weekend, according to CoinMarketCap.CoinStats">

          The price of SHIB has declined by 0.8% since yesterday.TradingView">

          On the hourly chart, the rate of SHIB is looking bearish as it is near the local support of $0.00001140. If a breakout happens, the fall may continue to the $0.00001130 range shortly.TradingView">

          On the bigger time frame, the price of the meme coin is on the way to the support of $0.00001116.

          If the rate fixes below that mark, the accumulated energy might be enough for a move to the $0.000011 area.TradingView">

          From the midterm point of view, bulls have failed to maintain the rise after the previous bullish closure. If buyers want to continue the upward move, traders should restore the rate of SHIB above the $0.000012 zone.

          SHIB is trading at $0.00001141 at press time.

          Risk Warnings and Disclaimers
          You understand and acknowledge that there is a high degree of risk involved in trading. Following any strategies or investment methods may lead to potential losses. The content on the site is provided by our contributors and analysts for information purposes only. You are solely responsible for determining whether any trading assets, securities, strategy, or any other product is suitable for investing based on your own investment objectives and financial situation.
          Add to Favorites
          Share

          Tokenized equity still in regulatory grey zone — Attorneys

          Cointelegraph
          1inch / Tether
          +3.83%
          Vaulta / Tether
          +1.09%
          AAVE / Tether
          +0.73%
          Fusionist / Tether
          +2.69%
          Risk Warnings and Disclaimers
          You understand and acknowledge that there is a high degree of risk involved in trading. Following any strategies or investment methods may lead to potential losses. The content on the site is provided by our contributors and analysts for information purposes only. You are solely responsible for determining whether any trading assets, securities, strategy, or any other product is suitable for investing based on your own investment objectives and financial situation.
          Add to Favorites
          Share

          Crypto’s path to legitimacy runs through the CARF regulation

          Cointelegraph
          1inch / Tether
          +3.83%
          Vaulta / Tether
          +1.09%
          AAVE / Tether
          +0.73%
          Fusionist / Tether
          +2.69%
          Risk Warnings and Disclaimers
          You understand and acknowledge that there is a high degree of risk involved in trading. Following any strategies or investment methods may lead to potential losses. The content on the site is provided by our contributors and analysts for information purposes only. You are solely responsible for determining whether any trading assets, securities, strategy, or any other product is suitable for investing based on your own investment objectives and financial situation.
          Add to Favorites
          Share

          The XRP signal that preceded 25% average drops in 2025 flashes again

          Cointelegraph
          1inch / Tether
          +3.83%
          Vaulta / Tether
          +1.09%
          AAVE / Tether
          +0.73%
          Fusionist / Tether
          +2.69%

          Key takeaways:

          • XRP has averaged 25% declines in 2025 following overbought Stochastic RSI signals.

          • A descending triangle breakdown could push XRP price toward $1.14, while an analyst sees a deeper drop to $0.60.

          • Bullish analysts expect breakouts toward $3.20–$27.

          XRP has averaged 25% price declines in 2025 during its daily Stochastic RSI unwinding from the overbought levels. A similar fractal is now playing out in July, raising the probability of correcting in the coming days or weeks.

          Previous XRP drops were between 12% and 45%

          Stochastic RSI measures momentum by comparing an asset’s RSI to its recent range. Its reading crossed into the overbought zone above 80 on XRP’s daily chart on June 28 and has been there since then.

          Previous instances show that XRP tends to reverse sharply when these levels begin to neutralize. The cryptocurrency’s declines have come to be approximately 12-45% in 2025, averaging over 25%.

          XRP’s chart structure implies a higher probability of downside unless a decisive breakout invalidates this chart signal.

          XRP 50-70% drawdown risks remain

          A descending triangle formation after XRP’s strong upside run risks strengthening the bearish outlook, with downside projections sitting at around $1.14, or a 50% from the current price levels.

          Analyst Xanrox warns of a much deeper correction ahead, citing a multi-year ascending triangle that has defined XRP’s price action since 2017.

          A key part of his thesis is the formation of a large Fair Value Gap, or FVG, during XRP’s vertical move earlier this year. Historically, such imbalances have been filled aggressively after steep drawdowns.

          He projects a similar outcome following XRP’s recent rally to $3.40 in 2025, targeting a decline toward the triangle’s lower trendline at around $0.60, a ~70% drawdown from current prices.

          Not all analysts are bearish, however. Mikybull Crypto sees a symmetrical triangle setup targeting $3.70 by September, while XForceGlobal projects $8–27 based on Fibonacci levels.

          Others cite a falling wedge breakout and whale accumulation, with targets near $3.20.

          This article does not contain investment advice or recommendations. Every investment and trading move involves risk, and readers should conduct their own research when making a decision.

          Risk Warnings and Disclaimers
          You understand and acknowledge that there is a high degree of risk involved in trading. Following any strategies or investment methods may lead to potential losses. The content on the site is provided by our contributors and analysts for information purposes only. You are solely responsible for determining whether any trading assets, securities, strategy, or any other product is suitable for investing based on your own investment objectives and financial situation.
          Add to Favorites
          Share
          FastBull
          Copyright © 2025 FastBull Ltd

          728 RM B 7/F GEE LOK IND BLDG NO 34 HUNG TO RD KWUN TONG KLN HONG KONG

          TelegramInstagramTwitterfacebooklinkedin
          App Store Google Play Google Play
          Products
          Charts

          Chats

          Q&A with Experts
          Screeners
          Economic Calendar
          Data
          Tools
          Membership
          Features
          Function
          Markets
          Copy Trading
          Latest Signals
          Contests
          News
          Analysis
          24/7
          Columns
          Education
          Company
          Careers
          About Us
          Contact Us
          Advertising
          Help Center
          Feedback
          User Agreement
          Privacy Policy
          Business

          White Label

          Data API

          Web Plug-ins

          Poster Maker

          Affiliate Program

          Risk Disclosure

          The risk of loss in trading financial instruments such as stocks, FX, commodities, futures, bonds, ETFs and crypto can be substantial. You may sustain a total loss of the funds that you deposit with your broker. Therefore, you should carefully consider whether such trading is suitable for you in light of your circumstances and financial resources.

          No decision to invest should be made without thoroughly conducting due diligence by yourself or consulting with your financial advisors. Our web content might not suit you since we don't know your financial conditions and investment needs. Our financial information might have latency or contain inaccuracy, so you should be fully responsible for any of your trading and investment decisions. The company will not be responsible for your capital loss.

          Without getting permission from the website, you are not allowed to copy the website's graphics, texts, or trademarks. Intellectual property rights in the content or data incorporated into this website belong to its providers and exchange merchants.

          Not Logged In

          Log in to access more features

          FastBull Membership

          Not yet

          Purchase

          Become a signal provider
          Help Center
          Customer Service
          Dark Mode
          Price Up/Down Colors

          Log In

          Sign Up

          Position
          Layout
          Fullscreen
          Default to Chart
          The chart page opens by default when you visit fastbull.com