Markets
News
Analysis
User
24/7
Economic Calendar
Education
Data
- Names
- Latest
- Prev


Signal Accounts for Members
All Signal Accounts
All Contests


U.K. Trade Balance (Oct)A:--
F: --
P: --
U.K. Services Index MoMA:--
F: --
P: --
U.K. Construction Output MoM (SA) (Oct)A:--
F: --
P: --
U.K. Industrial Output YoY (Oct)A:--
F: --
P: --
U.K. Trade Balance (SA) (Oct)A:--
F: --
P: --
U.K. Trade Balance EU (SA) (Oct)A:--
F: --
P: --
U.K. Manufacturing Output YoY (Oct)A:--
F: --
P: --
U.K. GDP MoM (Oct)A:--
F: --
P: --
U.K. GDP YoY (SA) (Oct)A:--
F: --
P: --
U.K. Industrial Output MoM (Oct)A:--
F: --
P: --
U.K. Construction Output YoY (Oct)A:--
F: --
P: --
France HICP Final MoM (Nov)A:--
F: --
P: --
China, Mainland Outstanding Loans Growth YoY (Nov)A:--
F: --
P: --
China, Mainland M2 Money Supply YoY (Nov)A:--
F: --
P: --
China, Mainland M0 Money Supply YoY (Nov)A:--
F: --
P: --
China, Mainland M1 Money Supply YoY (Nov)A:--
F: --
P: --
India CPI YoY (Nov)A:--
F: --
P: --
India Deposit Gowth YoYA:--
F: --
P: --
Brazil Services Growth YoY (Oct)A:--
F: --
P: --
Mexico Industrial Output YoY (Oct)A:--
F: --
P: --
Russia Trade Balance (Oct)A:--
F: --
P: --
Philadelphia Fed President Henry Paulson delivers a speech
Canada Building Permits MoM (SA) (Oct)A:--
F: --
P: --
Canada Wholesale Sales YoY (Oct)A:--
F: --
P: --
Canada Wholesale Inventory MoM (Oct)A:--
F: --
P: --
Canada Wholesale Inventory YoY (Oct)A:--
F: --
P: --
Canada Wholesale Sales MoM (SA) (Oct)A:--
F: --
P: --
Germany Current Account (Not SA) (Oct)A:--
F: --
P: --
U.S. Weekly Total Rig CountA:--
F: --
P: --
U.S. Weekly Total Oil Rig CountA:--
F: --
P: --
Japan Tankan Large Non-Manufacturing Diffusion Index (Q4)--
F: --
P: --
Japan Tankan Small Manufacturing Outlook Index (Q4)--
F: --
P: --
Japan Tankan Large Non-Manufacturing Outlook Index (Q4)--
F: --
P: --
Japan Tankan Large Manufacturing Outlook Index (Q4)--
F: --
P: --
Japan Tankan Small Manufacturing Diffusion Index (Q4)--
F: --
P: --
Japan Tankan Large Manufacturing Diffusion Index (Q4)--
F: --
P: --
Japan Tankan Large-Enterprise Capital Expenditure YoY (Q4)--
F: --
P: --
U.K. Rightmove House Price Index YoY (Dec)--
F: --
P: --
China, Mainland Industrial Output YoY (YTD) (Nov)--
F: --
P: --
China, Mainland Urban Area Unemployment Rate (Nov)--
F: --
P: --
Saudi Arabia CPI YoY (Nov)--
F: --
P: --
Euro Zone Industrial Output YoY (Oct)--
F: --
P: --
Euro Zone Industrial Output MoM (Oct)--
F: --
P: --
Canada Existing Home Sales MoM (Nov)--
F: --
P: --
Euro Zone Total Reserve Assets (Nov)--
F: --
P: --
U.K. Inflation Rate Expectations--
F: --
P: --
Canada National Economic Confidence Index--
F: --
P: --
Canada New Housing Starts (Nov)--
F: --
P: --
U.S. NY Fed Manufacturing Employment Index (Dec)--
F: --
P: --
U.S. NY Fed Manufacturing Index (Dec)--
F: --
P: --
Canada Core CPI YoY (Nov)--
F: --
P: --
Canada Manufacturing Unfilled Orders MoM (Oct)--
F: --
P: --
Canada Manufacturing New Orders MoM (Oct)--
F: --
P: --
Canada Core CPI MoM (Nov)--
F: --
P: --
Canada Manufacturing Inventory MoM (Oct)--
F: --
P: --
Canada CPI YoY (Nov)--
F: --
P: --
Canada CPI MoM (Nov)--
F: --
P: --
Canada CPI YoY (SA) (Nov)--
F: --
P: --
Canada Core CPI MoM (SA) (Nov)--
F: --
P: --
Canada CPI MoM (SA) (Nov)--
F: --
P: --


No matching data
Latest Views
Latest Views
Trending Topics
Top Columnists
Latest Update
White Label
Data API
Web Plug-ins
Affiliate Program
View All

No data
Earnings results often indicate what direction a company will take in the months ahead. With Q2 behind us, let’s have a look at Primoris and its peers.
Construction and maintenance services companies not only boast technical know-how in specialized areas but also may hold special licenses and permits. Those who work in more regulated areas can enjoy more predictable revenue streams - for example, fire escapes need to be inspected every five years. More recently, services to address energy efficiency and labor availability are also creating incremental demand. But like the broader industrials sector, construction and maintenance services companies are at the whim of economic cycles as external factors like interest rates can greatly impact the new construction that drives incremental demand for these companies’ offerings.
The 12 construction and maintenance services stocks we track reported a very strong Q2. As a group, revenues beat analysts’ consensus estimates by 4.4% while next quarter’s revenue guidance was in line.
Thankfully, share prices of the companies have been resilient as they are up 7.6% on average since the latest earnings results.
Listed on the NASDAQ in 2008, Primoris builds, maintains, and upgrades infrastructure in the utility, energy, and civil construction industries.
Primoris reported revenues of $1.89 billion, up 20.9% year on year. This print exceeded analysts’ expectations by 12.1%. Overall, it was an incredible quarter for the company with a beat of analysts’ EPS andEBITDA estimates.
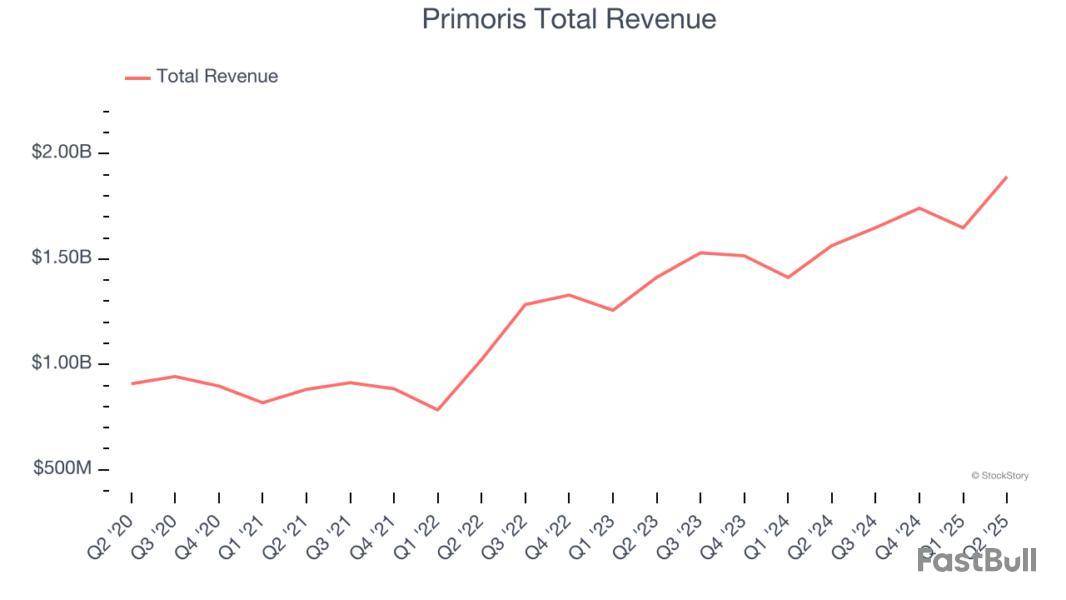
Primoris pulled off the biggest analyst estimates beat of the whole group. Unsurprisingly, the stock is up 24.6% since reporting and currently trades at $116.12.
We think Primoris is a good business, but is it a buy today? Read our full report here, it’s free.
Founded as Lydon & Drews dredging company, Great Lakes Dredge & Dock provides dredging services, land reclamation, and coastal protection projects in the United States and internationally.
Great Lakes Dredge & Dock reported revenues of $193.8 million, up 13.9% year on year, outperforming analysts’ expectations by 9%. The business had an incredible quarter with a beat of analysts’ EPS and EBITDA estimates.
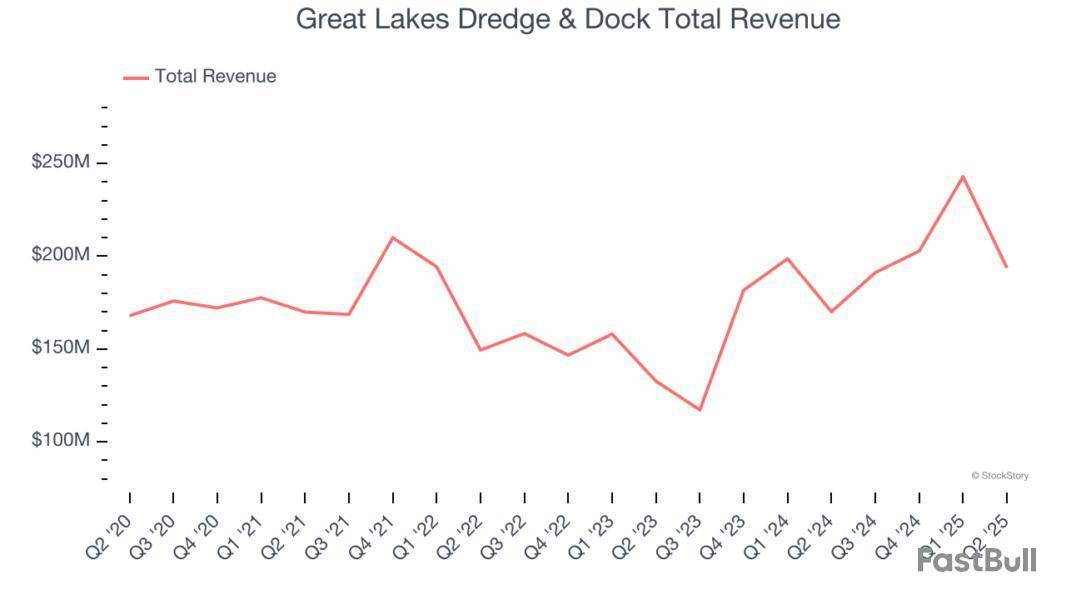
The market seems happy with the results as the stock is up 10.9% since reporting. It currently trades at $11.77.
Is now the time to buy Great Lakes Dredge & Dock? Access our full analysis of the earnings results here, it’s free.
Weakest Q2: WillScot Mobile Mini
Originally focusing on mobile offices for construction sites, WillScot provides ready-to-use temporary spaces, largely for longer-term lease.
WillScot Mobile Mini reported revenues of $589.1 million, down 2.6% year on year, in line with analysts’ expectations. It was a softer quarter as it posted a significant miss of analysts’ adjusted operating income estimates and a significant miss of analysts’ EPS estimates.
WillScot Mobile Mini delivered the weakest full-year guidance update in the group. As expected, the stock is down 19.8% since the results and currently trades at $23.53.
Read our full analysis of WillScot Mobile Mini’s results here.
Founded in 2001, Construction Partners is a civil infrastructure company that builds and maintains roads, highways, and other infrastructure projects.
Construction Partners reported revenues of $779.3 million, up 50.5% year on year. This print lagged analysts' expectations by 1.3%. Aside from that, it was a mixed quarter as it also recorded full-year EBITDA guidance beating analysts’ expectations but a miss of analysts’ EPS estimates.
Construction Partners pulled off the fastest revenue growth among its peers. The stock is up 27.3% since reporting and currently trades at $119.09.
Read our full, actionable report on Construction Partners here, it’s free.
Having played a role in the construction of the Hoover Dam, Granite Construction is a provider of infrastructure solutions for roads, bridges, and other projects.
Granite Construction reported revenues of $1.13 billion, up 4% year on year. This number came in 3% below analysts' expectations. Taking a step back, it was still a strong quarter as it recorded full-year revenue guidance exceeding analysts’ expectations and an impressive beat of analysts’ EBITDA estimates.
Granite Construction had the weakest performance against analyst estimates among its peers. The stock is up 15.7% since reporting and currently trades at $108.10.
Read our full, actionable report on Granite Construction here, it’s free.
Market Update
Thanks to the Fed’s rate hikes in 2022 and 2023, inflation has been on a steady path downward, easing back toward that 2% sweet spot. Fortunately (miraculously to some), all this tightening didn’t send the economy tumbling into a recession, so here we are, cautiously celebrating a soft landing. The cherry on top? Recent rate cuts (half a point in September 2024, a quarter in November) have propped up markets, especially after Trump’s November win lit a fire under major indices and sent them to all-time highs. However, there’s still plenty to ponder — tariffs, corporate tax cuts, and what 2025 might hold for the economy.
Even if a company is profitable, it doesn’t always mean it’s a great investment. Some struggle to maintain growth, face looming threats, or fail to reinvest wisely, limiting their future potential.
A business making money today isn’t necessarily a winner, which is why we analyze companies across multiple dimensions at StockStory. That said, here is one profitable company that balances growth and profitability and two best left off your watchlist.
Two Stocks to Sell:
Carnival (CCL)
Trailing 12-Month GAAP Operating Margin: 16.2%
Boasting outrageous amenities like a planetarium on board its ships, Carnival is one of the world's largest leisure travel companies and a prominent player in the cruise industry.
Why Does CCL Give Us Pause?
Carnival is trading at $31.92 per share, or 16x forward P/E. Dive into our free research report to see why there are better opportunities than CCL.
Great Lakes Dredge & Dock (GLDD)
Trailing 12-Month GAAP Operating Margin: 13.3%
Founded as Lydon & Drews dredging company, Great Lakes Dredge & Dock provides dredging services, land reclamation, and coastal protection projects in the United States and internationally.
Why Does GLDD Fall Short?
At $11.61 per share, Great Lakes Dredge & Dock trades at 14.7x forward P/E. If you’re considering GLDD for your portfolio, see our FREE research report to learn more.
One Stock to Buy:
Lam Research (LRCX)
Trailing 12-Month GAAP Operating Margin: 32%
Founded in 1980 by David Lam, the man who pioneered semiconductor etching technology, Lam Research is one of the leading providers of wafer fabrication equipment used to make semiconductors.
Why Should You Buy LRCX?
Lam Research’s stock price of $100.05 implies a valuation ratio of 24.8x forward P/E. Is now the right time to buy? See for yourself in our in-depth research report, it’s free.
Stocks We Like Even More
When Trump unveiled his aggressive tariff plan in April 2025, markets tanked as investors feared a full-blown trade war. But those who panicked and sold missed the subsequent rebound that’s already erased most losses.
Don’t let fear keep you from great opportunities and take a look at Top 6 Stocks for this week. This is a curated list of our High Quality stocks that have generated a market-beating return of 183% over the last five years (as of March 31st 2025).
Stocks that made our list in 2020 include now familiar names such as Nvidia (+1,545% between March 2020 and March 2025) as well as under-the-radar businesses like the once-small-cap company Exlservice (+354% five-year return).
StockStory is growing and hiring equity analyst and marketing roles. Are you a 0 to 1 builder passionate about the markets and AI? See the open roles here.
Companies that burn cash at a rapid pace can run into serious trouble if they fail to secure funding. Without a clear path to profitability, these businesses risk dilution, mounting debt, or even bankruptcy.
Not all companies are worth the risk, and that’s why we built StockStory - to help you spot the red flags. That said, here are three cash-burning companies that don’t make the cut and some better opportunities instead.
1-800-FLOWERS (FLWS)
Trailing 12-Month Free Cash Flow Margin: -2.9%
Founded in 1976, 1-800-FLOWERS is an online retailer of flowers, gifts, and gourmet foods, serving customers globally.
Why Should You Sell FLWS?
1-800-FLOWERS’s stock price of $5.50 implies a valuation ratio of 18.3x forward P/E. Dive into our free research report to see why there are better opportunities than FLWS.
Great Lakes Dredge & Dock (GLDD)
Trailing 12-Month Free Cash Flow Margin: -1.4%
Founded as Lydon & Drews dredging company, Great Lakes Dredge & Dock provides dredging services, land reclamation, and coastal protection projects in the United States and internationally.
Why Are We Hesitant About GLDD?
Great Lakes Dredge & Dock is trading at $11.88 per share, or 15x forward P/E. Check out our free in-depth research report to learn more about why GLDD doesn’t pass our bar.
EchoStar (SATS)
Trailing 12-Month Free Cash Flow Margin: -4.5%
Following its 2023 acquisition of DISH Network, EchoStar provides satellite communications, pay-TV services, wireless networks, and broadband solutions across consumer and enterprise markets.
Why Is SATS Risky?
At $30 per share, EchoStar trades at 6.2x forward EV-to-EBITDA. If you’re considering SATS for your portfolio, see our FREE research report to learn more.
High-Quality Stocks for All Market Conditions
When Trump unveiled his aggressive tariff plan in April 2025, markets tanked as investors feared a full-blown trade war. But those who panicked and sold missed the subsequent rebound that’s already erased most losses.
Don’t let fear keep you from great opportunities and take a look at Top 5 Strong Momentum Stocks for this week. This is a curated list of our High Quality stocks that have generated a market-beating return of 183% over the last five years (as of March 31st 2025).
Stocks that made our list in 2020 include now familiar names such as Nvidia (+1,545% between March 2020 and March 2025) as well as under-the-radar businesses like the once-micro-cap company Tecnoglass (+1,754% five-year return).
StockStory is growing and hiring equity analyst and marketing roles. Are you a 0 to 1 builder passionate about the markets and AI? See the open roles here.
Dycom Industries Inc. DY reported mixed results in second-quarter fiscal 2026 (ended July 26, 2025) with quarterly earnings surpassing the Zacks Consensus Estimate and also increasing on a year-over-year basis. Meanwhile, contract revenues missed the consensus estimate but increased year over year.
In the fiscal second quarter, the company delivered strong results, supported by record revenues, EBITDA and EPS. Fiber-to-the-home initiatives, wireless activities, maintenance services and early contributions from infrastructure projects tied to hyperscalers were the key drivers of growth. Cash flow improved as DSOs decreased by nine days, and the backlog increased significantly over the next 12 months, increasing by more than 20% year over year.
DY stock tumbled 4.6% during yesterday’s trading session.
Dycom Industries, Inc. Price, Consensus and EPS Surprise
Dycom Industries, Inc. price-consensus-eps-surprise-chart | Dycom Industries, Inc. Quote
DY’s Q2 Earnings & Revenue Discussion
Dycom reported adjusted earnings per share (EPS) of $3.33, beating the Zacks Consensus Estimate of $2.86 by 16.4% and increasing 35.4% from $2.46 year over year. The upside was attributable to improved operating leverage.
Contract revenues of $1.378 billion missed the consensus mark of $1.396 billion by 1.3% but rose 14.5% year over year. Contract revenues increased 3.4% on an organic basis. Acquisitions contributed $139.8 million to contract revenues.
Operations & Backlog Details
Adjusted EBITDA increased 29.8% to $205.5 million from a year ago. Our projection for the metric was $187.2 million for the fiscal second quarter.
Adjusted EBITDA margin of 14.9% expanded 175 basis points from the year-ago level. Our estimate for the metric was 13.4%.
Dycom’s backlog at the end of the fiscal second quarter totaled $7.989 billion (our projection was $8.6 billion), representing a year-over-year increase of 16.9% from a year ago. Of the backlog, $4.604 billion is projected to be completed in the next 12 months.
Financials
As of July 26, 2025, DY had liquidity of $545.9 million, including cash and cash equivalents worth $28.5 million compared with $92.6 million as of Jan. 25, 2025. Long-term debt was $1.01 billion at the fiscal second-quarter end, up from $933.2 million at the fiscal 2025 end.
During the first two quarters of fiscal 2026, DY repurchased 200,000 shares of its common stock for $30.2 million at an average price of $150.93 per share.
Dycom’s Q3 View
For the fiscal third quarter (ending on Oct. 25, 2025), DY expects $1.38 to $1.43 billion of contract revenues for the quarter.
The adjusted EBITDA is expected to be between $198 million and $213 million. For the said period, Dycom expects the effective tax rate to be 26% and diluted shares of 29.3 million. Interest expenses, net, are likely to be $14.7 million and amortization expenses to be $11.8 million.
FY26 Guidance by Dycom
Dycom expects total contract revenues for fiscal 2026 to range from $5.290 billion to $5.425 billion, representing a 12.5% to 15.4% year-over-year increase, driven by robust digital infrastructure growth and long-term demand drivers.
Service and maintenance provide a steady stream of income, and management is certain that margins will continue to grow and operational efficiency will improve.
DY’s Zacks Rank & Key Picks
Dycom currently has a Zacks Rank #3 (Hold).
Some better-ranked stocks from the Construction sector are Everus Construction Group Inc. ECG, Tutor Perini Corporation TPC and Great Lakes Dredge & Dock Corporation GLDD.
Everus Construction Group presently sports a Zacks Rank #1 (Strong Buy). The company delivered a trailing four-quarter earnings surprise of 42.7%. ECG stock has jumped 13.7% year to date. You can see the complete list of today’s Zacks #1 Rank stocks here.
The Zacks Consensus Estimate for ECG’s 2025 sales and EPS indicates growth of 18% and 3.9%, respectively, from the year-ago period’s levels.
Tutor Perini sports a Zacks Rank of 1 at present. The company delivered a trailing four-quarter earnings surprise of 387.2%, on average. Tutor Perini's stock has skyrocketed 131.4% year to date.
The Zacks Consensus Estimate for Tutor Perini’s 2025 sales and EPS indicates growth of 20.6% and 187%, respectively, from the prior-year levels.
Great Lakes Dredge & Dock flaunts a Zacks Rank of 1 at present. The company delivered a trailing four-quarter earnings surprise of 45.3%, on average. Great Lakes Dredge & Dock stock has gained 1.4% year to date.
The Zacks Consensus Estimate for Great Lakes Dredge & Dock’s 2025 sales and EPS indicates growth of 9% and 21.4%, respectively, from the prior-year levels.
This article originally published on Zacks Investment Research (zacks.com).
Zacks Investment Research
Toll Brothers, Inc. (TOL) reported third-quarter fiscal 2025 (ended July 31) results, with adjusted earnings and total revenues topping the Zacks Consensus Estimate. On a year-over-year basis, both the top and bottom lines increased.
Despite ongoing affordability challenges and broader economic uncertainty, the company is benefiting from the strength of its luxury positioning and its higher-income customer base. Toll Brothers remains disciplined in managing both pricing and sales velocity to optimize margins and overall returns. At the same time, it is carefully controlling its speculative home starts, adjusting decisions at the community level to align with localized demand trends.
TOL’s Quarterly Earnings & Revenue Discussion
The company reported adjusted earnings per share (EPS) of $3.73, which surpassed the Zacks Consensus Estimate of $3.59 by 3.9% and grew 3.6% from the year-ago period.
In the fiscal third quarter, total revenues of $2,945.1 million beat the consensus mark of $2,852 million. The top line increased 8% on a year-over-year basis.
Toll Brothers Inc. Price, Consensus and EPS Surprise
Toll Brothers Inc. price-consensus-eps-surprise-chart | Toll Brothers Inc. Quote
Inside Toll Brothers’ Q3 Results
The company’s total home sales revenues were up 6% (above our projection of 5.5% year-over-year growth) from the prior-year quarter to $2.9 billion. Home deliveries were up 5% (same as our expectation of 5% growth year over year) from the year-ago quarter to 2,959 units. The average selling price (ASP) of homes delivered was $973,600 for the quarter, up 0.5% from the year-ago level of $968,200. Our model had expected ASP to be up 0.5% year over year to $972,700.
Net-signed contracts during the quarter were 2,388 units, down year over year from 2,490 units. The value of net signed contracts was $2.4 billion, which remained constant from last year. We had projected net-signed contracts to be up 12.1% in units and 13.4% in value for the quarter.
At the fiscal third-quarter end, Toll Brothers had a backlog of 5,492 homes, representing a year-over-year decrease of 19%. Potential revenues from backlog declined 10% year over year to $6.38 billion. The average price of homes in the backlog was $1,161,000, up from $1,044,000 a year ago.
The cancellation rate (as a percentage of signed contracts) for the reported quarter was 7.5%, up from 6.4% in the prior-year period.
TOL’s adjusted home sales gross margin was 27.5%, which contracted 130 basis points (bps) for the quarter. Selling, general and administrative (SG&A) expenses, as a percentage of home sales revenues, were 8.8%, down 20 bps from the year-ago quarter.
TOL’s Balance Sheet & Cash Flow
The company had cash and cash equivalents of $852.3 million at the fiscal third-quarter end compared with $1.3 billion at the fiscal 2024-end. The debt-to-capital ratio improved to 26.7% from 27% at the end of fiscal 2024. The net debt-to-capital ratio was 19.3% compared with 15.2% at the fiscal 2024-end. At the end of the fiscal third quarter, the company had $2.19 billion available under its $2.35 billion revolving credit facility, set to mature in February 2030.
During the first six months of fiscal 2025, TOL bought back approximately 1.8 million shares for a total of $201.4 million.
At the end of the fiscal third quarter, the company controlled about 76,800 lots, 57% of which were under control rather than owned outright, ensuring sufficient land for future expansion.
TOL Unveils Q4 Guidance
Toll Brothers expects home deliveries of 3,350 units (compared with 3,431 units delivered in the prior-year quarter) at an average price of $970,000-$980,000 (compared with $950,200 in the year-ago quarter).
Adjusted home sales gross margin is expected to be 27%, implying a decline from 27.9% in the year-ago period. SG&A expenses are estimated to be 8.3% of home sales revenues, indicating a rise from 8.3% in the year-ago period. The company expects the effective tax rate to be 25.5%.
Toll Brothers Retains FY25 Guidance
For fiscal 2025, home deliveries are anticipated to be in the range of 11,200 units. The estimated range reflects growth from the fiscal 2024 level of 10,813. It expects the period-end community count to be 440-450.
The average price of delivered homes is expected to be $950,000-$960,000, indicating a decline from $976,900 in fiscal 2024.
Toll Brothers expects an adjusted home sales gross margin of 27.25%. This reflects a decline from the 28.4% reported in fiscal 2024.
SG&A expenses, as a percentage of home sales revenues, are now projected to be 9.4-9.5%, still an increase from the 9.3% reported in fiscal 2024. The company expects the effective tax rate to be 25.1%.
TOL’s Zacks Rank & Key Picks
Toll Brothers currently has a Zacks Rank #3 (Hold).
Some better-ranked stocks from the Construction sector are Everus Construction Group Inc. (ECG), Tutor Perini (TPC) and Great Lakes Dredge & Dock (GLDD).
Everus Construction Group presently sports a Zacks Rank #1 (Strong Buy). The company delivered a trailing four-quarter earnings surprise of 42.7%. ECG stock has jumped 14.6% year to date. You can see the complete list of today’s Zacks #1 Rank stocks here.
The Zacks Consensus Estimate for ECG’s 2025 sales and EPS indicates growth of 18% and 3.9%, respectively, from the year-ago period’s levels.
Tutor Perini sports a Zacks Rank of 1 at present. The company delivered a trailing four-quarter earnings surprise of 387.2%, on average. Tutor Perini stock has skyrocketed 131.5% year to date.
The Zacks Consensus Estimate for Tutor Perini’s 2025 sales and EPS indicates growth of 20.6% and 187%, respectively, from the prior-year levels.
Great Lakes Dredge & Dock flaunts a Zacks Rank of 1 at present. The company delivered a trailing four-quarter earnings surprise of 45.3%, on average. Great Lakes Dredge & Dock stock has gained 0.7% year to date.
The Zacks Consensus Estimate for Great Lakes Dredge & Dock’s 2025 sales and EPS indicates growth of 9% and 21.4%, respectively, from the prior-year levels.
This article originally published on Zacks Investment Research (zacks.com).
Zacks Investment Research
White Label
Data API
Web Plug-ins
Poster Maker
Affiliate Program
The risk of loss in trading financial instruments such as stocks, FX, commodities, futures, bonds, ETFs and crypto can be substantial. You may sustain a total loss of the funds that you deposit with your broker. Therefore, you should carefully consider whether such trading is suitable for you in light of your circumstances and financial resources.
No decision to invest should be made without thoroughly conducting due diligence by yourself or consulting with your financial advisors. Our web content might not suit you since we don't know your financial conditions and investment needs. Our financial information might have latency or contain inaccuracy, so you should be fully responsible for any of your trading and investment decisions. The company will not be responsible for your capital loss.
Without getting permission from the website, you are not allowed to copy the website's graphics, texts, or trademarks. Intellectual property rights in the content or data incorporated into this website belong to its providers and exchange merchants.
Not Logged In
Log in to access more features

FastBull Membership
Not yet
Purchase
Log In
Sign Up