• Trade
  • Markets
  • Copy
  • Contests
  • News
  • 24/7
  • Calendar
  • Q&A
  • Chats
Trending
Screeners
SYMBOL
LAST
BID
ASK
HIGH
LOW
NET CHG.
%CHG.
SPREAD
SPX
S&P 500 Index
6827.42
6827.42
6827.42
6899.86
6801.80
-73.58
-1.07%
--
DJI
Dow Jones Industrial Average
48458.04
48458.04
48458.04
48886.86
48334.10
-245.98
-0.51%
--
IXIC
NASDAQ Composite Index
23195.16
23195.16
23195.16
23554.89
23094.51
-398.69
-1.69%
--
USDX
US Dollar Index
97.990
98.070
97.990
98.070
97.920
+0.040
+ 0.04%
--
EURUSD
Euro / US Dollar
1.17300
1.17307
1.17300
1.17447
1.17283
-0.00094
-0.08%
--
GBPUSD
Pound Sterling / US Dollar
1.33610
1.33620
1.33610
1.33740
1.33546
-0.00097
-0.07%
--
XAUUSD
Gold / US Dollar
4339.14
4339.55
4339.14
4347.21
4294.68
+39.75
+ 0.92%
--
WTI
Light Sweet Crude Oil
57.540
57.577
57.540
57.601
57.194
+0.307
+ 0.54%
--

Community Accounts

Signal Accounts
--
Profit Accounts
--
Loss Accounts
--
View More

Become a signal provider

Sell trading signals to earn additional income

View More

Guide to Copy Trading

Get started with ease and confidence

View More

Signal Accounts for Members

All Signal Accounts

Best Return
  • Best Return
  • Best P/L
  • Best MDD
Past 1W
  • Past 1W
  • Past 1M
  • Past 1Y

All Contests

  • All
  • Trump Updates
  • Recommend
  • Stocks
  • Cryptocurrencies
  • Central Banks
  • Featured News
Top News Only
Share

India Trade Secretary: Reduction In Imports In November Due To Fall In Gold, Oil And Coal Shipments

Share

India Trade Secretary: Gold Imports Have Declined In Nov By About 60%

Share

India Trade Secretary: Exports In Sectors Such Engineering, Electronics , Gems And Jewellery Aided November Figures

Share

India's Nov Merchandise Trade Deficit At $24.53 Billion - Reuters Calculation (Poll $32 Billion)

Share

India's Nov Merchandise Imports At $62.66 Billion

Share

India's Nov Merchandise Exports At $38.13 Billion

Share

Stats Office - Swiss November Producer/Import Prices -1.6% Year-On-Year (Versus-1.7% In Prior Month)

Share

Stats Office - Swiss November Producer/Import Prices -0.5% Month-On-Month (Versus-0.3% In Prior Month)

Share

Thailand To Hold Elections On Feb 8 - Multiple Local Media Reports

Share

Taiwan Dollar Falls 0.6% To 31.384 Per USA Dollar, Lowest Since December 3

Share

Stats Office - Botswana November Consumer Inflation At 0.0% Month-On-Month

Share

Stats Office - Botswana November Consumer Inflation At 3.8% Year-On-Year

Share

Statistics Bureau - Kazakhstan's Jan-Nov Industrial Output +7.4% Year-On-Year

Share

Fca: Sets Out Plans To Help Build Mortgage Market Of Future

Share

Eurostoxx 50 Futures Up 0.38%, DAX Futures Up 0.43%, FTSE Futures Up 0.37%

Share

[Delivery Of New US Presidential Aircraft Delayed Again] According To The Latest Timeline Released By The US Air Force, The Delivery Of The First Of The Two Newly Commissioned Air Force One Presidential Aircraft Will Not Be Earlier Than 2028. This Means That The Delivery Of The New Air Force One Has Been Delayed Once Again

Share

German Nov Wholesale Prices +0.3% Month-On-Month

Share

Norway's Nov Trade Balance Nok 41.3 Billion - Statistics Norway

Share

German Nov Wholesale Prices +1.5% Year-On-Year

Share

Romania's Adjusted Industrial Production +0.4% Month-On-Month In October, +0.2% Year-On-Year - Statistics Board

TIME
ACT
FCST
PREV
U.K. Trade Balance Non-EU (SA) (Oct)

A:--

F: --

P: --

France HICP Final MoM (Nov)

A:--

F: --

P: --

China, Mainland Outstanding Loans Growth YoY (Nov)

A:--

F: --

P: --

China, Mainland M2 Money Supply YoY (Nov)

A:--

F: --

P: --

China, Mainland M0 Money Supply YoY (Nov)

A:--

F: --

P: --

China, Mainland M1 Money Supply YoY (Nov)

A:--

F: --

P: --

India CPI YoY (Nov)

A:--

F: --

P: --

India Deposit Gowth YoY

A:--

F: --

P: --

Brazil Services Growth YoY (Oct)

A:--

F: --

P: --

Mexico Industrial Output YoY (Oct)

A:--

F: --

P: --

Russia Trade Balance (Oct)

A:--

F: --

P: --

Philadelphia Fed President Henry Paulson delivers a speech
Canada Building Permits MoM (SA) (Oct)

A:--

F: --

P: --

Canada Wholesale Sales YoY (Oct)

A:--

F: --

P: --

Canada Wholesale Inventory MoM (Oct)

A:--

F: --

P: --

Canada Wholesale Inventory YoY (Oct)

A:--

F: --

P: --

Canada Wholesale Sales MoM (SA) (Oct)

A:--

F: --

P: --

Germany Current Account (Not SA) (Oct)

A:--

F: --

P: --

U.S. Weekly Total Rig Count

A:--

F: --

P: --

U.S. Weekly Total Oil Rig Count

A:--

F: --

P: --

Japan Tankan Small Manufacturing Outlook Index (Q4)

A:--

F: --

P: --

Japan Tankan Large Non-Manufacturing Diffusion Index (Q4)

A:--

F: --

P: --

Japan Tankan Large Non-Manufacturing Outlook Index (Q4)

A:--

F: --

P: --

Japan Tankan Large Manufacturing Outlook Index (Q4)

A:--

F: --

P: --

Japan Tankan Small Manufacturing Diffusion Index (Q4)

A:--

F: --

P: --

Japan Tankan Large Manufacturing Diffusion Index (Q4)

A:--

F: --

P: --

Japan Tankan Large-Enterprise Capital Expenditure YoY (Q4)

A:--

F: --

P: --

U.K. Rightmove House Price Index YoY (Dec)

A:--

F: --

P: --

China, Mainland Industrial Output YoY (YTD) (Nov)

A:--

F: --

P: --

China, Mainland Urban Area Unemployment Rate (Nov)

A:--

F: --

P: --

Saudi Arabia CPI YoY (Nov)

A:--

F: --

P: --

Euro Zone Industrial Output YoY (Oct)

--

F: --

P: --

Euro Zone Industrial Output MoM (Oct)

--

F: --

P: --

Canada Existing Home Sales MoM (Nov)

--

F: --

P: --

Euro Zone Total Reserve Assets (Nov)

--

F: --

P: --

U.K. Inflation Rate Expectations

--

F: --

P: --

Canada National Economic Confidence Index

--

F: --

P: --

Canada New Housing Starts (Nov)

--

F: --

P: --

U.S. NY Fed Manufacturing Employment Index (Dec)

--

F: --

P: --

U.S. NY Fed Manufacturing Index (Dec)

--

F: --

P: --

Canada Core CPI YoY (Nov)

--

F: --

P: --

Canada Manufacturing Unfilled Orders MoM (Oct)

--

F: --

P: --

U.S. NY Fed Manufacturing Prices Received Index (Dec)

--

F: --

P: --

U.S. NY Fed Manufacturing New Orders Index (Dec)

--

F: --

P: --

Canada Manufacturing New Orders MoM (Oct)

--

F: --

P: --

Canada Core CPI MoM (Nov)

--

F: --

P: --

Canada Trimmed CPI YoY (SA) (Nov)

--

F: --

P: --

Canada Manufacturing Inventory MoM (Oct)

--

F: --

P: --

Canada CPI YoY (Nov)

--

F: --

P: --

Canada CPI MoM (Nov)

--

F: --

P: --

Canada CPI YoY (SA) (Nov)

--

F: --

P: --

Canada Core CPI MoM (SA) (Nov)

--

F: --

P: --

Canada CPI MoM (SA) (Nov)

--

F: --

P: --

Federal Reserve Board Governor Milan delivered a speech
U.S. NAHB Housing Market Index (Dec)

--

F: --

P: --

Australia Composite PMI Prelim (Dec)

--

F: --

P: --

Australia Services PMI Prelim (Dec)

--

F: --

P: --

Australia Manufacturing PMI Prelim (Dec)

--

F: --

P: --

Japan Manufacturing PMI Prelim (SA) (Dec)

--

F: --

P: --

U.K. Unemployment Claimant Count (Nov)

--

F: --

P: --

U.K. Unemployment Rate (Nov)

--

F: --

P: --

Q&A with Experts
    • All
    • Chatrooms
    • Groups
    • Friends
    Connecting
    .
    .
    .
    Type here...
    Add Symbol or Code

      No matching data

      All
      Trump Updates
      Recommend
      Stocks
      Cryptocurrencies
      Central Banks
      Featured News
      • All
      • Russia-Ukraine Conflict
      • Middle East Flashpoint
      • All
      • Russia-Ukraine Conflict
      • Middle East Flashpoint
      Search
      Products

      Charts Free Forever

      Chats Q&A with Experts
      Screeners Economic Calendar Data Tools
      Membership Features
      Data Warehouse Market Trends Institutional Data Policy Rates Macro

      Market Trends

      Market Sentiment Order Book Forex Correlations

      Top Indicators

      Charts Free Forever
      Markets

      News

      News Analysis 24/7 Columns Education
      From Institutions From Analysts
      Topics Columnists

      Latest Views

      Latest Views

      Trending Topics

      Top Columnists

      Latest Update

      Signals

      Copy Rankings Latest Signals Become a signal provider AI Rating
      Contests
      Brokers

      Overview Brokers Assessment Rankings Regulators News Claims
      Broker listing Forex Brokers Comparison Tool Live Spread Comparison Scam
      Q&A Complaint Scam Alert Videos Tips to Detect Scam
      More

      Business
      Events
      Careers About Us Advertising Help Center

      White Label

      Data API

      Web Plug-ins

      Affiliate Program

      Awards Institution Evaluation IB Seminar Salon Event Exhibition
      Vietnam Thailand Singapore Dubai
      Fans Party Investment Sharing Session
      FastBull Summit BrokersView Expo
      Recent Searches
        Top Searches
          Markets
          News
          Analysis
          User
          24/7
          Economic Calendar
          Education
          Data
          • Names
          • Latest
          • Prev

          View All

          No data

          Scan to Download

          Faster Charts, Chat Faster!

          Download App
          English
          • English
          • Español
          • العربية
          • Bahasa Indonesia
          • Bahasa Melayu
          • Tiếng Việt
          • ภาษาไทย
          • Français
          • Italiano
          • Türkçe
          • Русский язык
          • 简中
          • 繁中
          Open Account
          Search
          Products
          Charts Free Forever
          Markets
          News
          Signals

          Copy Rankings Latest Signals Become a signal provider AI Rating
          Contests
          Brokers

          Overview Brokers Assessment Rankings Regulators News Claims
          Broker listing Forex Brokers Comparison Tool Live Spread Comparison Scam
          Q&A Complaint Scam Alert Videos Tips to Detect Scam
          More

          Business
          Events
          Careers About Us Advertising Help Center

          White Label

          Data API

          Web Plug-ins

          Affiliate Program

          Awards Institution Evaluation IB Seminar Salon Event Exhibition
          Vietnam Thailand Singapore Dubai
          Fans Party Investment Sharing Session
          FastBull Summit BrokersView Expo

          Coinbase, Binance Plan to List Donald Trump's Official TRUMP Token After Its Phenomenal Debut

          CoinDesk
          Ethereum / Tether
          +1.29%
          1inch / Tether
          -1.54%
          AAVE / Tether
          +1.51%
          Fusionist / Tether
          -2.52%

          The ‘official’ memecoin of the second Donald Trump administration will be listed on major cryptocurrency exchanges including Coinbase and Binance, according to announcements from the companies.

          Coinbase posted on Sunday that it plans to list the TRUMP token. The announcement came via its Coinbase Assets X account, which provides information on new assets, however the exchange did not provide a concrete timeline for listing.

          Binance said it plans to open trading for the TRUMP token on the the morning of Jan. 19. The token is already trading on many other centralized exchanges, such as Bitget, KuCoin and Kraken according to CoinGecko.

          On-chain data shows that the token has a market cap of just over $7.6 billion, and trading volume of approximately $15 billion.

          While many of the largest crypto exchanges have eagerly embraced Trump’s official memecoin, the first Trump-themed token, one of the original Political Finance (PoliFi) tokens, had trouble getting listed on exchanges.

          As CoinDesk reported earlier this year, ByBit and OKX rejected the team’s application to list the token given concerns about the project being too political. Kraken did not respond to their application to list, and would not discuss the matter on the record.

          The first Trump token, the Ethereum-based MAGA, is down 84% from its June high of $17.80, according to CoinGecko, but continues to be actively traded.

          MAGA dumped hard after the launch of the officialTrump token, falling from $3.50 to $1.44 over the weekend with its market cap declining from $158 million to $64 million. The token has slowly recovered after the initial fall likely due to general interest in Trump-themed tokens on the eve of the inauguration.

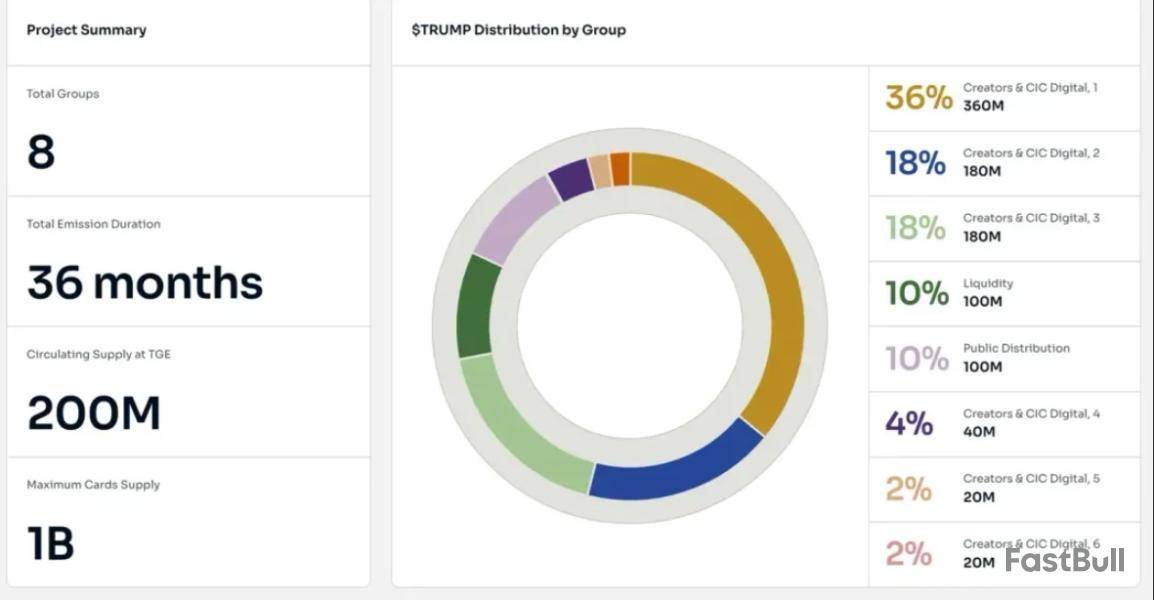
          The tokenomics of TRUMP have been criticized by many online, who have pointed out that 80% of the token supply is controlled by wallets owned by CIC Digital.

          CIC Digital LLC is the Trump Organization affiliated firm that launched Trump Non Fungible Tokens (NFTs) in 2023. Data from OpenSea shows that there’s a second wave of interest in these NFTs with over 2,800 sales in the last 24 hours worth over 765 ETH ($2.5 million).

          Risk Warnings and Disclaimers
          You understand and acknowledge that there is a high degree of risk involved in trading. Following any strategies or investment methods may lead to potential losses. The content on the site is provided by our contributors and analysts for information purposes only. You are solely responsible for determining whether any trading assets, securities, strategy, or any other product is suitable for investing based on your own investment objectives and financial situation.
          Add to Favorites
          Share

          Will Trump’s Inauguration Boost Crypto? Here Are The Top 10 Coins With The Most Potential

          NewsBTC
          Ethereum / Tether
          +1.29%
          1inch / Tether
          -1.54%
          AAVE / Tether
          +1.51%
          Fusionist / Tether
          -2.52%

          As President-elect Donald Trump prepares for his inauguration on January 20, the crypto community is buzzing with anticipation regarding the potential impact of his administration on digital assets. 

          Analysts are closely examining which crypto assets may benefit the most during this pivotal period, especially given Trump’s vocal support for making the United States a leader in the crypto space.

          Market expert Xremlin suggests that Trump’s presidency could usher in a “golden era” for crypto. His analysis focuses on US-founded coins and assets linked to the Trump family, indicating that the inauguration might catalyze significant price movements for certain altcoins. 

          Notably, Eric Trump has publicly shared his investments in Sui (SUI), Solana (SOL), Ethereum (ETH), and Bitcoin (BTC), suggesting a focus on already established cryptocurrencies.

          The Leading Crypto Contenders

          • Ethereum (ETH): The analyst shares that Ethereum remains a cornerstone of the crypto ecosystem, known for its smart contract functionality and diverse use cases. 

          He suggests that as a leading platform for decentralized applications (dApps), its significance in the market is undeniable, making it a staple in any crypto portfolio.

          • Bitcoin (BTC): Often referred to as digital gold, Bitcoin is the most recognized cryptocurrency and serves as a benchmark for the entire market. Xremlin observes its potential inclusion in a US Strategic Bitcoin reserve could further solidify its status and drive additional interest from institutional investors.
          • Solana (SOL): As a US-founded blockchain with a robust user base, Solana has gained attention for its speed and scalability. 

          The analyst speculates that it could soon see the launch of an exchange-traded fund (ETF), which would enhance its visibility and accessibility to mainstream investors.

          • Sui (SUI): Positioned as a direct competitor to Solana, Sui boasts higher transactions per second (TPS) but still lacks a significant user base. 

          Being US-founded, it reportedly stands to gain from any favorable regulatory developments that may arise during Trump’s administration.

          • World Liberty: Initiated by the Trump family, is another one to watch, according to Xremlin. Although it has yet to launch, its connection to the Trump name could reportedly generate price spikes once it enters the market.

          Additional Contenders For The “Trump Trade”

          Beyond the aforementioned digital assets, Xremlin highlights several other US-founded projects are gaining traction and could play a role in the so-called “Trump trade”:

          • Ripple (XRP): Known for its blockchain-based payment protocol, Ripple facilitates real-time cross-border payments, making it a key player for financial institutions.
          • Chainlink (LINK): As a blockchain-agnostic platform, Chainlink connects various chains to major financial institutions, enabling seamless data connectivity and interoperability.
          • Ondo (ONDO): This platform bridges traditional financial products like US bonds and treasuries to the blockchain, enhancing accessibility and efficiency in the DeFi space.
          • Hedera (HBAR): Governed by a council that includes tech giants like Google and IBM, Hedera is designed for fast and energy-efficient transactions, ensuring stability and transparency.
          • Stellar (XLM): Focused on facilitating low-cost cross-border payments, Stellar collaborates with companies such as Circle and MoneyGram to integrate blockchain solutions into the U.S. financial system.

          Featured image from DALL-E, chart from TradingView.com

          Risk Warnings and Disclaimers
          You understand and acknowledge that there is a high degree of risk involved in trading. Following any strategies or investment methods may lead to potential losses. The content on the site is provided by our contributors and analysts for information purposes only. You are solely responsible for determining whether any trading assets, securities, strategy, or any other product is suitable for investing based on your own investment objectives and financial situation.
          Add to Favorites
          Share

          Cardano Price Eyes Breakout To $6 After Bouncing From 43% Drawdown

          NewsBTC
          Ethereum / Tether
          +1.29%
          1inch / Tether
          -1.54%
          AAVE / Tether
          +1.51%
          Fusionist / Tether
          -2.52%

          The Cardano price is targeting a bullish breakout to $6 after experiencing a bounce from its initial 43% downturn. While other cryptocurrencies like XRP and Bitcoin (BTC) recorded massive gains in this bull market, Cardano (ADA) maintained a relatively muted price last year, experiencing significant volatility. Despite this, analysts remain bullish on ADA, emphasizing its potential for a substantial price recovery and a surge to new ATHs.

          Cardano Price Targets $6 ATH

          Ali Martinez, a prominent crypto analyst on X (formerly Twitter), shared a bullish price prediction for Cardano, forecasting a massive surge to $6. The analyst compared the similarities in ADA’s current price movement to historical patterns. He shared two parallel price charts of Cardano depicting its price action from 2018 to 2021 and 2022 to 2025. 

          In the left chart, ADA traded within a sideways accumulation zone, highlighted by the rectangular box, before experiencing a breakout above $0.14. Following the breakout, Cardano’s price corrected by about 43.6%, a massive decline that pushed its value below the $0.1 mark. 

          As is often seen among cryptocurrencies, Cardano’s significant price crash established a solid foundation for a notable rally. After its substantial decline, the cryptocurrency initiated a significant price rally, reaching a peak of approximately $3.08. This remarkable price surge represented a gain of over 4,095%. 

          In the right chart, Martinez identifies a similar sideways accumulation pattern between 2022 and 2023 of this year’s bullish cycle. Following this, Cardano broke out to reach a new price high of $0.8. After this, the altcoin underwent a 42.65%, mirroring the crash in 2021. 

          Based on the historical fractal, Martinez predicts that Cardano could soon initiate its second leg up, potentially mimicking its impressive price rally in 2021 within the next two to three weeks. As a result, the analyst has set a bullish target for Cardano at above $6, marking a significant gain of 2,220.68%.

          While historical patterns do not accurately predict future price movements, they can provide insights into market trends, conditions, and other factors. Martinez’s bullish prediction for the Cardano price relies on the assumption that it can repeat similar market behavior and conditions during its 2021 bull rally. 

          Update On ADA Price Analysis

          As mentioned earlier, the Cardano price declined severely last year despite bullish sentiment spreading to other altcoins in the market. In the last few weeks, ADA seemed to be recovering from bearish trends, as CoinMarketCap’s data showed a price increase of 16% over the past week. Cardano also experienced notable price gains in the last month, rising by over 10%. 

          Although its price has reclaimed its $1 mark, ADA’s momentum seems to be fading, as the cryptocurrency has pulled back, recording a decline of 4% over the last 24 hours. 

          Risk Warnings and Disclaimers
          You understand and acknowledge that there is a high degree of risk involved in trading. Following any strategies or investment methods may lead to potential losses. The content on the site is provided by our contributors and analysts for information purposes only. You are solely responsible for determining whether any trading assets, securities, strategy, or any other product is suitable for investing based on your own investment objectives and financial situation.
          Add to Favorites
          Share

          XRP Breakout Alert: Expert Predicts Potential Surge To $15 After Triangle Formation

          NewsBTC
          Ethereum / Tether
          +1.29%
          1inch / Tether
          -1.54%
          AAVE / Tether
          +1.51%
          Fusionist / Tether
          -2.52%

          As XRP recovers from a notable dip in mid-December, technical analysis signals strong potential for further growth. Currently valued at approximately $3.23, XRP is positioned among the most robust performers in the cryptocurrency market, boasting an impressive 43% gain over the past month.

          This price resurgence has propelled the market’s second-largest altcoin to a seven-year high, inching closer to its previous price record of $3.40, set in 2018.

          Bullish Projections For XRP Price

          In a recent social media update on X (Formerly Twitter), market analyst Ali Martinez highlights the significance of XRP’s recent breakout from a month-long consolidation phase between $1.90 and $2.60.

          Martinez notes that this price breakout has occurred within a symmetrical triangle pattern on the weekly chart, suggesting an optimistic trajectory for the altcoin.

          The analyst projects a possible price target of $15 for XRP, which would represent a staggering increase of over 365% from its current valuation.

          XRP

          Supporting this bullish outlook, XForceGlobal proposed a range of final targets for XRP, estimating potential prices between $7 and $12, with more ambitious projections reaching $20 to $40 and two potential routes for the altcoin’s price:

          • Slower Route: This scenario anticipates a five-wave minor degree into an intermediate degree wave, followed by a wave 1-2 pullback.

          If XRP can manage a controlled pullback in this phase, it would create a favorable environment for further bullish action. While this route may involve a deeper correction, the analyst asserts it ultimately promises the greatest rewards for long-term holders.

          • Faster Route: In this scenario, the current five-wave ascent may already be part of a larger primary wave 5. While this route could still lead XRP to significant price levels around $7 to $12, it also suggests that the bull market may soon reach its conclusion.

          Expert Warns Of Potential Correction March

          Despite the optimistic projections, some experts, like Egrag Crypto, caution investors to remain vigilant. Egrag predicts a significant market correction could occur in March 2025.

          However, the expert also emphasizes that the Relative Strength Index (RSI) remains bullish, indicating that XRP still has room for growth in the short term. He anticipates that XRP may reach price levels between $4 and $5 before any potential downturn.

          All around, XRP stands at a pivotal moment, and its journey from here could redefine its standing in the market. Whether through slower or faster routes, the future looks bright for XRP holders, provided they navigate the anticipated volatility with care.

          At the time of writing, the altcoin is down a slight 1.3% on the 24-hour time frame, trading at $3.23.

          Featured image from DALL-E, chart from TradingView.com

          Risk Warnings and Disclaimers
          You understand and acknowledge that there is a high degree of risk involved in trading. Following any strategies or investment methods may lead to potential losses. The content on the site is provided by our contributors and analysts for information purposes only. You are solely responsible for determining whether any trading assets, securities, strategy, or any other product is suitable for investing based on your own investment objectives and financial situation.
          Add to Favorites
          Share

          Bitcoin Upper Band Moves Above $105,400 – Where Price Is Headed Next

          NewsBTC
          Ethereum / Tether
          +1.29%
          1inch / Tether
          -1.54%
          AAVE / Tether
          +1.51%
          Fusionist / Tether
          -2.52%

          Crypto analyst Tony Severino has provided some insights into the current Bitcoin price action. He revealed that the Bitcoin upper hand has moved above $105,400 and hinted at where the flagship crypto could be heading next.

          What’s Next For Bitcoin Price As Upper Band Moves Above $105,400?

          In an X post, Severino revealed that Bitcoin’s upper band is now above $105,400. With this development, he alluded to a previous analysis in which he revealed what could happen once the price breaks above $105,400. In the analysis, the crypto analyst mentioned that things could get interesting once BTC breaks above $105,400.

          He then predicted that Bitcoin could rally to as high as $170,000. The analyst made this prediction while revealing how BTC witnessed a 90% surge from the wick low at the lower band to the local high. This happened the last time the flagship crypto got a head fake to the lower band before moving to the upper band.

          Based on this trend, Severino believes the Bitcoin price could record another 90% surge and rally to as high as $170,000. This price target is significant as it could mark the top for the flagship crypto. The crypto analyst mentioned that the cycle top for Bitcoin can be discussed once BTC reaches this $170,000 target.

          However, market experts like Standard Chartered have suggested that Bitcoin could rally beyond this $170,000 target. The financial institution predicted that a rally to $200,000 by year-end is achievable. Bernstein analysts also described a rally to $200,000 by year-end as conservative, meaning Bitcoin could rally higher. 

          This bullish outlook for Bitcoin mainly stems from the fact that Donald Trump is set to take office on January 20. The pro-crypto US president-elect is expected to implement a Strategic Bitcoin Reserve for the country, which will boost the flagship crypto’s adoption.

          BTC Not Far Away From A New All-Time High 

          Crypto analyst Rekt Capital has suggested that Bitcoin will soon reach a new all-time high (ATH). In an X post, he stated that BTC is one daily resistance away from breaking out to a new ATH yet again. The crypto analyst added that a daily close above the final resistance followed by a post-breakout retest would be enough to launch the flagship crypto into price discovery.

          Until then, Rekt Capital mentioned that Bitcoin would continue to range between $101,000 and $106,000. Crypto analyst Titan of Crypto offered a more optimistic outlook for the BTC, stating that the flagship crypto has started its rally. He remarked that, as anticipated, the crypto has broken through resistance and is now primed for a strong rally. 

          At the time of writing, Bitcoin was trading at around $103,509, up in the last 24 hours, according to data from CoinMarketCap. 

          Featured image from Pexels, chart from TradingView

          Risk Warnings and Disclaimers
          You understand and acknowledge that there is a high degree of risk involved in trading. Following any strategies or investment methods may lead to potential losses. The content on the site is provided by our contributors and analysts for information purposes only. You are solely responsible for determining whether any trading assets, securities, strategy, or any other product is suitable for investing based on your own investment objectives and financial situation.
          Add to Favorites
          Share

          Official Trump memecoin launch breaks records, as Solana (SOL) rallies to new all-time high

          Cointelegraph
          Ethereum / Tether
          +1.29%
          1inch / Tether
          -1.54%
          AAVE / Tether
          +1.51%
          Fusionist / Tether
          -2.52%

          The cryptocurrency market faced a surprise on Jan. 18 when the “Official Trump” (TRUMP) memecoin, backed by President-elect Donald Trump, was launched without prior notice. The announcement came via Trump’s social media accounts, directing users to purchase the Solana token using a specified centralized intermediary and providing the contract address.

          The memecoin launch sparked a rally in Solana’s native token, pushing it to an all-time high of $270. This surge raised questions among traders about whether SOL’s current $120 billion market capitalization is sustainable and its implications for Ethereum , Solana’s main competitor. Ethereum had previously been perceived as Trump’s favorite due to its allocation within World Liberty Financial, a project closely associated with Trump, but the decision to launch Official Trump on the Solana network has raised eyebrows.

          Official Trump launch timing puts ‘America first’

          Adding to the intrigue was the timing of the launch, which coincided with the Trump-honoring "Crypto Ball,” a high-profile event that brought together industry leaders such as Michael Saylor of MicroStrategy, Coinbase CEO Brian Armstrong, the Winklevoss twins of Gemini, and David Sacks, Trump’s crypto and artificial intelligence adviser. The sold-out event took place just a few blocks from the White House in Washington, D.C.

          Despite the competitive memecoin market, the “Official Trump” (TRUMP) token quickly reached a $6.9 billion market capitalization. It was immediately listed on major exchanges, including Bybit, Bitget, and KuCoin. The memecoin launched with 200 million tokens in circulation and a total supply of up to 1 billion, with 80% allocated to the issuers.

          Issuers reportedly deposited 44.4 million TRUMP tokens into single-sided liquidity pools, meaning no direct pairing with assets like stablecoins. The decentralized exchange Meteora (DEX) was chosen to manage the automated market-making (AMM) process alongside Jupiter DEX. The two largest liquidity pools were TRUMP-USDC, with a total value locked (TVL) of $483 million, and TRUMP-SOL, holding $67 million.

          Currently trading at $24.60, the “Official Trump” (TRUMP) token is ranked as the 28th largest cryptocurrency by market capitalization, with trading volumes exceeding $7 billion across decentralized and centralized exchanges. For comparison, TRUMP's trading volume has surpassed Dogecoin (DOGE), the oldest memecoin and a sector leader with a $58 billion market cap. As a result, Solana’s decentralized platforms, such as Meteora and Raydium, saw significant benefits from the TRUMP token launch.

          Official Trump memecoin solidifies Solana’s dominance in crypto and DeFi

          The memecoin market overall experienced a negative impact as traders shifted their focus to the President-elect’s token. More than 200,000 users purchased “Official Trump” (TRUMP) directly through its official app, Moonshot, which facilitated nearly $400 million in trading volume. In contrast, Dogecoin dropped 6%, Shiba Inu (SHIB) fell 7.5%, PEPE declined by 10.5%, and Dogwifhat (WIF) saw an 8% decrease.

          For Ether holders, the event posed a double challenge. First, it strengthened Solana’s position as the go-to ecosystem for token launches. Second, it diminished expectations that the Trump administration might favor Ethereum, despite Trump’s previous connections to the Ethereum-based World Liberty Finance project.

          Whether the “Official Trump” (TRUMP) token can maintain its price above $20 remains uncertain. Furthermore, for SOL price to break through $300, the Solana network must significantly expand its market share in terms of deposits and institutional adoption. This growth is also contingent on the approval of a Solana spot exchange-traded fund (ETF) by the US Securities and Exchange Commission, which remains a key catalyst for future gains.

          This article is for general information purposes and is not intended to be and should not be taken as legal or investment advice. The views, thoughts, and opinions expressed here are the author’s alone and do not necessarily reflect or represent the views and opinions of Cointelegraph.

          Risk Warnings and Disclaimers
          You understand and acknowledge that there is a high degree of risk involved in trading. Following any strategies or investment methods may lead to potential losses. The content on the site is provided by our contributors and analysts for information purposes only. You are solely responsible for determining whether any trading assets, securities, strategy, or any other product is suitable for investing based on your own investment objectives and financial situation.
          Add to Favorites
          Share

          Raydium Breaks Key Level Showing Relative Strength – New Highs Next?

          NewsBTC
          Ethereum / Tether
          +1.29%
          1inch / Tether
          -1.54%
          AAVE / Tether
          +1.51%
          Fusionist / Tether
          -2.52%

          Raydium (RAY) has had an exceptionally bullish week, surging over 62% in less than six days and capturing the spotlight in the decentralized exchange (DEX) market. This impressive rally has positioned Raydium as a market leader, with strong momentum that shows no signs of slowing down. The cryptocurrency recently cleared last year’s high, a significant milestone that further bolsters its bullish outlook.

          Top analyst BigCheds shared insights into Raydium’s performance, highlighting its relative strength in the market. According to BigCheds, the token’s ability to outperform in a volatile environment signals strong demand and solidifies its position as one of the top-performing DEX tokens. This bullish momentum is drawing increased attention from traders and investors who see the potential for even greater gains in the near term.

          Raydium’s breakout above last year’s high is a significant technical achievement, paving the way for further upward movement. With market sentiment turning increasingly positive and Raydium showcasing resilience and strength, the DEX is well-positioned to capitalize on its recent momentum. As it continues to outperform, many are watching closely to see just how high Raydium can go in this bullish phase. The coming days will be crucial for determining its next big move.

          Raydium Reaches Multi-Year Highs

          Raydium has made a significant move, breaking above the $6.5 mark just a few hours ago and continuing to push higher as the cryptocurrency market gains momentum. This breakout signals strong bullish sentiment for the token, as both technical and fundamental factors align to support further price appreciation. As the leading decentralized exchange (DEX) on Solana, Raydium’s growth and dominance within the ecosystem further bolster its long-term potential.

          Top analyst Cheds recently shared a technical analysis on X, emphasizing Raydium’s relative strength compared to other altcoins. According to Cheds, RAY’s ability to outperform in a volatile market environment highlights the strong demand driving its rally. The token’s decisive move above key supply levels is a bullish indicator that could pave the way for significant gains in the coming days.

          Raydium showing relative strength | Source: BigCheds on X

          Beyond technicals, Raydium’s fundamentals remain robust, contributing to its strong performance. The DEX has cemented itself as a critical component of the Solana ecosystem, providing liquidity and facilitating seamless trading for a wide range of assets. Its expanding user base and consistent innovation reinforce investor confidence, making it a top choice for traders and liquidity providers alike.

          As Raydium builds on its momentum, clearing critical price levels and pushing higher, many investors are now targeting even loftier price points. If the market continues to heat up and RAY maintains its relative strength, the potential for a massive rally becomes increasingly likely. With its strong fundamentals and bullish technical outlook, Raydium is well-positioned to capture further gains, making it one of the most exciting altcoins to watch in this current market cycle. The coming days will be pivotal in determining how far RAY can go in this bullish phase.

          RAY Breaking Above Key Levels

          Raydium is currently testing levels not seen since 2022, signaling a remarkable resurgence in its price action. The token’s strong momentum suggests it is primed for further gains, with bullish sentiment dominating the market. However, a potential retest of the $6.5 level could be on the horizon, providing an opportunity for consolidation before the next leg up.

          RAY Breaks multi-year highs | Source: RAYUSDT chart on TradingView

          As of now, RAY is holding above the critical $6.70 mark, a level that solidifies bullish control. Maintaining this support is crucial, as it underscores market confidence and sets the foundation for continued upward movement. If bulls can defend this level, the next logical target for RAY would be the $7 mark—a key psychological and technical resistance that, once cleared, could pave the way for even greater gains.

          Market sentiment around Raydium remains optimistic, with both technical indicators and fundamentals aligning to support its bullish trajectory. As the leading decentralized exchange (DEX) on Solana, RAY continues to benefit from strong utility and growing adoption, further reinforcing its appeal to investors.

          Featured image from Dall-E, chart from TradingView

          Risk Warnings and Disclaimers
          You understand and acknowledge that there is a high degree of risk involved in trading. Following any strategies or investment methods may lead to potential losses. The content on the site is provided by our contributors and analysts for information purposes only. You are solely responsible for determining whether any trading assets, securities, strategy, or any other product is suitable for investing based on your own investment objectives and financial situation.
          Add to Favorites
          Share
          FastBull
          Copyright © 2025 FastBull Ltd

          728 RM B 7/F GEE LOK IND BLDG NO 34 HUNG TO RD KWUN TONG KLN HONG KONG

          TelegramInstagramTwitterfacebooklinkedin
          App Store Google Play Google Play
          Products
          Charts

          Chats

          Q&A with Experts
          Screeners
          Economic Calendar
          Data
          Tools
          Membership
          Features
          Function
          Markets
          Copy Trading
          Latest Signals
          Contests
          News
          Analysis
          24/7
          Columns
          Education
          Company
          Careers
          About Us
          Contact Us
          Advertising
          Help Center
          Feedback
          User Agreement
          Privacy Policy
          Business

          White Label

          Data API

          Web Plug-ins

          Poster Maker

          Affiliate Program

          Risk Disclosure

          The risk of loss in trading financial instruments such as stocks, FX, commodities, futures, bonds, ETFs and crypto can be substantial. You may sustain a total loss of the funds that you deposit with your broker. Therefore, you should carefully consider whether such trading is suitable for you in light of your circumstances and financial resources.

          No decision to invest should be made without thoroughly conducting due diligence by yourself or consulting with your financial advisors. Our web content might not suit you since we don't know your financial conditions and investment needs. Our financial information might have latency or contain inaccuracy, so you should be fully responsible for any of your trading and investment decisions. The company will not be responsible for your capital loss.

          Without getting permission from the website, you are not allowed to copy the website's graphics, texts, or trademarks. Intellectual property rights in the content or data incorporated into this website belong to its providers and exchange merchants.

          Not Logged In

          Log in to access more features

          FastBull Membership

          Not yet

          Purchase

          Become a signal provider
          Help Center
          Customer Service
          Dark Mode
          Price Up/Down Colors

          Log In

          Sign Up

          Position
          Layout
          Fullscreen
          Default to Chart
          The chart page opens by default when you visit fastbull.com